1955
Prediction for clinical outcome using prominent vessel sign in patients with subacute cerebral infarction1The First Affiliated Hospital of Dalian Medical University, Dalian, China, 2GE Healthcare, Beijing, China
Synopsis
Keywords: Stroke, Susceptibility, Hemorrhagic transformation
This study was to investigate the effect of prominent vessel sign (PVS) in patients with unilateral subacute infarction on hemorrhagic transformation (HT) and short-term prognosis by using susceptibility-weighted imaging (SWI). It was found that there were no significant differences in the incidence of prominent cortical veins (PCV), prominent medullary veins (PMV), PCV+PMV, SWI-ASPECT score and SWI-DWI mismatch score between two groups. Although higher than the HC group, there was no difference in venous MSV between HT and NHT groups. NIHSS score was negatively correlated with SWI-ASPECT score and DWI-ASPECT score and NIHSS score at discharge was negatively correlated with the proportion of PCV, PCV + PMV and MSV of CV. This study suggesting that PVS had little effect on HT in patients with unilateral subacute infarction, but related to worse short-term clinical status.Introduction
Hemorrhagic transformation (HT) is a part of the natural course of cerebral infarction, which is related to poor prognosis. Prominent vessel sign (PVS) on susceptibility-weighted imaging (SWI) sequences has been correlated with the amount of deoxyhemoglobin in the cerebral venous compartments secondary to an increased oxygen extraction fraction in the ischemic tissue, it can be used to predict infarct growth and poor outcome1. In most previous studies, the clinical significance of PVS have been analyzed, but rarely did the studies provide conclusive results on the relationship between PVS and HT2. Hence, in our study, we analyzed PVS between two groups in subacute infarction patients and the relationship with short-term prognosis.Methods
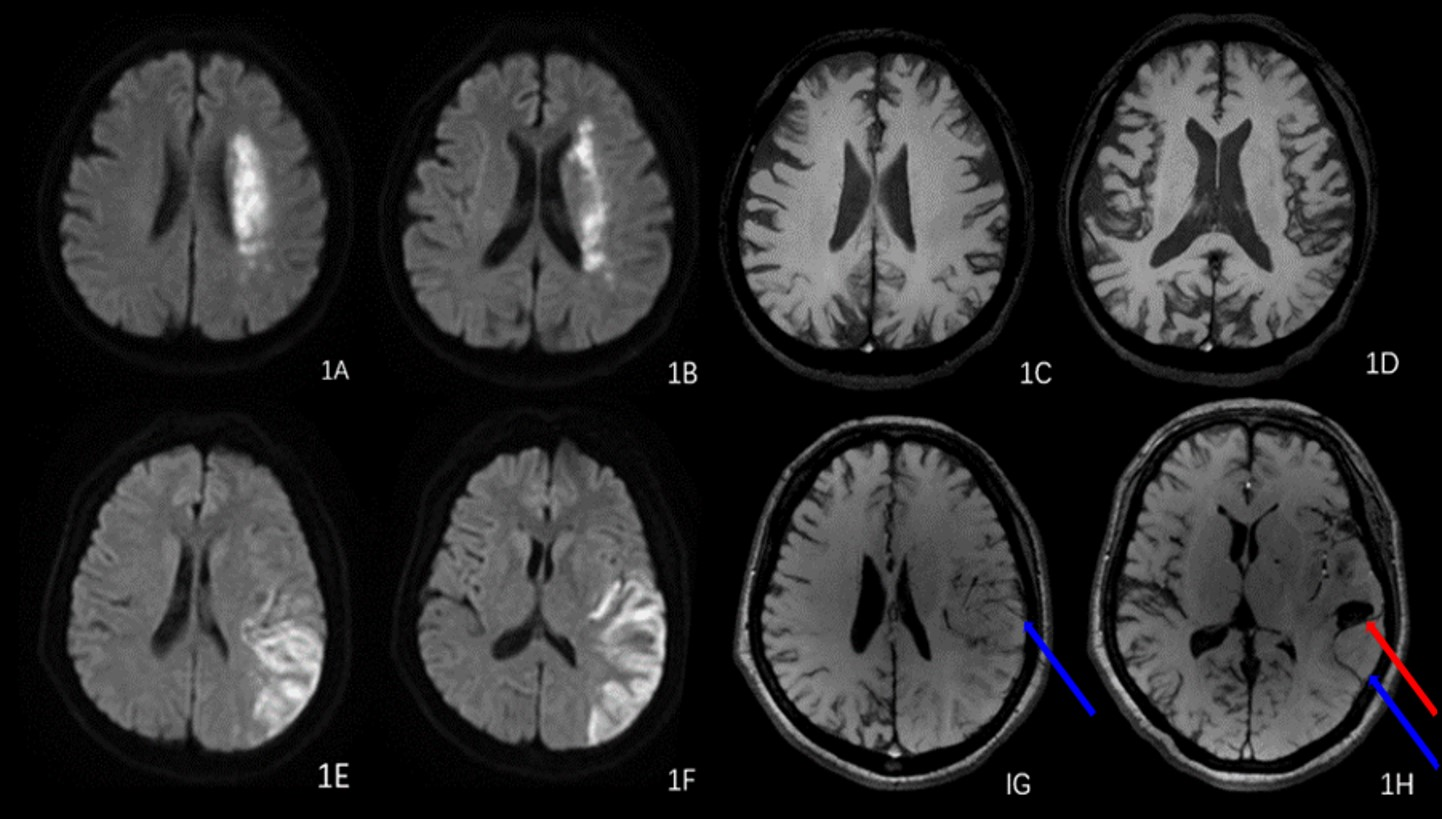
54 patients and 20healthy controls (HCs) were enrolled. All patients with subacute ischemic stroke due to large-vessel stenosis or occlusion in the anterior circulation with aggressive supportive treatment. All subjects were imaged on the GE Signa 1.5 MRI system, the multimodal MRI protocol included conventional scan and ESWAN. All patients were divided into HT and NHT group based on hemorrhage. According to the location, prominent cortical veins (PCV) were defined as a regional prominence of hypointense vessels with either more numerous or larger veins and greater signal loss in the cortical areas, meanwhile, prominent medullary veins (PMV) were assessed in the white matter. The proportion of PCV, PMV, PCV+PMV were quantified by two radiologists. The range of PVS, DWI infarction and SWI-DWI mismatch were determined based on ASPECT score. The cerebral venous magnetic susceptibility values (MSV) were measured in bilateral prominent cortical veins (CV), septal veins (SV), thalamostriate vein (TSV), cerebral internal veins (ICV) and basal veins (BV) by signal processing in nuclear magnetic resonance (SPIN) software. The following clinical information was obtained: age, gender, time from symptom onset to MRI examination, National Institute of Health Stroke Scale (NIHSS) score, and clinical history. Measurement data was analyzed with the t-test, Mann-Whitney U test and the One& Way ANOVA test and enumeration data was treated with the chi-square test or Fisher’s exact test. Spearman correlation analysis were used to analyze the relationships between NIHSS scores and other parameters.Results
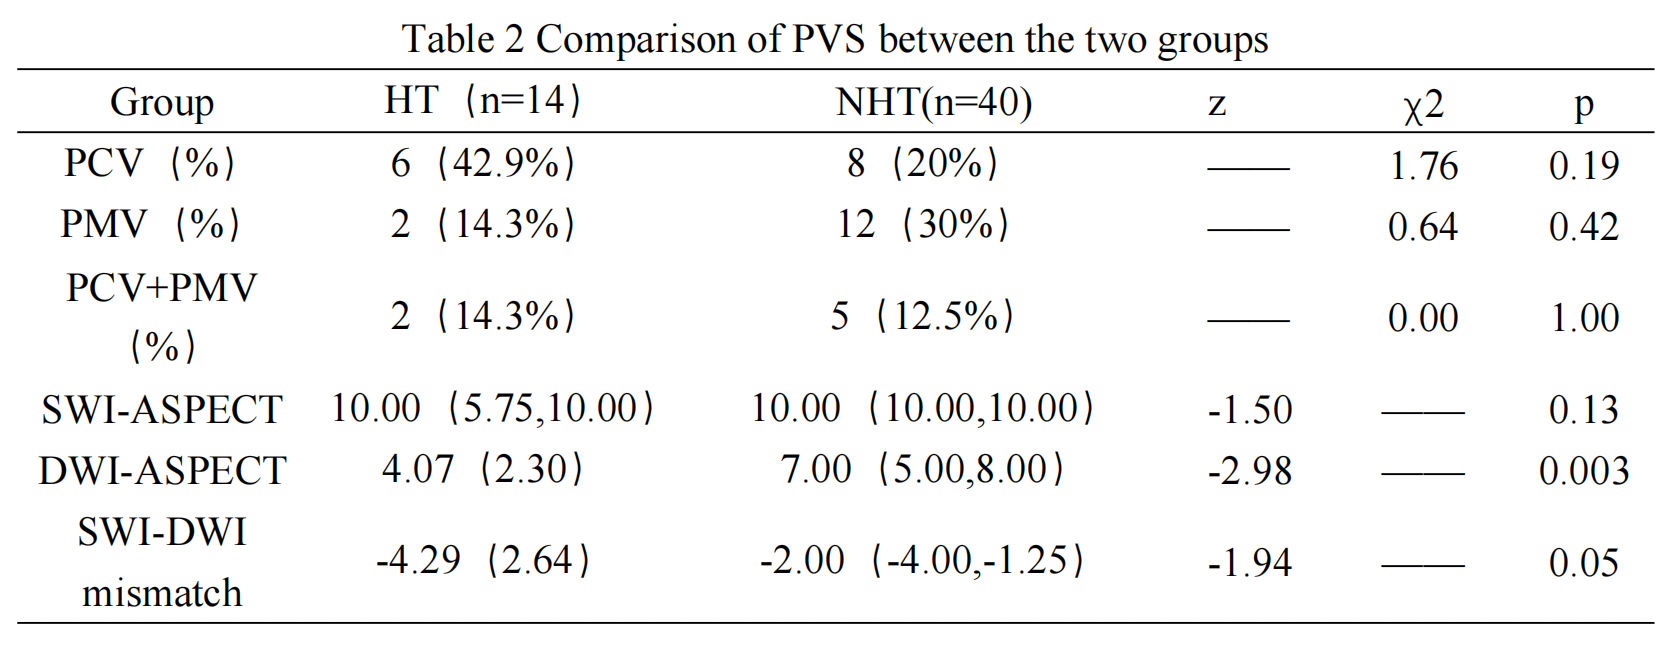
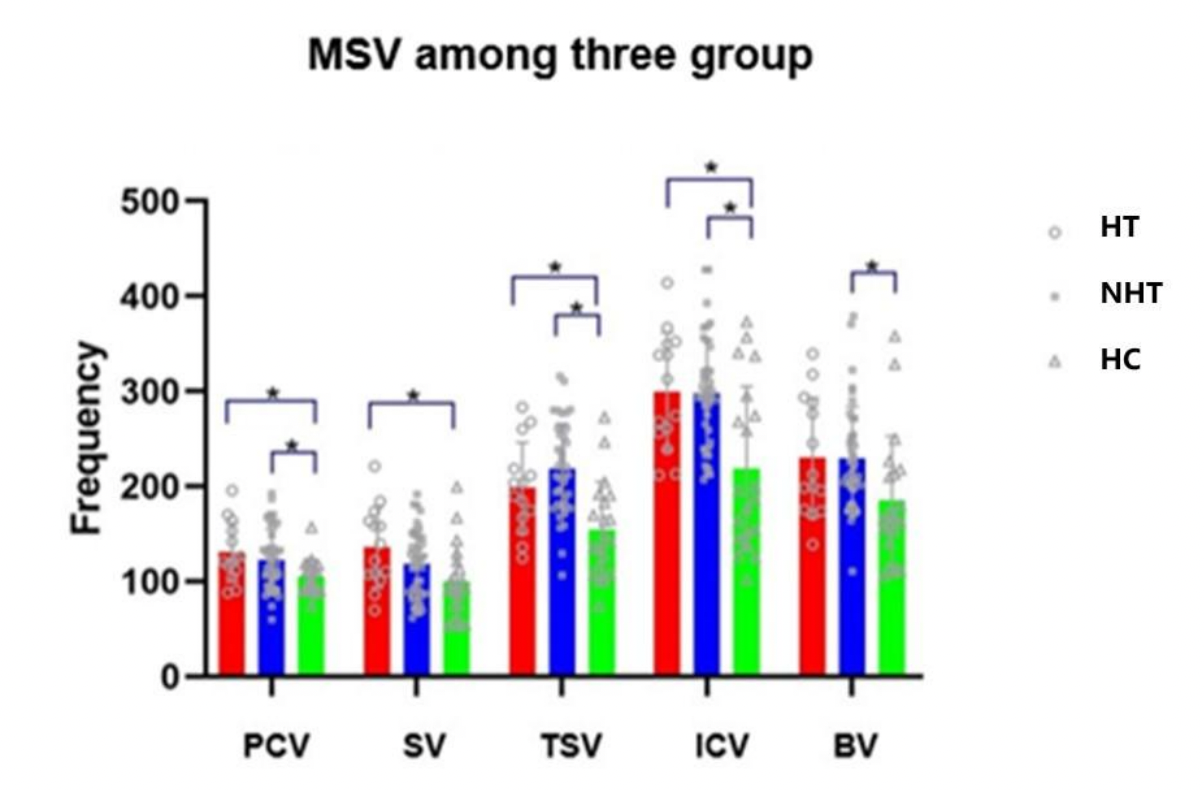
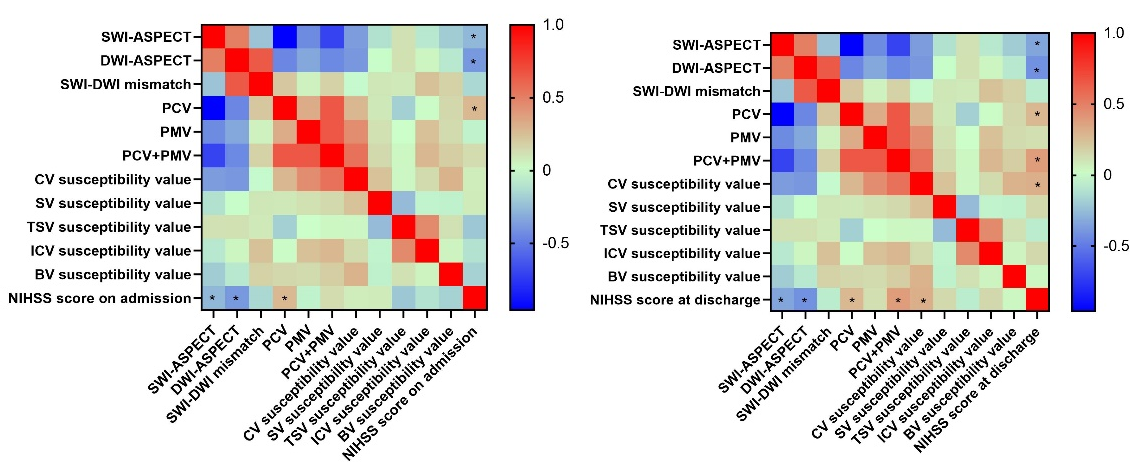
NIHSS score at discharge were statistically higher in HT (Table 1). There was no significant difference in the incidence of PCV, PMV, PCV+PMV, SWI-ASPECT score and SWI-DWI mismatch score between two groups (P > 0.05), the DWI-ASPECT score was lower in HT (p<0.05, Table 2). There was no difference in MSV between HT and NHT, but some of them were higher than HCs (Figure 2). NIHSS score was negatively correlated with SWI-ASPECT score (NIHSS score on admission, R=-0.27, p=0.045, NIHSS score at discharge, R=-0.34, p=0.01) and DWI-ASPECT score (NIHSS score on admission, R=-0.39, p=0.00, NIHSS score at discharge, R=-0.42, p=0.00). In addition, NIHSS score at discharge was correlated with the proportion of PCV (R=0.28, p=0.04), PCV + PMV (R=0.38, p=0.01) and MSV of CV(R=0.31, p=0.02), NIHSS score on admission was correlated with the proportion of PCV (R=0.28, p=0.04, Figure 3).Discussion
Previous report studies suggest that PVS in ischemic can be considered as imaging biomarker representing collateral status and functional outcomes3. Although controversial, PVS reflects collateral status to a certain extent, which is related to HT4. This study found that there was no statistical difference in PVS between HT and NHT groups. First of all, the subjects included in this study were massive cerebral infarction with many basic diseases, which will affect the brain metabolism. And then, we analyzed subacute cerebral infarction, longitudinal imaging also showed that the OEF ratio is normalized between baseline and follow-up scans several days afterward5. In addition, brain edema also affected the display of PVS after a massive infarction, which would have a certain impact on the results. Therefore, this study suggests that appearance of PVS can’t indicate the HT in subacute cerebral infarction. PVS has been proven to be associated with presence of arterial occlusion or severe stenosis6 and reflected a state of misery perfusion. We showed that the patients with PVS had higher NIHSS scores indicating that the occurrence of PVS represents a worse clinical prognosis.Conclusion
There were no differences in occurrence and range size of PVS and venous MSV of infarcted cerebral hemisphere between HT and NHT. PVS had little effect on HT in patients with unilateral subacute infarction, but positively correlation with NIHSS score.Acknowledgements
No acknowledgement found.References
1. Jing L, Sui B, Shen M, Qin H, Gao P. Are prominent medullary veins better than prominent cortical veins as predictors of early clinical outcome in patients with acute ischemic stroke? DDiagn Interv Radiol 2021; 27: 285–292
2. Drozdov AA, Javan R, Leon Guerrero CR, Sparks AD, Taheri MR. Asymmetry of medullary veins on multiphase CT-angiography in patients with acute ischemic stroke. J Stroke Cerebrovasc Dis. 2020 Oct;29(10):105064. doi: 10.1016/j.jstrokecerebrovasdis.2020.105064. Epub 2020 Jul 28.
3. Zhi hua, Yang, Duan, et al. Asymmetric Deep Medullary Veins in Patients With Occlusion of a Large Cerebral Artery: Association With Cortical Veins, Leptomeningeal Collaterals, and Prognosis. [J]. Frontiers in neurology, 2019, 10:1292-1292.
4. Bang OY, Saver JL, Kim SJ, Kim GM, Chung CS, Ovbiagele B, et al. Collateral flow averts hemorrhagic transformation after endovascular therapy for acute ischemic stroke. Stroke. (2011) 42:2235–9. 10.1161/STROKEAHA.110.604603
5. Wu D, Zhou Y, Cho J, Shen N, Li S, Qin Y, Zhang G, Yan S, Xie Y, Zhang S, Zhu W, Wang Y. The Spatiotemporal Evolution of MRI-Derived Oxygen Extraction Fraction and Perfusion in Ischemic Stroke. Front Neurosci. 2021 Aug 16;15:716031. doi: 10.3389/fnins.2021.716031. PMID: 34483830; PMCID: PMC8415351.
6. Payabvash S, Benson JC, Taleb S, et al. Prominent cortical and medullary veins on susceptibility-weighted images of acute ischaemic stroke. Br J Radiol 2016; 89:20160714.
Figures