1953
Framework for Categorizing Intracerebral Hemorrhage Age: A Step Towards Fully-Automated Characterization and Visualization1Medical Physics, University of Wisconsin - Madison, Madison, WI, United States, 2Radiology, University of Wisconsin - Madison, Madison, WI, United States, 3Neurosurgery, University of Wisconsin - Madison, Madison, WI, United States, 4Biomedical Engineering, University of Wisconsin - Madison, Madison, WI, United States
Synopsis
Keywords: Stroke, Blood
Previous deep learning networks have autonomously identified, segmented, and quantified hematoma volumes in MR images of intracerebral hemorrhages (ICH). This information derived from this analysis would periodically augment surgical decisions during minimally invasive ICH evacuations. A limitation of these autonomous processes is the MRI contrast variations with varying clot ages precludes a generalizable CNN for ICH. We propose a multiparametric image processing pipeline for categorizing clots on the basis of their age, as determined by presented image contrast relative to local white matter. This determination can be used to select a properly trained CNN model based on age classification.Introduction
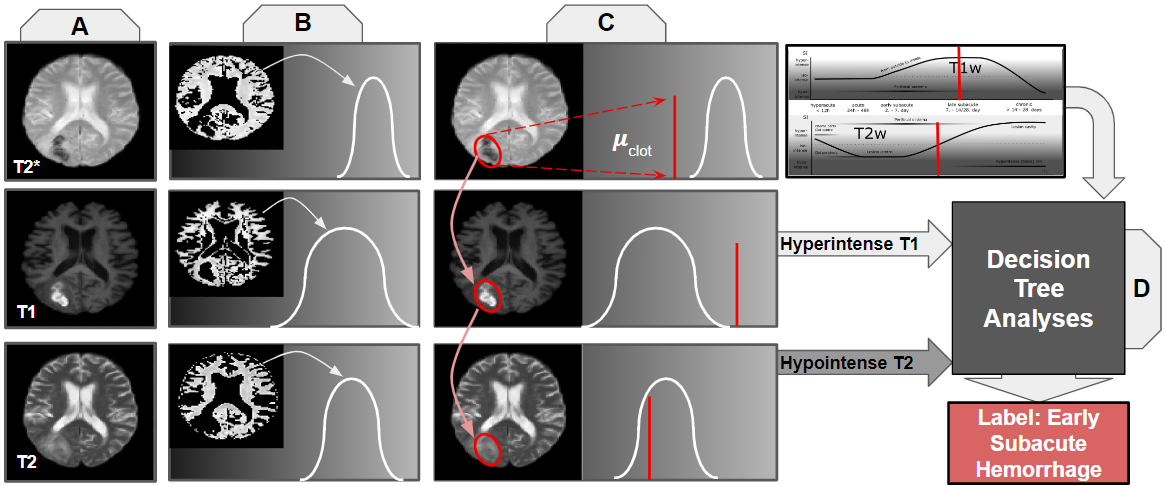
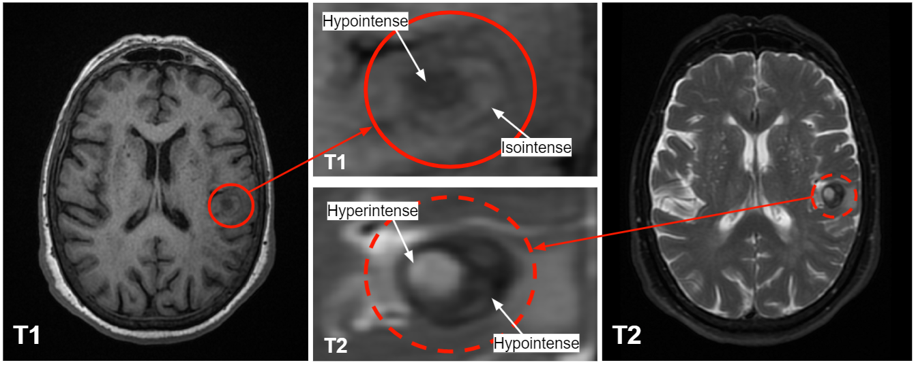
Tools previously called-for by neurosurgeons, deep learning networks, have automatically segmented and assessed the volume of brain hemorrhages in an attempt to provide neurosurgeons with information to safely evacuate clots while achieving maximum residual clot under 15 ml1,2. However, age-varying MR contrast in clots, illustrated in Figure 1, hindered the generalizability of a DL segmentation model3. Practically, a comprehensive solution would require different segmentation models per age strata, for consistent defining features. We propose steps, illustrated in Figure 2, to automate these high-level, subjective classifications by drawing cross-parametric comparisons between white matter intensity and mean clot intensity to assign age-labels to clots.Methods
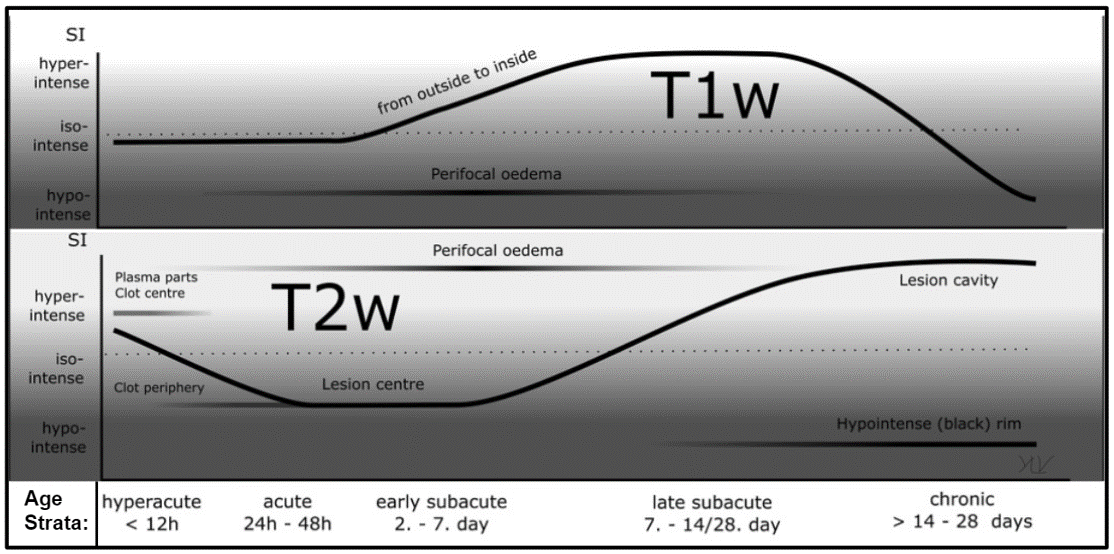
MR contrast of an intracerebral hemorrhage (ICH) varies over time with the degeneration of red blood cells. As shown in Fig. 1, changes in blood oxygenation, hemoglobin decompartmentalization, and iron breakdown cause oscillations in T1-W and T2-W image contrast. Clots may be stratified into one of five categories, defined by characteristic multiparametric contrast and time from hemorrhage onset to imaging: hyperacute, acute, early subacute, late subacute, and chronic4. When precise onset times are unknown, neuroradiologists infer these relative differences by comparing clot signal intensity to local white matter.Data Acquisition and Classification:
From our institution’s records, 14 MR scans of ICH patients were collected. Each contained a T1 (BRAVO, MP-RAGE, 3D T1-TFE) scan, a T2w scan with fat saturation, and a T2* GRE scan. All images were acquired on 3T GE machines at the UW hospital. Two brains in the dataset had multiple hematomas, making for 16 total clots. Our retrospective IRB did not include information on clot onset time. Therefore, ground truth clot age categorizations were determined through manual inspection by two independent neuroradiologists. Their classifications were largely in agreement, differing on 3 in the 16 clot dataset.
We next elaborate on the steps shown in Figure 2 [A-D].
Preprocessing:
Each scan was skull-stripped using tools available in the FSL software library to remove signal from extraneous anatomy (Figure 2A)5,6. They were then co-registered to an MNI brain anatomy template7.
Intensity Determinations:
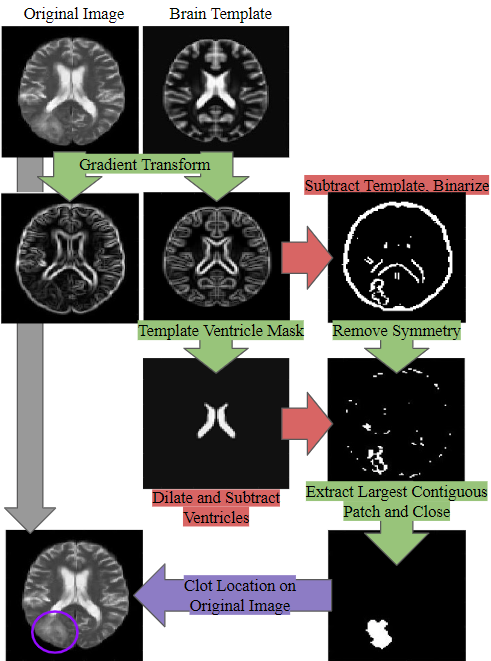
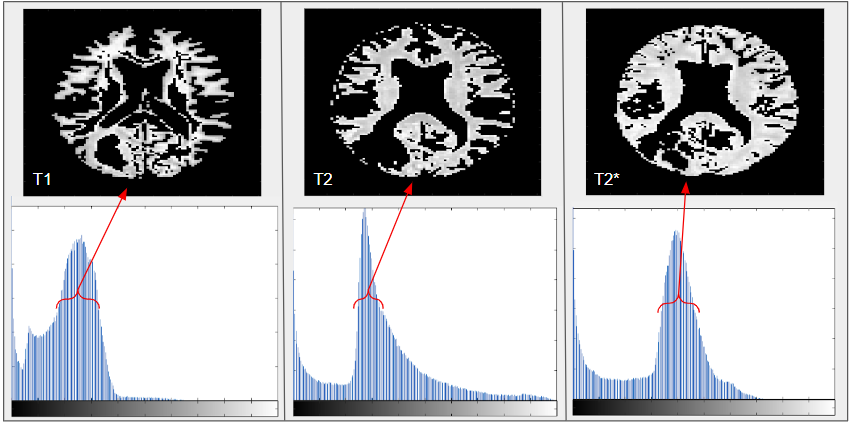
Each scan was intensity normalized and histograms were generated for each MR contrast weighting to determine white matter intensity over the total brain volume (Fig. 2B) using MATLAB8. The mode of each histogram was taken to be the white matter intensity. Leveraging the asymmetry of these irregular pathologies, a series of image processing filters and techniques isolated the general location of the hemorrhage, as shown in Figure 3. Given this approximate location, clot intensity is sampled for comparison against white matter.While this methodology is sufficient for an approximate localization and intensity sample, it is far too rough for direct support of surgical decision-making. Methods akin to these, but more intensive, have been applied to the task of ICH segmentation by others9.
From white matter intensity histograms, standard deviations of white matter values were calculated for each scan weighting (Fig. 4). The mean intensity value from each clot sample was compared to white matter intensity for each parametric image (Fig. 2C). Categorical decisions of hypo-, iso-, or hyper intensities were quantified based on whether or not the clot regions’ mean intensities fell within one standard deviation of the mode intensity of white matter.
Decision Tree for Comparing Clot to White Matter:
As shown in Figure 2D, a Decision Tree produces a clot age characterization based on the parametric comparisons computed in Figure 2C. The internals of the Decision Tree are based on the intensity trends outlined in Figure 1.
Results
The clot localization process was able to correctly isolate the approximate location of 13 out of the 16 clots. Given appropriate localization of the clot, the decision tree categorization methodology was able to match expert age categorization for 11 of the cases in our initial 16 clot dataset.Discussion
The clot location filtering process struggled most on isointense clots and those on the brain’s line of bilateral symmetry. In cases with multiple hemorrhages, it was necessary to choose only one for analysis. The decision tree algorithm matched 11/16 expert age categorizations. Of the 5 incorrect classifications, 3 were cases that expert raters disagreed on. In these, we defaulted to the more senior neuroradiologist’s assessment. However, DL networks between adjacent classifications may work well enough that some errors are tolerable for the surgical task.This demonstrates the nontriviality of age categorization, and the need for consistent methods to eliminate the effects of interobserver variability. The heterogeneous nature of some clots, shown in Figure 5, can make definitive quantization difficult. More refined analysis of clot contrast can be employed to correct this issue.
Conclusion
The developed methodology is able to label a clot as being hyperacute, acute, early subacute, late subacute, or chronic using multiparametric scan data, including T1-W, T2-W, and T2*-W scans of each ICH case. Such an output would automatically determine which DL network is appropriate to guide a surgical intervention. Future work will expand the dataset volume and refine the accuracy of automated steps like clot localization and categorization. Results of this work may be used to inform later age- or contrast-dependent processing steps in autonomous workflows.Acknowledgements
We acknowledge GE Healthcare and UW-Madison Radiology for research support.References
[1] Hanley DF, Thompson RE, Rosenblum M, Yenokyan G, Lane K, McBee N, Mayo SW, Bistran-Hall AJ, Gandhi D, Mould WA, Ullman N, Ali H, Carhuapoma JR, Kase CS, Lees KR, Dawson J, Wilson A, Betz JF, Sugar EA, Hao Y, Avadhani R, Caron JL, Harrigan MR, Carlson AP, Bulters D, LeDoux D, Huang J, Cobb C, Gupta G, Kitagawa R, Chicoine MR, Patel H, Dodd R, Camarata PJ, Wolfe S, Stadnik A, Money PL, Mitchell P, Sarabia R, Harnof S, Barzo P, Unterberg A, Teitelbaum JS, Wang W, Anderson CS, Mendelow AD, Gregson B, Janis S, Vespa P, Ziai W, Zuccarello M, Awad IA, Investigators MI. Efficacy and safety of minimally invasive surgery with thrombolysis in intracerebral haemorrhage evacuation (MISTIE III): a randomised, controlled, open-label, blinded endpoint phase 3 trial. Lancet. 2019;393(10175):1021-32. Epub 2019/02/12. doi: 10.1016/S0140-6736(19)30195-3. PubMed PMID: 30739747; PMCID: PMC6894906.
[2] Sean P Polster, MD, Julián Carrión-Penagos, MD, Seán B Lyne, BS, Barbara A Gregson, PhD, Ying Cao, MS, Richard E Thompson, PhD, Agnieszka Stadnik, MS, Romuald Girard, PhD, Patricia Lynn Money, NP, Karen Lane, CMA, Nichol McBee, MPH, Wendy Ziai, MD, W Andrew Mould, MPH, Ahmed Iqbal, FRCR, Stephen Metcalfe, MRCSEd, FRCS (Neurosurg.), Yi Hao, PhD, Robert Dodd, MD, PhD, Andrew P Carlson, MD, Paul J Camarata, MD, Jean-Louis Caron, MD, Mark R Harrigan, MD, Mario Zuccarello, MD, A David Mendelow, PhD, FRCS, Daniel F Hanley, MD, Issam A Awad, MD, MSc, MA (Hon.), on behalf of the MISTIE III and STICH I and II investigators, Intracerebral Hemorrhage Volume Reduction and Timing of Intervention Versus Functional Benefit and Survival in the MISTIE III and STICH Trials, Neurosurgery, Volume 88, Issue 5, May 2021, Pages 961–970, https://doi.org/10.1093/neuros/nyaa572
[3] Lilieholm T, Henningsen M, Ahmed A, McMillan, A Block WF, Neural Network for Autonomous Segmentation and Volumetric Assessment of Clot and Edema in Intracerebral Hemorrhages, Proc. of International Society of Magnetic Resonance in Medicine, 2021.
[4] Gaillard, F., Jones, J. Hemorrhage on MRI. Reference article, Radiopaedia.org. (accessed on 08 Nov 2021) https://doi.org/10.53347/rID-6671
[5] S.M. Smith. Fast robust automated brain extraction. Human Brain Mapping, 17(3):143-155, November 2002.
[6] Jenkinson, M., Bannister, P., Brady, J. M. and Smith, S. M. Improved Optimisation for the Robust and Accurate Linear Registration and Motion Correction of Brain Images. NeuroImage, 17(2), 825-841, 2002.
[7] Evans, A.C., Collins, D.L., Mills, S.R., Brown, E.D., Kelly, R.L., Peters, T.M., 1993. 3D statis- tical neuroanatomical models from 305 MRI volumes. Proc IEEE-Nuclear Science Symposium and Medical Imaging Conference, pp. 1813–1817.[8] MATLAB. (2021). version 9.11.0.1769968 (R2021b). Natick, Massachusetts: The MathWorks Inc.
[9] Pszczolkowski S, Law ZK, Gallagher RG, Meng D, Swienton DJ, Morgan PS, Bath PM, Sprigg N, Dineen RA. Automated segmentation of haematoma and perihaematomal oedema in MRI of acute spontaneous intracerebral haemorrhage. Comput Biol Med. 2019 Mar;106:126-139. doi: 10.1016/j.compbiomed.2019.01.022. Epub 2019 Jan 29. PMID: 30711800; PMCID: PMC6382492.
[10] Voss, Y. Timeline diagram of MRI and CT characteristics of intracerebral hemorrhage. Case study, Radiopaedia.org. (accessed on 08 Nov 2021) https://doi.org/10.53347/rID-55643.
Figures