1945
GluCEST MRI at 3.0 T Identifies Glutaminase Alteration in Patients with Stroke1Department of Radiology, Sun Yat-Sen Memorial Hospital,Sun Yat-Sen University, Guangzhou, China, 2Philips Healthcare, Guangzhou, China, 3Philips Healthcare, Beijing, China
Synopsis
Keywords: Stroke, CEST & MT, Glutamate
This study investigated the feasibility of GluCEST at 3.0 T for detecting the change of glutamate in the human brain after stroke. The imaging capability of glutamate is validated on the phantom and human brain, respectively. Glutamate at physiological concentrations could be detected by in vitro MRI. The findings of an in vivo investigation revealed that the GluCEST signal of stroke patients differs from that of healthy individuals and that this difference may be detected by 3.0 T MRI. This work provides fresh insights into the use of endogenous glutamate MRI imaging.Introduction
Stroke is the second-leading cause of mortality and the main cause of disability on a global scale1. Glutamate (Glu) is the primary excitatory neurotransmitter in the brain and is likely involved in almost all signal-processing activities of the central nervous system (CNS), as well as being changed in several CNS diseases2-4. However, current MRI techniques are incapable of visualizing the neurotransmitter distribution in the brain. GluCEST5 is the chemical exchange saturation transfer effect (CEST) between the glutamate's-amine group and bulk water that is pH and concentration-dependent. Moreover, GluCEST mapping from a healthy human brain was achieved at 7.0 T in a previous study6. This study aims to determine the best acceleration factor of compressed sensing and investigate the clinical availability of GluCEST at a conventional 3.0 T magnetic field.Method
Phantom PreparationIn brief, Glu, GABA, Arg and Gly were added into PBS to obtain solutions of different concentrations (Glu [10 mM ], GABA [40 mM ], Arg [20 mM ], Gly [40 mM ]), which were prepared in small test tubes with the pH adjusted to 7. The tubes, including amino acid solutions and the pure PBS, were immersed into a beaker filled with 1% agarose gel to minimize susceptibility inhomogeneity.Phantom ImagingGluCEST MRI was acquired with a turbo spin echo (TSE) sequence. Multi-transmission RF channels allowed the RF pulse train to be achieved up to 100% duty cycle. The imaging parameters were: slice thickness = 2 mm, flip angle = 90 °, TR = 4500 ms, TE = 7.8 ms, field of view (FOV) = 70 ×70 mm2, matrix size = 232 × 232, NSA = 2, with one saturation pulse and 64 segments acquired every 15 s. CEST images were collected using a saturation pulse at a B1rms of 6 μT and 2 s duration and frequencies from −5 to +5 p.p.m. in steps of 0.5 p.p.m as well as 0.25 p.p.m around frequencies of ±3 p.p.m.
Human Study
The normal volunteers (n=2) and patients with stroke (n=1) were recruited. Informed consent from each people was obtained after explaining the study protocol. All patients underwent conventional MRI examinations on a 3.0 T MR scanner (Ingenia 3.0 DNA II, Philips Healthcare), including T1-weighted images (T1WIs), T2-weighted images (T2WIs), and brain CEST imaging was performed with the application of the same imaging protocol as described for the phantoms except a larger FOV = 240 × 240 mm2, NSA = 4 and matrix size = 128 × 128. Original CEST images and GluCEST contrast maps were corrected for B0 and B1 inhomogeneities.
Result
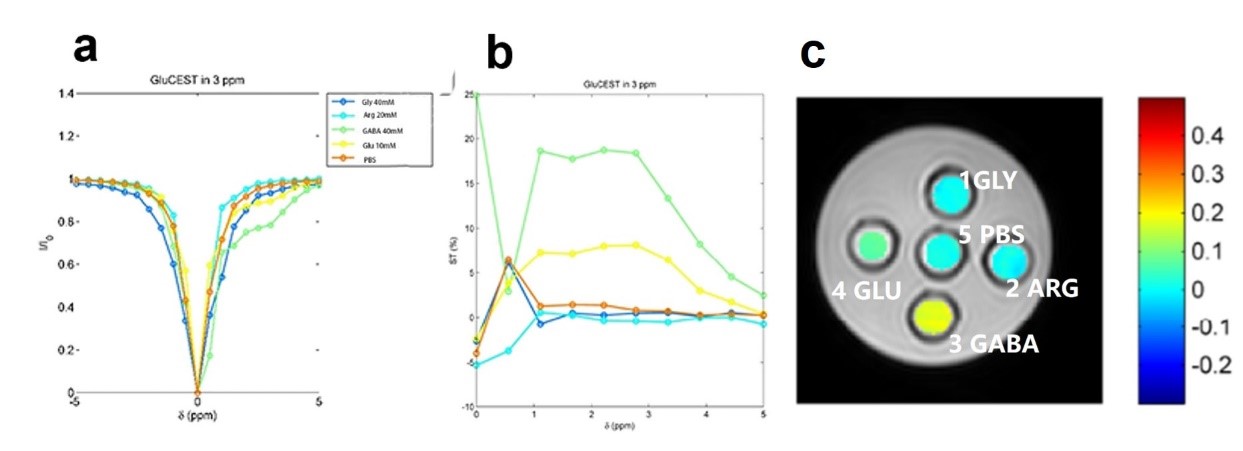
Phantom StudyFigure 1 presents the Z-spectra and CEST asymmetry of different substances, including Glycine (Gly), arginine (Arg), glutamate (Glu), gamma-aminobutyric acid (GABA) and PBS at 3.0 T. After investigating, it was found that the CEST properties of these solutions were collected using the following parameters: saturation energy = 6μT, saturation time = 3 s, and gradient mode is regular. Besides, the z-spectra of 10 mM Glu at pH 7 demonstrates that the CEST peak of Glu is sharper and centered around three parts per million (p.p.m.), and the z-spectral asymmetry plot shows that GluCEST value (GluCEST%) is about 8% at PH = 7.
Human Study
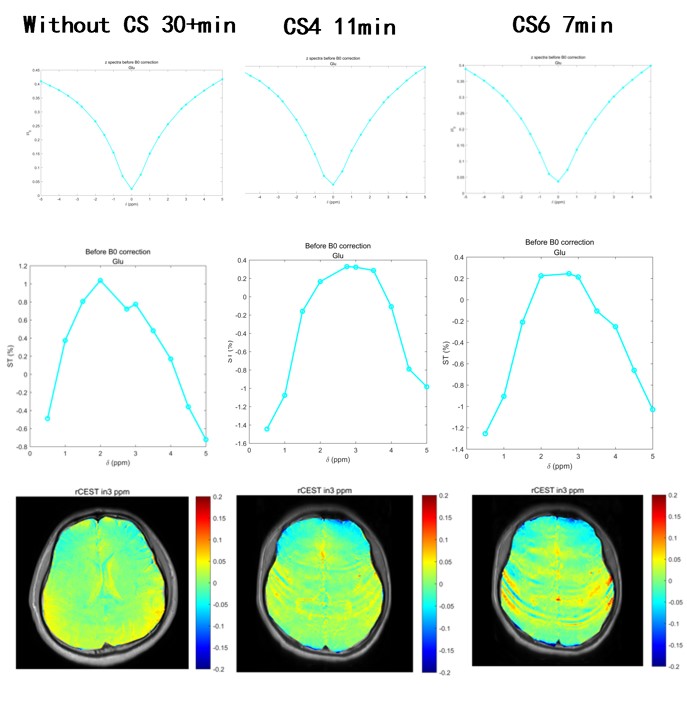
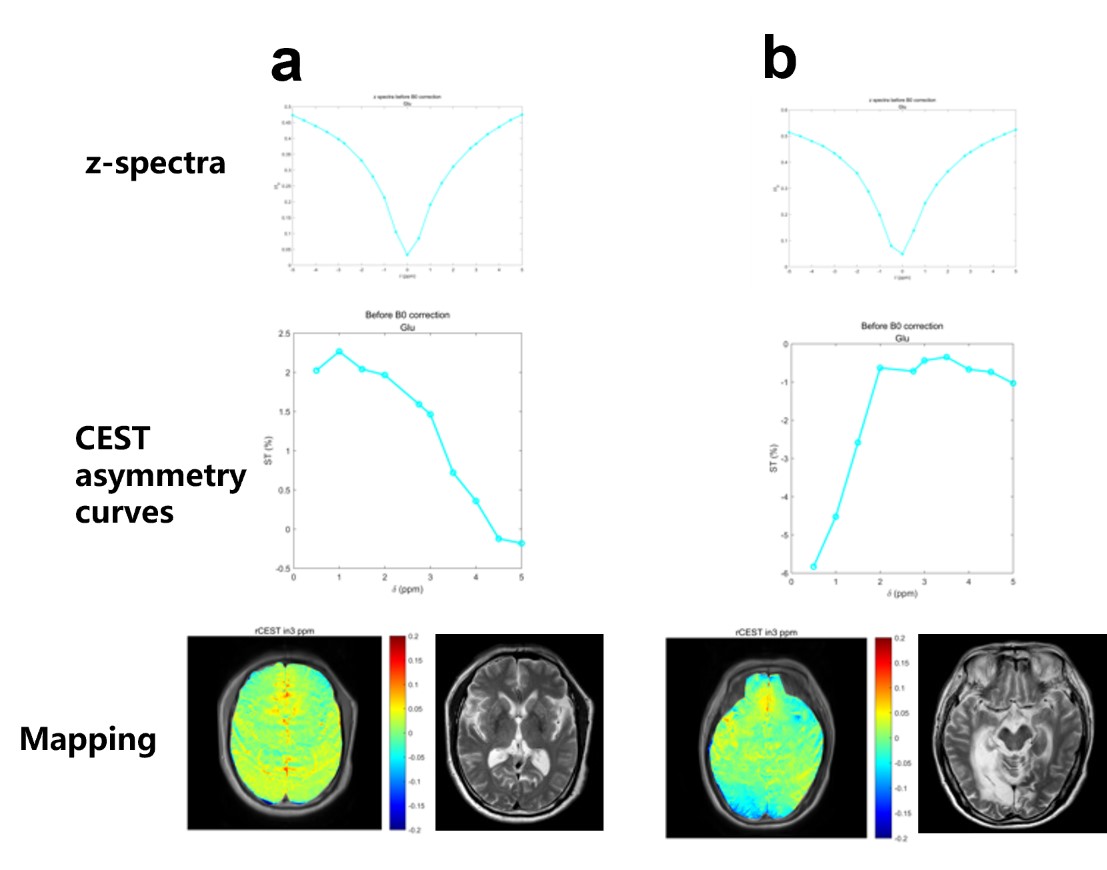
Recent studies have demonstrated that a combination of compressed sensing (CS) and parallel MRI techniques can enable highly accelerated CEST-MRI. To investigate the optimal parameters of CS at 3.0 T, four-fold and six-fold CS are used, and there is no significant difference between different CS-reconstructed MTRasym images at acceleration factors of 4 and 6 (Figure 2). Note that the acquisition time of GluCEST with 4-fold CS (11min) has fewer artifacts compared with GluCEST with 4-fold CS (11 min). Next, we evaluate the performance of GluCEST with 4-fold CS at 3.0 T. Interestingly, the z-spectra and CEST asymmetry curves from healthy human and stroke patients are heterogeneous, showing maximum CEST contrast at around 3 p.p.m, partially at around 2 p.p.m. The GluCEST map obtained from a healthy human brain shows a basically symmetrical image. On the contrary, the GluCEST from the region of stroke patients shows significant differences between the ipsilateral and contralateral side, revealing a decrease in GluCEST% in the infarction area. (Figure 3A, B).
Discussion and Conclusion
The feasibility of mapping the Glu signal from animal and human brains in vivo is demonstrated at 7.0 T6,7. However, the clinical uses of CEST MRI at 7T are rather restricted. In this work, we demonstrate that GluCEST with 4-fold CS yields less artfacts than 6-fold CS, and we verify that GluCEST detection in the human brain at 3.0 T is achievable. Similar to the previous study8 the highest GluCEST contrast in 3.0 ppm is paradoxically the consequence of the influence of other endogenous molecules, such as creatine. Altogether, the development of 3.0 T MRI technology provides a unique chance to detect intracerebral glutamate levels after a stroke in vivo. Consequently, we will have a better understanding of the temporal variations in glutamate levels after stroke.Acknowledgements
No acknowledgement found.References
1. Saini V, Guada L, Yavagal DR. Global Epidemiology of Stroke and Access to Acute Ischemic Stroke Interventions. Neurology. 2021 Nov 16;97(20 Suppl 2):S6-S16.
2. Petroff OA. GABA and glutamate in the human brain. Neuroscientist. 2002 Dec;8(6):562-73.
3. Harrison PJ. Metabotropic glutamate receptor agonists for schizophrenia. Br J Psychiatry. 2008 Feb;192(2):86-7.
4. Chojnacka-Wójcik E, Kłodzinska A, Pilc A. Glutamate receptor ligands as anxiolytics. Curr Opin Investig Drugs. 2001 Aug;2(8):1112-9.
5. Kogan F, Hariharan H, Reddy R. Chemical Exchange Saturation Transfer (CEST) Imaging: Description of Technique and Potential Clinical Applications. Curr Radiol Rep. 2013 Jun 1;1(2):102-114.
6. Cai K, Haris M, Singh A, Kogan F, Greenberg JH, Hariharan H, Detre JA, Reddy R. Magnetic resonance imaging of glutamate. Nat Med. 2012 Jan 22;18(2):302-6.
7. Zhou R, Bagga P, Nath K, Hariharan H, Mankoff DA, Reddy R. Glutamate-Weighted Chemical Exchange Saturation Transfer Magnetic Resonance Imaging Detects Glutaminase Inhibition in a Mouse Model of Triple-Negative Breast Cancer. Cancer Res. 2018 Oct 1;78(19):5521-5526.
8. Bagga P, Pickup S, Crescenzi R, Martinez D, Borthakur A, D'Aquilla K, Singh A, Verma G, Detre JA, Greenberg J, Hariharan H, Reddy R. In vivo GluCEST MRI: Reproducibility, background contribution and source of glutamate changes in the MPTP model of Parkinson's disease. Sci Rep. 2018 Feb 13;8(1):2883.
Figures