1943
Quantitative Assessment of Hyperperfusion using ASL to Predict Hemorrhagic Transformation in Acute Ischemic Stroke Patients1nanfang hospital, guangzhou, China, 2Philips Healthcare, guangzhou, China
Synopsis
Keywords: Stroke, Brain
Hemorrhagic transformation (HT) is a potentially life-threatening complication in acute ischemic stroke (AIS) patients. We developed a quantitative of hyperperfusion on ASL and to evaluate its value in the prediction of HT in AIS patients. Our results indicated that CBFmax in hyperperfusion detected on pretreatment ASL was associated with subsequent HT and higher CBFmax was more likely to experience parenchymal hematoma (PH) in AIS patients. The assessment of CBFmax in hyperperfusion on pretreatment ASL may be available in routine clinical practice to further predict subsequent HT and enable timely intervention to prevent PH.Introduction
Hemorrhagic transformation (HT) is a potentially life-threatening complication in acute ischemic stroke (AIS) patients treated with intravenous thrombolysis or endovascular intervention1, 2. A central mechanism suggested that the reperfusion of brain tissues, where prolonged and severe hypoperfusion disrupts the blood-brain barrier (BBB), is thought to be a major process underlying HT 3.Arterial spin labeling (ASL) has been recommended as a routine MRI method to evaluate cerebral blood flow (CBF) in stroke patients without radiation and contrast-agent administration, which benefits patients with impaired renal function or undergoing repetitive perfusion imaging 4.However, a reliable quantitative assessment of hyperperfusion based on ASL is not currently available.We hypothesized that hyperperfusion have higher CBF values in HT patients compared with those without subsequent HT. The aim of this study was to develop a technique for quantitative assessment of hyperperfusion on ASL and to investigate its values in the prediction of subsequent HT in AIS patients.Methods
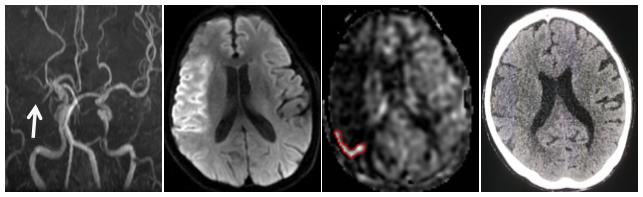
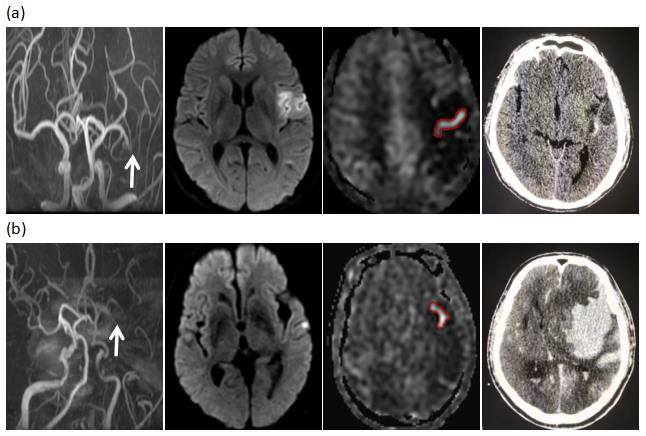
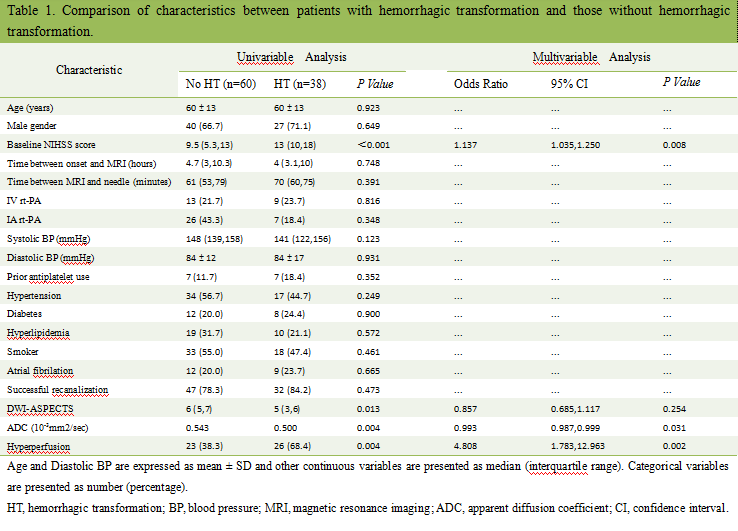
This retrospective study enrolled 98 AIS patients with anterior circulation large vessel occlusion within 24 hours of symptom onset before mechanical endovascular therapy. All patients underwent conventional MRI scanning including 3D TOF-MRA, DWI, FLAIR and ASL sequences. ASL images were obtained with a pseudo-continuous ASL pulse sequence with the following parameters: TR of 4521ms, TE of 9.8 ms, label time of 1500 ms, post label delay of 1525 ms, field-of-view of 240×240 mm2,slice thickness 4mm, scan time 3 min 10 s. Two neuroradiologists (J.B.H. and P.H.), who were aware that patients had AIS but blinded to the any clinical data, independently assessed the presence of hyperperfusion on ASL maps. Subsequently, a free-form ROI were hand drawn on ASL maps by 2 raters and mirror ROI were placed in the contralateral hemisphere followed by manual correction if necessary. The average CBF was acquired both in the hyperperfusion ROI and its mirror counterpart on the contralateral hemisphere. CBFmax was also acquired in the hyperperfusion ROI. A region with relative cerebral blood flow (CBF) ≥1.4 was defined as hyperperfusion. A noncontrast CT scan performed during the subacute phase after mechanical endovascular therapy for the evaluation of HT. The κ value was used to evaluate the interrater agreement of the presence of hyperperfusion and the intraclass correlation coefficient (ICC) was applied too evaluate the intrarater agreement. Univariate and multivariate analysis were used for determining the risk factors of HT. The Spearman’s rank correlation was used to evaluate relationship between CBFmax of hyperperfusion and grades of HT (from no HT to PH). ROC curve analyses were performed to evaluate the diagnostic performance.A two-sided p<0.05 was considered to indicate a statistical significance.Results
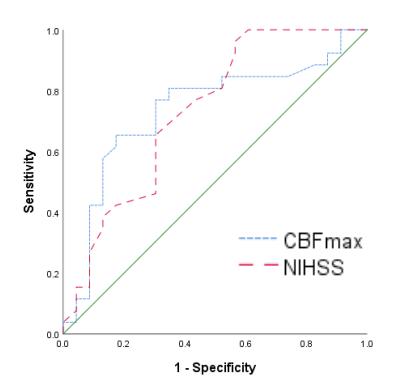
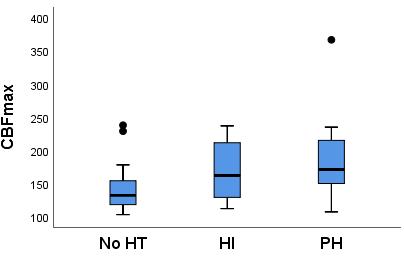
Hyperperfusion was detected in 49 patients. The κ value was 0.837 for assessing the presence of hyperperfusion between the 2 raters. The ICC of average CBFhyperperfusion and relative CBFhyperperfusion was 0.902 (95% CI, 0.834–0.944) and 0.950 (95%CI, 0.913–0.971), respectively. The CBFmax of hyperperfusion(odds ratio, 1.023; 95% CI,1.005-1.042; p = 0.012) were the independent risk factors for the status of HT after adjusting for baseline NIHSS scores. And the CBFmax of hyperperfusion for HT showed an AUC of 0.735 (95% CI, 0.588–0.882) with the optimal cutoff value, sensitivity and specificity were 146.5 ml/100g/min, 76.9% and 69.6% respectively. There was a significant relationship between grades of HT (from no HT to PH2) and CBFmax of hyperperfusion with the Spearman’s rank correlation of 0.446 (p=0.001).Discussion
Our results showed that hyperperfusion with subsequent HT had higher CBFmax values than those without subsequent HT. A CBFmax threshold of 146.5 ml/100g/min enabled differentiation of hyperperfusion patients with HT from those without subsequent HT. The underlying reason may be that hyperperfusion with HT had experienced more severe injured cortex and changes of BBB permeability, which can lead to the leakage of labeled spins from the arteries into the extracellular area. Thus, those hyperperfusion with subsequent HT had higher CBF than those without subsequent HT. Theoretically, CBFmax has the maximal potential to reflect the degree of injured cortex and BBB disruption compared with the average CBF. The high CBFmax of hyperperfusion may implicate that ischemic brain tissue experienced severe BBB disruption and more likely to develop HT. Besides, it is worth mentioning that there was a positive relationship between the grade of HT (from no HT to PH2) and CBFmax, indicating higher CBFmax was more likely to develop PH.Conclusions
Our results indicated that CBFmax in hyperperfusion detected on pretreatment ASL was associated with subsequent HT and higher CBFmax was more likely to experience PH in AIS patients. The assessment of CBFmax in hyperperfusion on pretreatment ASL may be available in routine clinical practice to further predict subsequent HT and enable timely intervention to prevent PH.Acknowledgements
The authors thank the Department of Medical Imaging Center, Nanfang Hospital for providing MR images and clinical histopathology reports of HCCs for this study.References
1. Fiorelli M, Bastianello S, von Kummer R et al (1999) Hemorrhagic transformation within 36 hours of a cerebral infarct: relationships with early clinical deterioration and 3-month outcome in the European Cooperative Acute Stroke Study I (ECASS I) cohort. Stroke 30:2280-22842.
2. Berger C, Fiorelli M, Steiner T et al (2001) Hemorrhagic transformation of ischemic brain tissue: asymptomatic or symptomatic? Stroke 32:1330-13353.
3. Álvarez-Sabín J, Maisterra O, Santamarina E, Kase CS (2013) Factors influencing haemorrhagic transformation in ischaemic stroke. Lancet Neurology 12:689-705.
4. Lu SS, Cao YZ, Su CQ et al (2020) Hyperperfusion on Arterial Spin Labeling MRI Predicts the 90-Day Functional Outcome After Mechanical Thrombectomy in Ischemic Stroke. Journal of Magnetic Resonance Imaging.
Figures