1939
Can combined High-resolution and 3D-Arterial spin labeling MR differentiate moyamoya disease from arteriosclerotic moyamoya syndrome?1The First Affiliated Hospital of Shandong First Medical University&Shandong Provincial Qianfoshan Hospital, Jinan, China, 2MR Research, GE Healthcare, Beijing , China., Beijing, China, 3Beijing Chaoyang Hospital, Capital Medical University, Beijing , China., Beijing, China
Synopsis
Keywords: Stroke, Multimodal
This study aimed to investigate whether the combined T1w-CUBE imaging and multiple post-labeling delay 3D pseudo-continuous arterial spin labeling imaging(MP 3D-PcASL)can distinguish moyamoya disease(MMD)from arteriosclerotic moyamoya syndrome(AS-MMS). 26 MMD patients and 25 AS-MMS patients were measured with T1w-CUBE imaging and MP 3D-PcASL. Significantly altered vessel wall in morphology and cerebral perfusion patterns were found on the lesions between AS-MMS and MMD. We thus concluded that the combined T1w-CUBE imaging and MP 3D-PcASL might help distinguish MMD from AS-MMS in clinic.Introduction
Moyamoya disease (MMD) and moyamoya syndrome (MMS) are both steno-occlusive processes of Willis circle with the formation of an abnormal vascular network composed of collateral pathways at the base of brain.1 Both MMD and AS-MMS affect vascular morphology and cerebral perfusion, and have different clinical treatments3. The diagnosis of both diseases remains challenging, as their luminal imaging and clinical symptoms shared features in common, especially in adult presentations.2 Therefore, it is essential to differentiate MMD from atherosclerotic MMS (AS-MMS) in clinic. 3D high-resolution isotropic fast-spin-echo (CUBE) imaging as a black blood technique enables visualization of vessel wall with high contrast4. This technique has been reported to be an effective method to evaluate intracranial artery diseases, including intracranial atherosclerosis and moyamoya disease4. Meanwhile, as a further developed technique from arterial-spin-labeling (ASL), MP 3D-PcASL provides temporal dynamics of cerebral perfusion corrected by arterial transit time (ATT),ATT-calibrated cerebral blood flow (CBF) overcomes the effect of prolonged transit time and accurately assesses the impaired perfusion area with abnormal blood flow velocity5. With MP 3D-PcASL, accurate detection of CBF has been obtained for adult moyamoya patients6. With these promising features, we assumed that both techniques have potential in the diagnosis of MMD and AS-MMS patients. Therefore, in this study, the main goal was to investigate the feasibility of combined T1w-CUBE imaging and MP 3D-PcASL in accurate differentiation between MMD and AS-MMS.Material and Methods
Subjects26 MMD patients (17 women,43.04±12.9 years)and 25 AS-MMS(8 women,51.7±10.3 years) patients were recruited in this study.
MRI experiment
All MR experiments were performed at 3.0 Tesla (MR750, GE Healthcare, USA) using a 32-channel head phased array coil. All patients underwent MRA, T1w-CUBE imaging and MP 3D-PcASL. (1)For Pre-contrast and post-contrast 3D high-resolution T1WI-CUBE imaging, the following scan parameters were used, including FOV = 200 mm×200 mm for covering the whole brain, matrix size = 288×288, TR = 600 msec, TE = 14.4 msec, slice thickness = 1 mm and slice gap = 0 mm. The number of scanning layers varied in a range of 312~360 based on the transverse diameter of the brain. Chemical shift fat suppression was also applied during image acquisition. (2) MP 3D-PCASL: three post-labeling delay times (PLD)s = 1000, 2000, 3000ms; TR/TE = 5981/10.54 msec; matrix = 128 × 128; slice thickness = 4 mm; FOV = 240 × 240 mm2; 8 arms with 512 sampling points per arm; NEX =1; perfusion labeling time=3000ms. The total scan time = 12minutes 54 seconds.
Data analysis
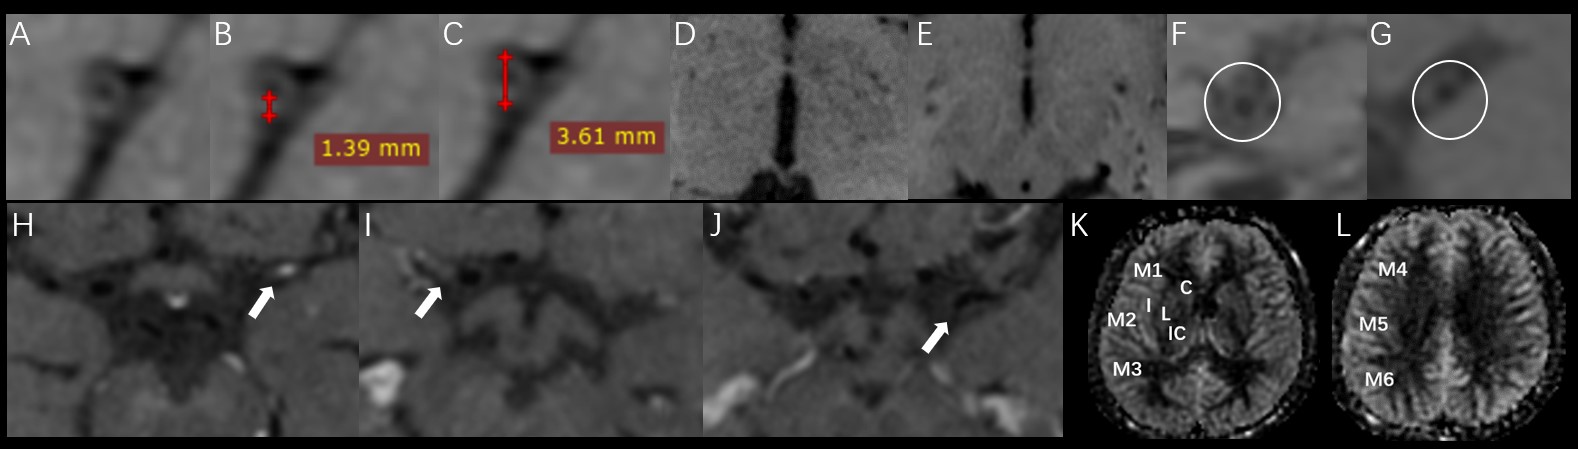
All MRI data were analyzed on a GE Advantage Workstation 4.6. Axial and coronal CUBE images were reconstructed from the acquired sagittal images. For MP 3D-PCASL imaging, the arterial transit time (ATT) and ATT corrected cerebral blood flow (CBF) were calculated based on a vendor-provided post-processing algorithm7. The morphologic parameters, including the outer diameter, maximum wall thickness, luminal stenosis morphology, the degree of wall enhancement, the number of collateral vessels from pre-contrast and post-contrast T1w-CUBE imaging, and the perfusion parameters, e.g., CBF and ATT from MP 3D-PCASL imaging were measured by two senior radiologists(Figure 1).
Statistical analysis
Using SPSS 26.0 software, two-sample t-test or the Manne Whitney U-test were used for continuous variables, and the χ2 test were used for categorical variables between the MMD and AS-MMS groups. After univariate analysis between the two groups, logistic regression models based on derived parameters separately from T1w-CUBE imaging and MP 3D-PCASL and the parameter combination were implemented respectively, and receiver operating characteristic (ROC) curves were generated to compare the discriminatory power of the different imaging methods for diagnosing MMD. The intra-class correlation coefficient (ICC) was used to assess the inter-observer agreement. P < 0.05 was considered statistical significance.
Results
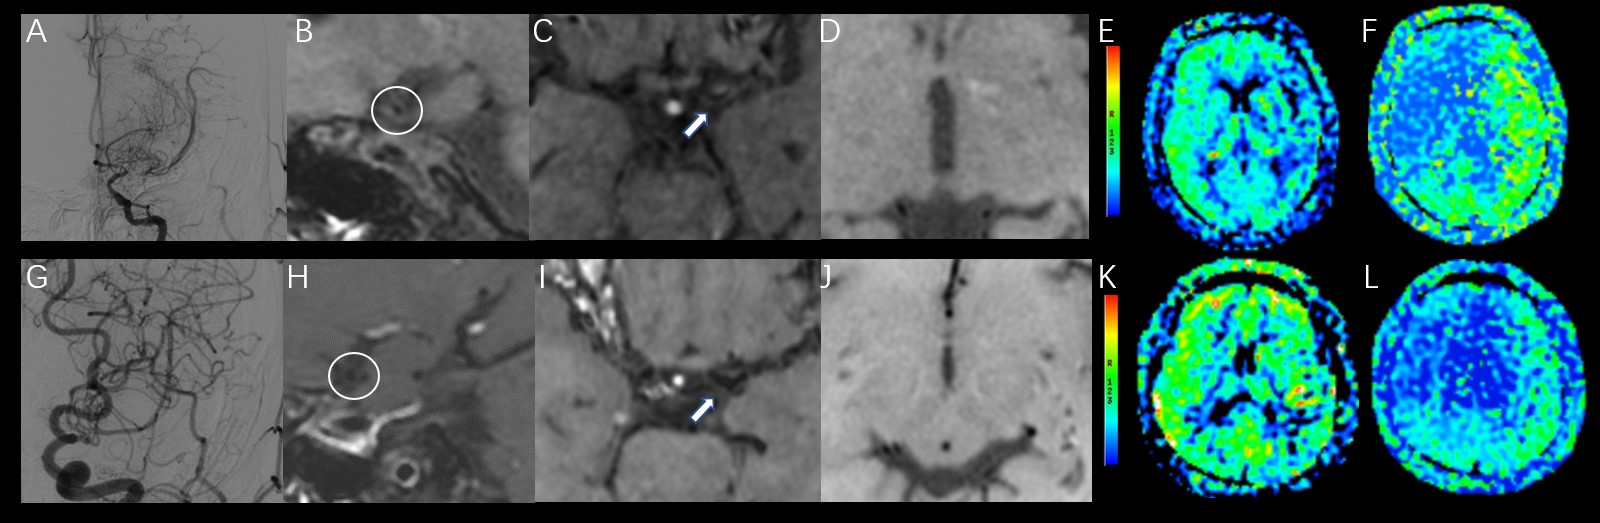
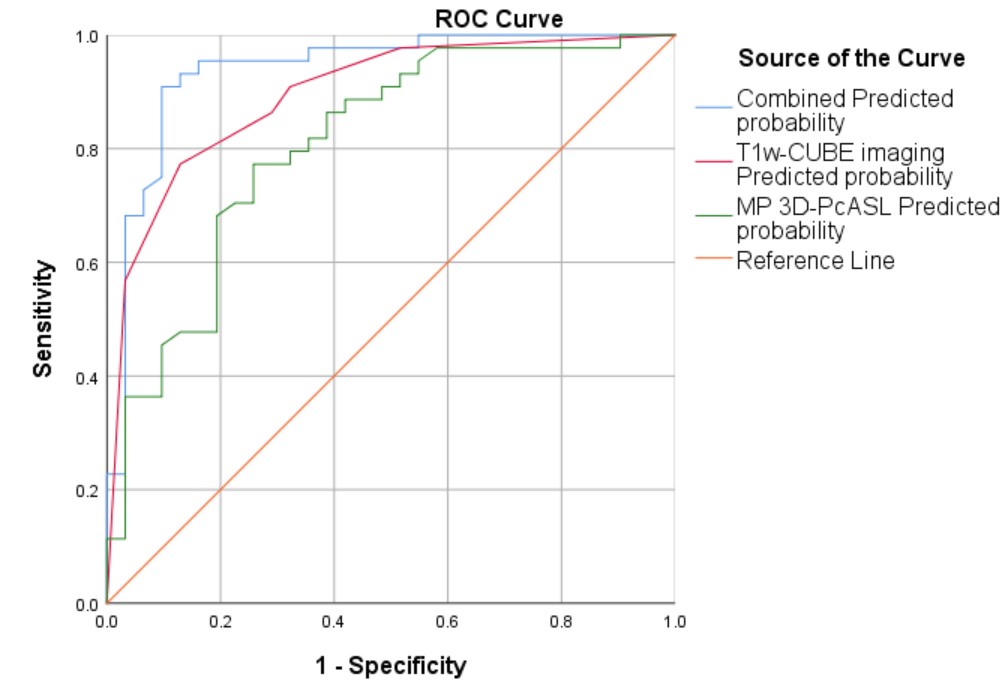
With T1w-CUBE imaging, MMD showed smaller outer diameters (2.76±0.39 VS 3.07±0.49mm) and maximum wall thickness (1.27±0.19 VS 1.49±0.24mm) than AS-MMS(both P<0.05). Meanwhile, using MP 3D-pcASL, the resultant CBF (36.64±14.28 VS 28.77±8.63 mL/100 g/min) was higher in MMD relative to AS-MMS, while an opposite pattern was shown for ATT (1.61±0.09 VS 1.72±0.13s; both p<0.05;Figure 2). Additionally, robust diagnostic efficacies for disease differentiation, confirmed with high AUCs (>0.808), were separately shown with T1W-CUBE and MP 3D-pcASL derived parameters. The combined multivariate logistic regression model however showed the optimal diagnostic efficacy (AUC: 0.938; P<0.05; Figure 3).Discussion and Conclusions
This study investigated whether the combined T1w-CUBE imaging and MP 3D-PcASL can distinguish MMD from AS-MMS. The results demonstrated that both the vascular morphological and perfusion features, derived from T1w-CUBE imaging and MP 3D-PCASL, are significantly different between MMD and AS-MMS. This may be related to different histopathological changes of vessel wall and different development of moyamoya-like vascular abnormalities between patients with MMD and AS-MMS. Importantly, our results demonstrated that the combined T1w-CUBE imaging and MP 3D-PcASL showed the optimal diagnostic efficacy.In conclusion, high-resolution T1w-CUBE combined with MP 3D-PcASL may help distinguish MMD and AS-MMS accurately.
Acknowledgements
We thank Weiqiang Dou from GE Healthcare for this valuable support on MP 3D-PcASL imaging.References
1. Research Committee on the P, Treatment of Spontaneous Occlusion of the Circle of W, Health Labour Sciences Research Grant for Research on Measures for Infractable D. Guidelines for diagnosis and treatment of moyamoya disease (spontaneous occlusion of the circle of Willis). Neurol Med Chir (Tokyo). 2012;52(5):245-266.
2. Yu LB, He H, Zhao JZ, et al. More Precise Imaging Analysis and Diagnosis of Moyamoya Disease and Moyamoya Syndrome Using High-Resolution Magnetic Resonance Imaging. World Neurosurg. 2016;96:252-260.
3. Powers WJ, Clarke WR, Grubb RL, Jr., et al. Extracranial-intracranial bypass surgery for stroke prevention in hemodynamic cerebral ischemia: the Carotid Occlusion Surgery Study randomized trial. JAMA. 2011;306(18):1983-1992.
4. Mandell DM, Mossa-Basha M, Qiao Y, et al. Intracranial Vessel Wall MRI: Principles and Expert Consensus Recommendations of the American Society of Neuroradiology. AJNR Am J Neuroradiol. 2017;38(2):218-229.
5. Yun TJ, Sohn CH, Yoo RE, et al. Transit time corrected arterial spin labeling technique aids to overcome delayed transit time effect. Neuroradiology. 2018;60(3):255-265.
6. Setta K, Matsuda T, Sasaki M, et al. Diagnostic Accuracy of Screening Arterial Spin-Labeling MRI Using Hadamard Encoding for the Detection of Reduced CBF in Adult Patients with Ischemic Moyamoya Disease. AJNR Am J Neuroradiol. 2021;42(8):1403-1409.
7. Dai
W, Robson PM, Shankaranarayanan A, Alsop DC. Reduced resolution transit delay
prescan for quantitative continuous arterial spin labeling perfusion imaging. Magn Reson Med. 2012;67(5):1252-1265.
Figures