1937
Intravoxel incoherent motion diffusion weighted imaging to assess brain microstructure and perfusion in patients with end-stage renal disease1Changzhou Second People’s Hospital, Changzhou, China, 2Changzhou University, Changzhou, China, 3GE Healthcare, MR Research China, Beijing, China
Synopsis
Keywords: Neurodegeneration, Diffusion/other diffusion imaging techniques
This study aimed to investigate the clinical value of intravoxel incoherent motion (IVIM) diffusion-weighted imaging in evaluating the brain microstructural and perfusion changes in end-stage renal disease (ESRD) patients. 40 ESRD patients and 30 healthy subjects were recruited in this study and underwent IVIM MRI. The microstructure and perfusion of the brain showed significantly differences in the left frontal lobe, bilateral temporal lobe, left hippocampus, right occipital lobe, represented by IVIM derived parameters of slow apparent diffusion coefficient (ADCslow) and fast apparent diffusion coefficient (ADCfast). Therefore, we concluded that the brain microstructure and perfusion were impaired in ESRD patients.Background or purpose
End-stage renal disease (ESRD) is a severe problem across the world.1 Cognitive impairment exists extensively in ESRD cases, including impaired executive function, memory, disorientation, and motor performance.1 Therefore, it is necessary to apply effective neuroimaging markers to help assess cognitive dysfunction at early stage and thus improve patients’ prognosis.Intravoxel incoherent motion (IVIM) diffusion-weighted imaging (DWI) can evaluate brain microstructure and perfusion simultaneously.2 The derived quantitative parameters, including the slow apparent diffusion coefficient (ADCslow), fast apparent diffusion coefficient (ADCfast), and perfusion fraction (f), enable measuring the effects of both diffusion and perfusion.3
The main goal of this study was to investigate whether IVIM DWI could measure the brain microstructure and perfusion changes in ESRD patients with cognitive impairment.
Methods
SubjectsFrom October 2020 to August 2021, 49 patients were initially enrolled in the study. A total of 40 patients(age ranging from 22 to 65 years)were finally included in this study. Moreover, 30 healthy controls (HCs) (age ranging from 25 to 63 years), who were well-matched in terms of sex, age, and education level, were also recruited in this study as the control group.
Memory assessment
The cognitive function of each patient was reviewed 30 minutes before MRI scanning using the Montreal Cognitive Assessment (MoCA), a commonly used clinical scale for effectively detecting cognitive impairment. Each MoCA test was limited to 10 minutes.
Laboratory examinations
Laboratory tests for hemoglobin, blood urea nitrogen, serum creatinine level and glomerular filtration rate (eGFR) were performed for all patients with ESRD within 24 hours prior to MRI measurement. No laboratory tests were performed for HCs.
MRI data acquisition
All subjects were scanned on a 3.0 T MR scanner (Discovery MR750W, GE Medical Systems, USA) with a 32-channel head and neck joint coil employed. All subjects first underwent conventional head T1-weighted image (T1WI), T2-weighted image (T2WI) and T2-fluid attenuated inversion recovery (T2-FLAIR). IVIM imaging was then applied with the scanning parameters of repetition time: 4000 ms, echo time: 90 ms, field of view: 24 cm × 24 cm, matrix: 128 × 128, slice thickness: 5 mm, b values: 0, 20, 50, 80, 100, 150, 200, 400, 800, 1000s/mm2 respectively. In this study, the acquired IVIM imaging was based on a single-shot spin echo-planar-imaging DWI sequence. The diffusion gradients were applied in three directions of X, Y, and Z axes. The corresponding ADC at each direction was obtained, and the mean ADC over three directions was obtained and considered as the final one.
Data processing
IVIM data were post-processed with bi-exponential model embedded in a vendor-provided software on the advanced workstation (Advantage Workstation 4.6, GE Medical Systems, USA). The corresponding IVIM parameter maps, including ADCslow, ADCfast, and f value, were generated accordingly.
On T2WI images, all regions of interest (ROIs) in the central slice of bilateral frontal lobe, parietal lobe, temporal lobe, occipital lobe, hippocampus, and insular lobe were drawn manually by three radiologists independently, while avoiding the ventricle, cistern, and sulci to minimize the effect of the cerebrospinal fluid on ROIs.
Statistical analysis
All statistical analyses were performed using SPSS 25.0. (SPSS Inc., USA). The Shapiro–Wilk test was applied to determine the normal distribution of the measurement data. The independent sample t-test or the Mann–Whitney U test were applied to test the difference of each IVIM derived parameters between ESRD and control group. Pearson correlation analysis was applied to analyze the relationships of the change of ADCfast with neuropsychological and clinical characters. P< 0.05 was considered to indicate statistical significance.
Results
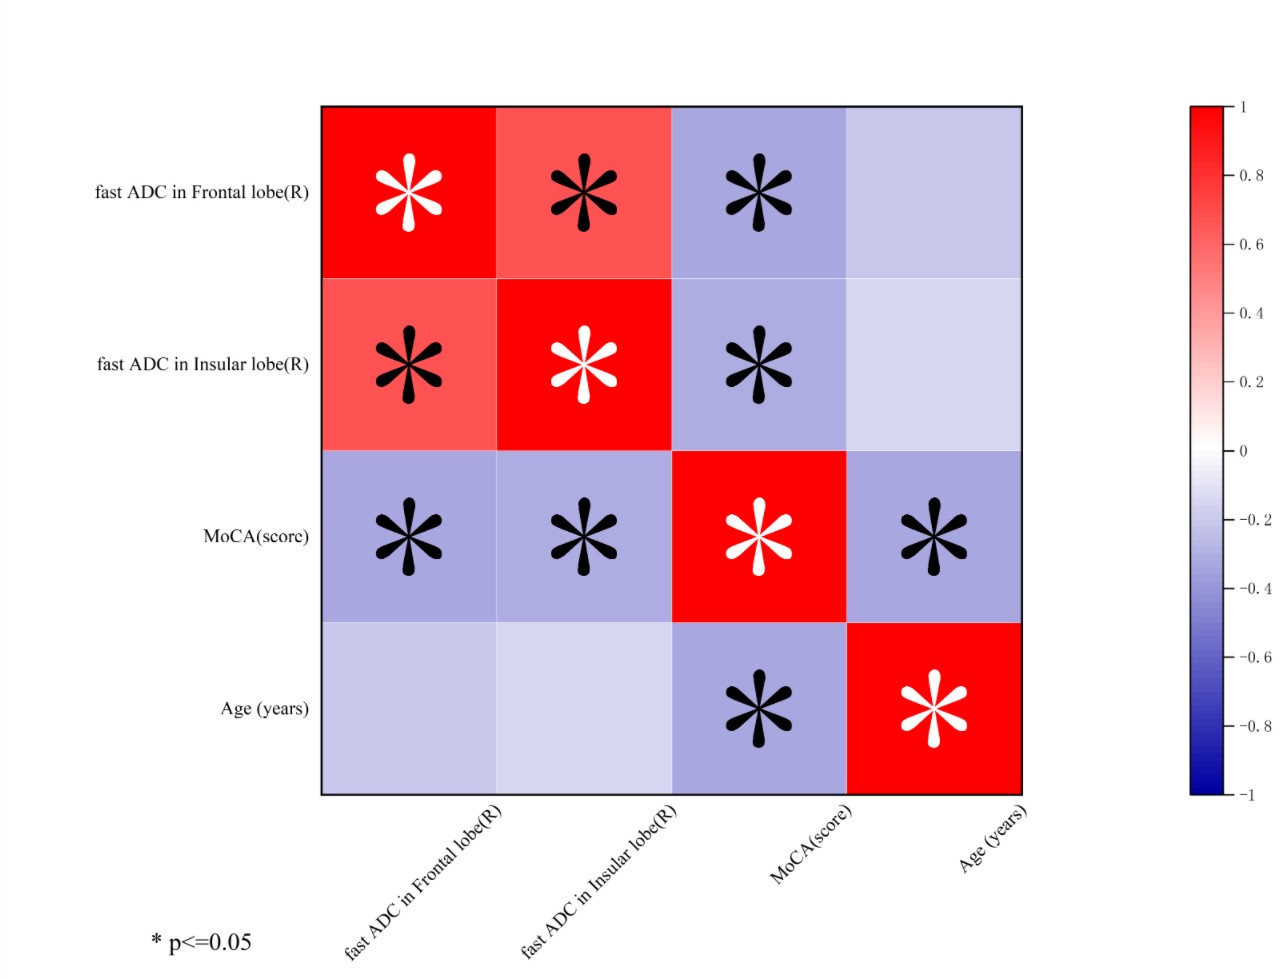
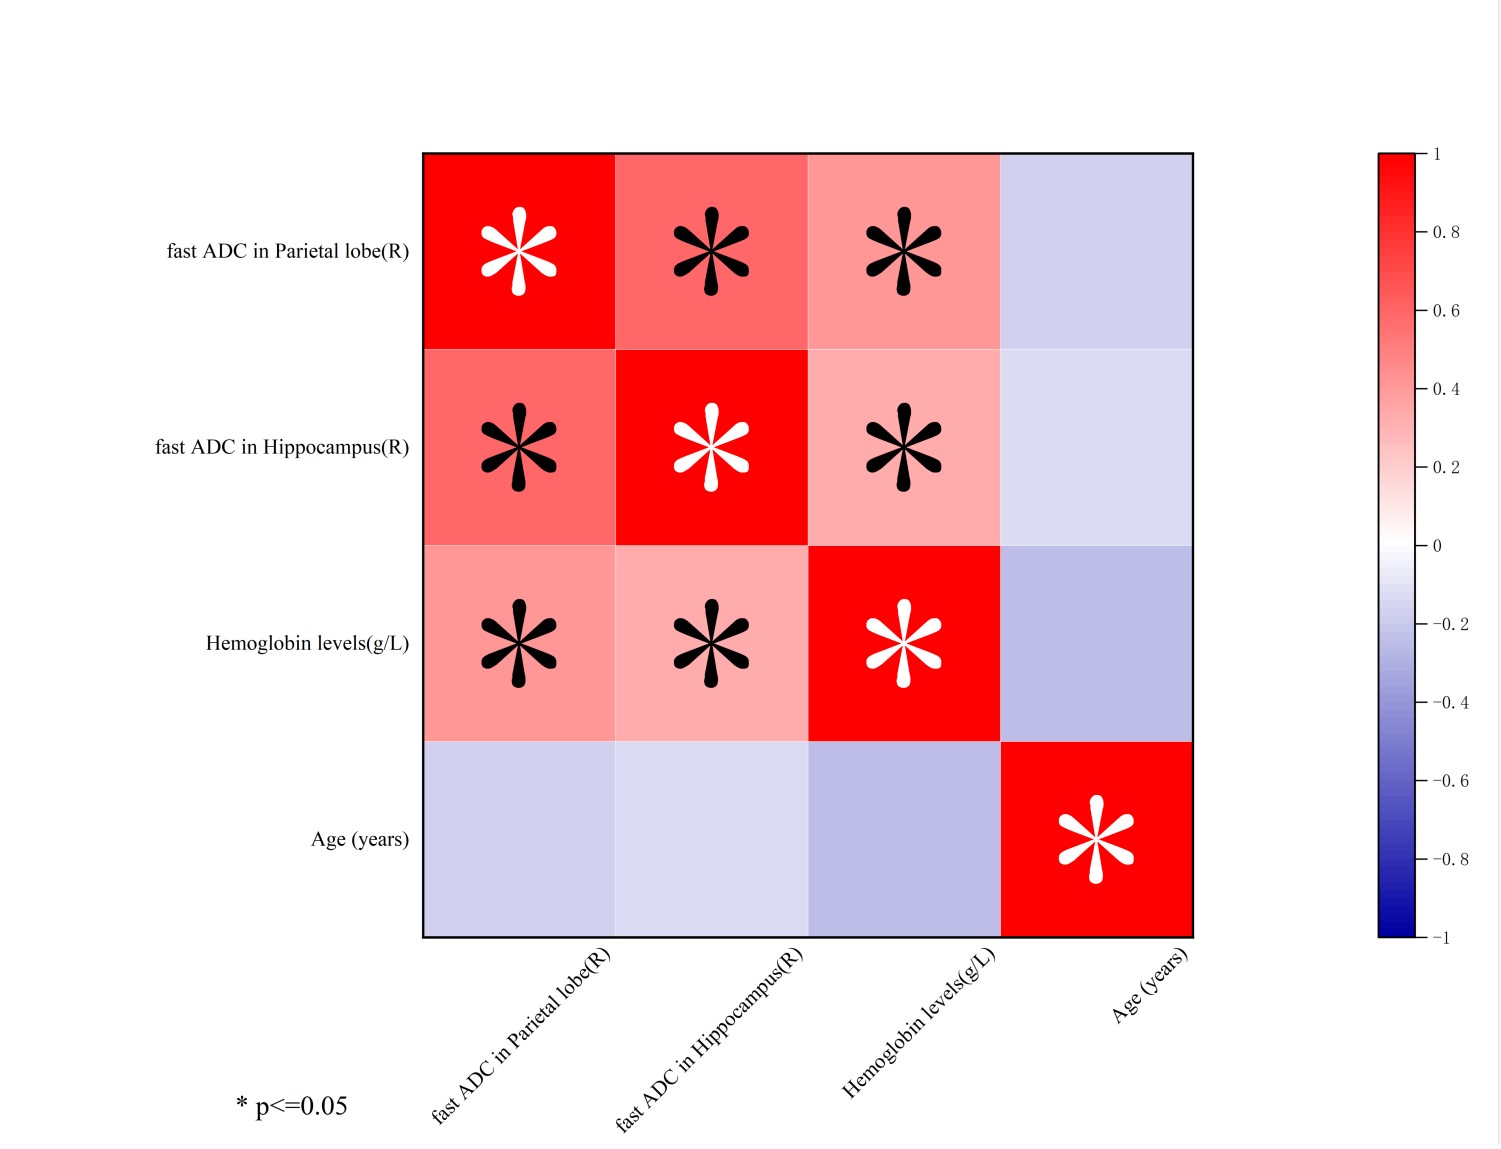
For ADCslow, the ESRD group showed significantly increased values in the left frontal lobe, bilateral temporal lobe, left hippocampus, right occipital lobe compared to the control group (all P< 0.05, Table 1) and significantly increased ADCfast was observed in all regions of the ESRD patients (all P< 0.001, Table 2).With Pearson correlation analysis, a negative correlation was found between the MoCA scores and ADCfast in the right frontal lobe (r = −0.324, P = 0.041) and the insular lobe of patients (r = −0.319, P = 0.045). (Fig 1). ADCfast in the right parietal lobe (r = 0.408, P = 0.009) and the right hippocampus (r = 0.324, P = 0.041) of patients were positively correlated with hemoglobin levels. (Fig 2).
Conclusions
In this study, we mainly investigated the clinical value of IVIM DWI in evaluating the brain microstructure and perfusion changes of ESRD patients. The ESRD group showed significantly increased ADCslow and ADCfast in the left frontal lobe, bilateral temporal lobe, left hippocampus, right occipital lobe. This finding indicated that the brain microstructure and perfusion of the brain were impaired in ESRD patients. Meanwhile, ADCfast was revealed negative correlation with MoCA scores and ADCfast in the right frontal lobe and the insular lobe of patients, and positive correlations with hemoglobin levels in the right parietal lobe and the hippocampus, indicating that the alteration of brain perfusion is associated with ESRD patients with cognitive impairment.In conclusion, our study demonstrated that the microstructure and perfusion of left frontal lobe, bilateral temporal lobe, left hippocampus, right occipital lobe were altered in ESRD patients.
Acknowledgements
We are grateful for
the assistance of Dr. Qing Sun in analyzing the clinical data and LetPub in
editing English language.
References
1. Ma S, Zhang M, Liu Y, et al. Abnormal rich club organization in end-stage renal disease patients before dialysis initiation and undergoing maintenance hemodialysis. BMC Nephrol 2020;21:515.
2. Mesropyan N, Murtz P, Sprinkart AM, et al. Comparison of different ROI analysis methods for liver lesion characterization with simplified intravoxel incoherent motion (IVIM). Sci Rep 2021;11:22752.
3. Le Bihan D. What can we see with IVIM MRI? Neuroimage 2019;187:56-67.
Figures
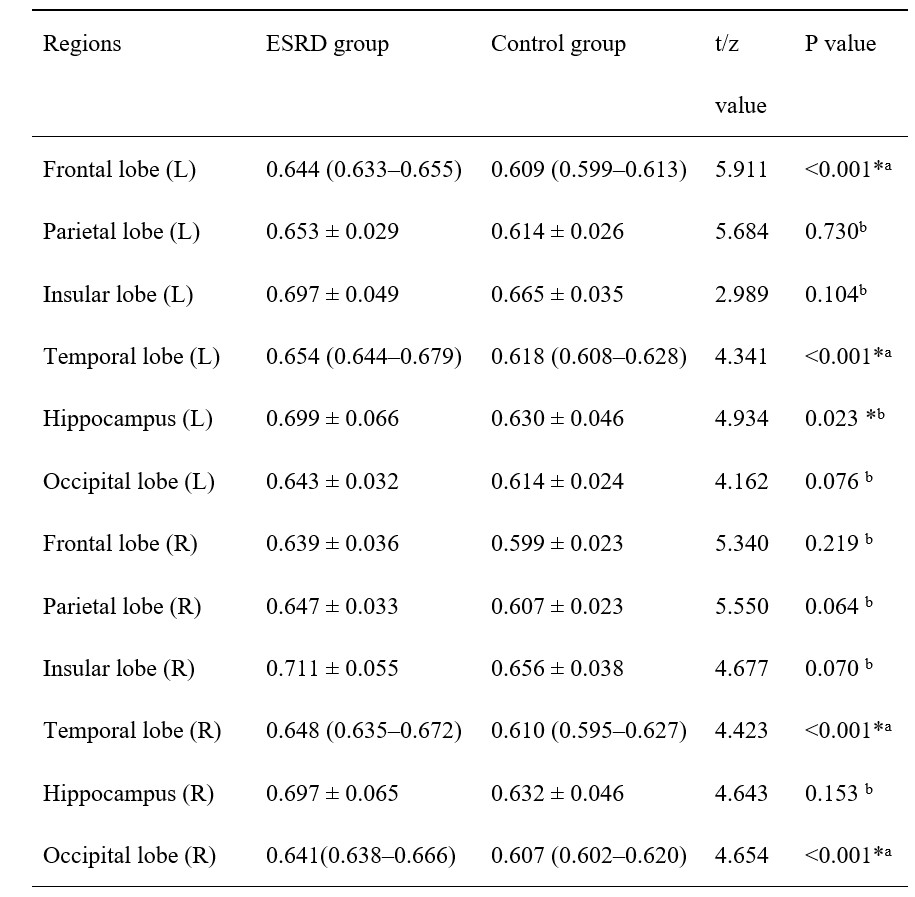
Table 1. Slow apparent diffusion coefficient (ADCslow) of the participants.
a Mann–Whitney U test; b independent sample t-test; L: left; R: right. ESRD: end-stage renal disease. The unit of ADCslow is 10−3 mm2/s. *P< 0.05 versus the control group.
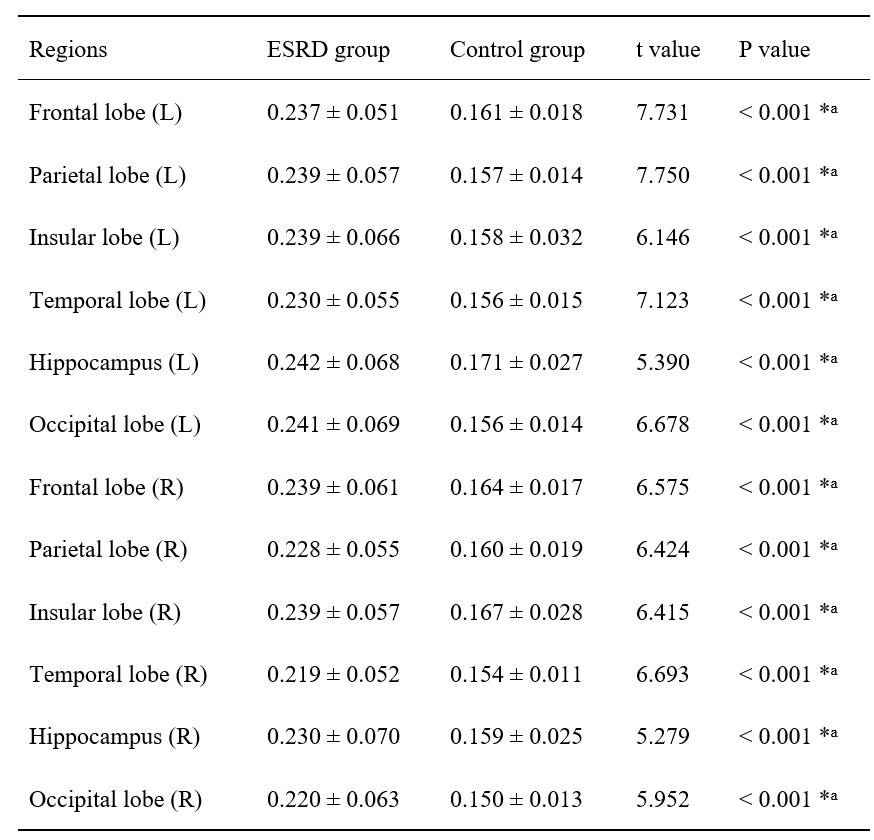
Table 2. Fast apparent diffusion coefficient (ADCfast) of the participants.
a independent sample t-test; L: left; R: right. ESRD: end-stage renal disease.The unit of ADCfast is 10−2 mm2/s.*P< 0.05 versus control group.