1935
Cerebrovascular reactivity is associated with longitudinal white matter hyperintensity progression in small vessel disease on 7T MRI1Radiology, UMC Utrecht, Utrecht, Netherlands, 2Neurology, UMC Utrecht, Utrecht, Netherlands
Synopsis
Keywords: Neurodegeneration, White Matter, small vessel disease, white matter hyperintensities
We studied the association between cerebrovascular reactivity measured with blood oxygenation level-dependent (BOLD-CVR) to hypercapnia and progression of white matter hyperintensities (WMH) on 7T MRI in cerebral small vessel disease (SVD). BOLD-CVR was assessed in voxels of four different categories which represent the fate of a voxel after two-year follow-up. The BOLD-CVR in normal appearing white matter (NAWM) that converted into WMH was significantly lower than the BOLD-CVR of voxels that remained WMH (0.39 [0.16-0.63] vs 0.98 [0.75-1.21]) (p<0.0001). The association between BOLD-CVR and WMH progression signifies the potential of BOLD-CVR to be a predictor of disease progression in SVD.Introduction
Cerebral small vessel disease (SVD) is a major cause of stroke and dementia1. The exact disease mechanisms leading to tissue damage in SVD are still unclear. It is believed that a loss of vascular smooth muscle cells could cause thickening of the vessel wall, leading to parenchymal damage2. Earlier, we found that we can measure small vessel function in SVD with 7T MRI3. Cross-sectional analyses showed that multiple aspects of small vessel function on 7T MRI were abnormal in sporadic SVD patients when compared to controls4,5. We found that the baseline voxel-wise cerebrovascular reactivity to hypercapnia measured with blood oxygenation level-dependent (BOLD-CVR) in normal appearing white matter (NAWM) was significantly higher than in white matter hyperintensities (WMH) in patients with sporadic SVD5. The cross-sectional association between BOLD-CVR and WMH has been studied before, however these studies mostly incorporated 1.5T or 3T MRI, assessed WMH as a volume, or did not incorporate sporadic SVD patients6-9.In order to find the relation between small vessel function on 7T MRI and disease progression in sporadic SVD, we assessed the longitudinal association between baseline BOLD-CVR on 7T MRI and WMH progression in sporadic SVD patients over two-years. Here we present the first results of the association between BOLD-CVR on 7T MRI and longitudinal WMH progression in sporadic SVD.
Methods
All participants were part of the ZOOM@SVDs study10, a prospective observational cohort study. Participants (>18 years) with a history of a clinical lacunar stroke in the last 5 years or were cognitively impaired with confluent WMH on MRI (Fazekas>2) were included to the sporadic SVD group. A 3T MRI and 7T MRI at baseline and a 3T MRI after two-year follow-up were performed. 7T MRI scans were acquired on a Philips scanner with a 32-channel head coil and were used to assess small vessel function measures, including whole-brain BOLD-CVR to a 6% hypercapnic CO2 stimulus (Figure 1). 3T MRI scans were acquired with a Philips Achieva (Philips Healthcare, Best, The Netherlands) MRI with a 8-channel SENSE head coil and were used to assess WMH.White matter was segmented on 3T T1 scans using the FMRIB’s Automated Segmentation Tool (FAST)11. WMH were segmented as described previously12 on 3T T1 and fluid-attenuated inversion recovery scans and manually corrected if necessary. Follow-up WMH masks were registered to baseline 3T T1 using non-linear deformation with the Advanced Normalisation Tools (ANTs) software13. Progression from NAWM to WMH was assessed with regions of interest (ROIs) that were created by overlapping baseline and follow-up NAWM and WMH masks. The ROIs included were the areas where NAWM or WMH remained the same after two years (NAWMtoNAWM and WMHtoWMH), and areas that progressed from NAWM to WMH as shown in Figure 2.
The BOLD% signal change was taken as outcome measure for every voxel and grouped according to which ROI they belonged to. The three ROIs were compared with each other using a linear mixed model with random intercepts. ROI type was chosen as fixed effect and subject was chosen as random effect. Age, gender, and end-tidal expired CO2 were included as covariates. Post-hoc Bonferroni tests for multiple comparisons was performed to statistically compare the BOLD% signal change per ROI.
Results
Twenty-six participants with SVD were included. Characteristics of the included participants are shown in Table 1. There was a significant increase in WMH volume after two years (p<0.001). A total of 477894 voxels of the twenty-six participants were included, of which 92% were NAWMtoNAWM, 2% were NAWMtoWMH, 6% were WMHtoWMH. Mean BOLD% signal change per ROI is shown in Table 2. NAWMtoWMH voxels had a significantly lower mean baseline BOLD% signal change than NAWMtoNAWM voxels (0.39 [0.16-0.63] vs 0.98 [0.75-1.21]) (p<0.0001).Discussion
In sporadic SVD, NAWM voxels progressing to WMH after two years had a significantly lower BOLD% signal compared to NAWM voxels that remained unchanged. This indicated an association between BOLD% signal and WMH progression on a voxel-wise level. To our knowledge, no previous study has investigated the relationship between BOLD-CVR and WMH progression in sporadic SVD before. Previous studies did show an longitudinal association between BOLD-CVR and WMH progression in different SVD patients14, or elderly with moderate-severe WMH without cognitive impairment15.An important strength of this study is the usage of 7T MRI, which allowed for directly investigating SVD at the core of the disease, the small vessels themselves. On 7T MRI, BOLD signals of the small vessels can be better distinguished from the larger draining veins than on lower field strengths, which allowed for measuring BOLD-CVR on a voxel-based level3. The longitudinal design of this study enabled us to associate small vessel function measures on 7T MRI for the first time with disease progression in sporadic SVD. We signified the potential for BOLD-CVR to be a signature of longitudinal progression of white matter damage in sporadic SVD on a voxel-wise level and could therefore have potential to be used as predictor of disease progression in SVD.
Conclusion
Voxel-wise BOLD-CVR on 7T MRI is associated with longitudinal WMH progression in sporadic SVD patients. These findings indicate the potential of BOLD-CVR as a predictor of white matter damage in sporadic SVD.Acknowledgements
We want to thank all study participants for participating in the ZOOM@SVDs study. Furthermore, we want to thank all partners of the SVDs@target collaborative program for their efforts in the field of SVDs. ZOOM@SVDs is part of SVDs@target that has received funding from the European Union’s Horizon 2020 research and innovative program under grant agreement No. 666881. JCWS and SDTP are funded by the UMCU Brain Center Young Talent Fellowship 2019.References
1 Wardlaw JM, Smith C, Dichgans M. Small vessel disease: mechanisms and clinical implications. Lancet Neurol 2019;18:684–696.
2 Wardlaw JM, Smith EE, Biessels GJ, et al. Neuroimaging standards for research into small vessel disease and its contribution to ageing and neurodegeneration. Lancet Neurol 2013;12:822–838.
3 Zwanenburg JJM, Van Osch MJP. Targeting cerebral small vessel disease with MRI. Stroke. 2017;48(11):3175-3182.
4 van den Brink H, Kopczak A, Arts T, et al. CADASIL Affects Multiple Aspects of Cerebral Small Vessel Function on 7T-MRI. Ann Neurol. 2022
5 van den Brink H, Pham SDT, Siero JCW, et al., Cerebral small vessel function with 7T-MRI in sporadic cerebral small vessel disease: the ZOOM@SVDs study. Manuscript in preparation
6 Hund-Georgiadis, M., Zysset, S., Naganawa, S et al. Determination of cerebrovascular reactivity by means of fMRI signal changes in cerebral microangiopathy: A correlation with morphological abnormalities. Cerebrovascular Diseases. 2013
7 Stringer, MS, Blair, GW, Shi et al. A Comparison of CVR Magnitude and Delay Assessed at 1.5 and 3T in Patients With Cerebral Small Vessel Disease. Frontiers in Physiology. 2019
8 Beaudin, AE, McCreary, CR, Mazerolle, EL et al. Cerebrovascular Reactivity Across the Entire Brain in Cerebral Amyloid Angiopathy. Neurology 2022
9 Blair, GW, Thrippleton, MJ, Shi, Y. et al. Intracranial hemodynamic relationships in patients with cerebral small vessel disease. Neurology 2020
10 van den Brink H, Kopczak A, Arts T, et al. Zooming in on cerebral small vessel function in small vessel diseases with 7T MRI: Rationale and design of the “ZOOM@SVDs” study. Cereb Circ - Cogn Behav. 2021;2:100013.
11 Zhang, Y. and Brady, M. and Smith, S. Segmentation of brain MR images through a hidden Markov random field model and the expectation-maximization algorithm. IEEE Trans Med Imag, 20(1):45-57, 2001.
12 Camarasa R., Doué C., de Bruijne M. et al. Segmentation of White Matter Hyper- intensities with an Ensemble of Multi-Dimensional Convolutional Gated Recurrent Units. 2018. https://wmh.isi.uu.nl/wp-content/uploads/2018/08/coroflo.pdf.
13 Avants BB, Epstein CL, Grossman M, Gee JC. Symmetric diffeomorphic image registration with cross-correlation: evaluating automated labeling of elderly and neurodegenerative brain. Med Image Anal. 2008 Feb;12(1):26-41.
14 Liem, MK, Lesnik Oberstein, SAJ, Haan, J et al. Cerebrovascular reactivity is a main determinant of white matter hyperintensity progression in CADASIL. American Journal of Neuroradiology. (2009)
15 Sam, K., Crawley, AP, Conklin, J. et al. Development of White Matter Hyperintensity Is Preceded by Reduced Cerebrovascular Reactivity. Annals of Neurology. (2016)
Figures
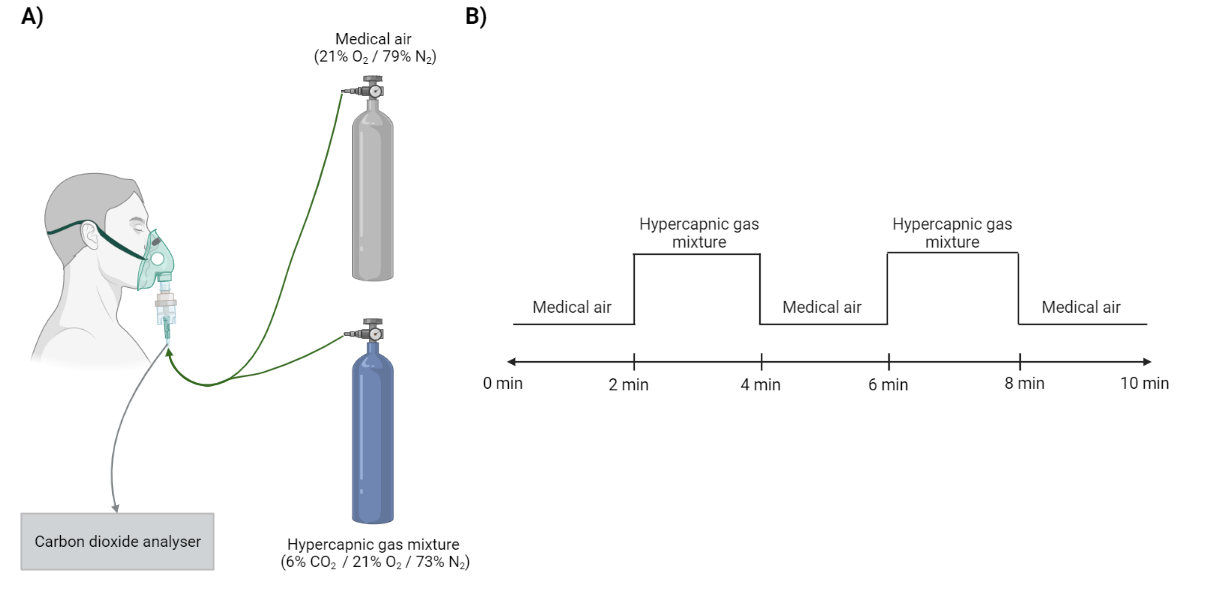
Figure 1
A) The participants received air through a face mask linked to a gas canister with either medical air or a hypercapnic gas mixture with 6% carbon dioxide (CO2). The amount of exhaled CO2 was measured with an analyser that was attached to the face mask. B) The ten-minute hypercapnic challenge involved medical air alternated by the hypercapnic gas mixture. The difference in blood oxygenation level-dependent signal between the two conditions was used to calculate the cerebrovascular reactivity.
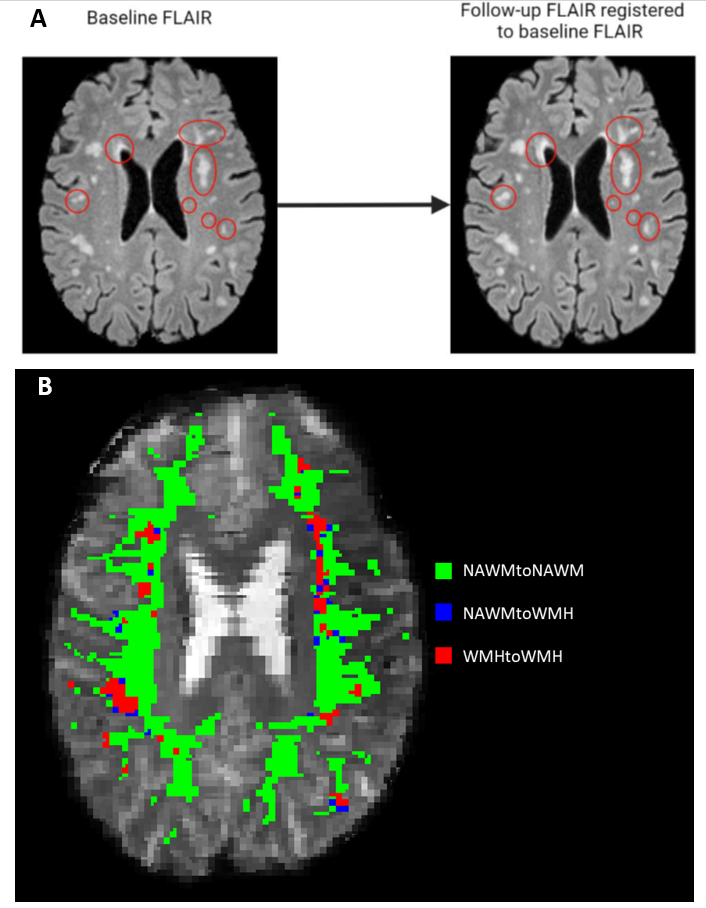
Figure 2
A) Follow-up FLAIR registered to baseline FLAIR to visualise white matter hyperintensity volume changes. The red circles indicate examples of areas in which white matter hyperintensity growth can be seen. B) The three regions of interest illustrated in a 7T blood oxygenation level-dependent scan. The different colors each indicate different regions of interest. FLAIR = fluid-attenuated inversion recovery; NAWM = normal-appearing white matter; WMH = white matter hyperintensities.
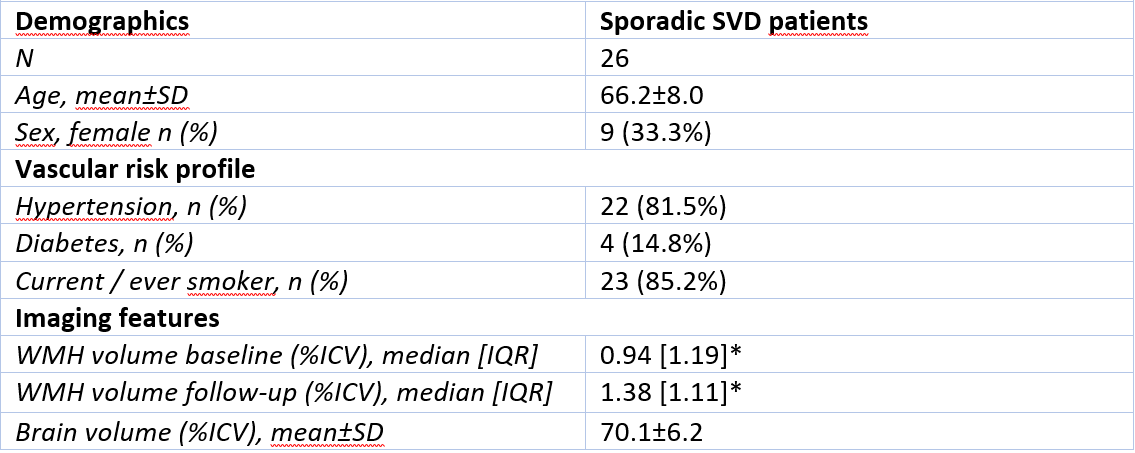
Table 1
Follow-up characteristics sporadic small vessel disease patients. ICV = intracranial volume; IQR = interquartile range; SD = standard deviation; SVD = small vessel disease; WMH = white matter hyperintensities.
* Significantly different with paired T-test; p < 0.001
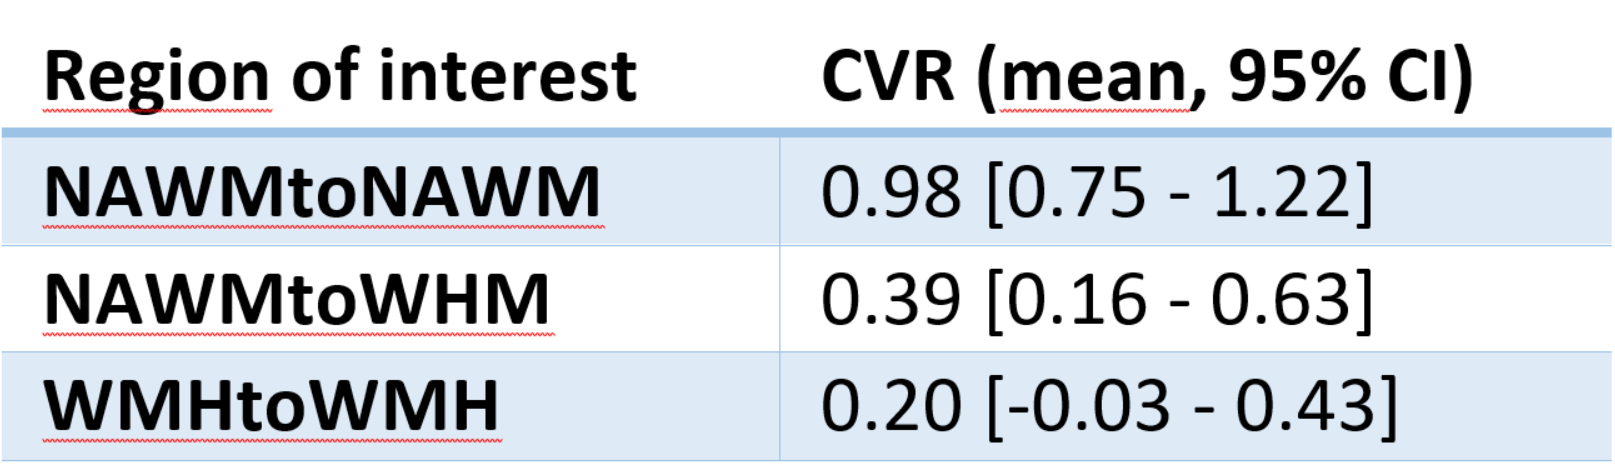
Table 2
Mean cerebrovascular reactivity of all voxels in different regions of interest in sporadic SVD patients. CI = confidence interval; CVR = cerebrovascular reactivity; NAWM = normal-appearing white matter; WMH = white matter hyperintensities.