1932
3D MRI Texture Analysis of the Brain in Obese Subjects with OSA: Analysis of Brain Injury and Relationship to Cognitive Impairments1Translational Medicine, The Hospital for Sick Children, Toronto, ON, Canada, 2Department of Medical Imaging, The University of Toronto, Toronto, ON, Canada
Synopsis
Keywords: Neurodegeneration, Brain
Up to 60% of obese youths with obstructive sleep apnea (OSA) are afflicted with episodes of nocturnal hypoxia, a known risk factor for structural cerebral alterations and neurocognitive problems leading to cognitive impairment. By applying grey-level co-occurrence-based texture analysis in children with and without OSA, we were able to show that the presence of OSA is associated with microscopic changes in normal appearing white matter in regions impacted by cognitive impairment. The findings support the lower tissue homogeneity, and decrease in cortical density and thickness seen in moderate-severe OSA groups.Introduction
Obstructive sleep apnea (OSA) is a respiratory illness prevalent in up to 60% of obese youths that causes a collapse in the breathing pathway during the sleep cycle leading to episodes of nocturnal hypoxia1,2. These episodes can progress into chronic systemic inflammation and endothelial dysfunction and have been shown to result in subtle brain injury and decreased tissue integrity in pediatric subjects3. Furthermore, OSA is known to be a risk factor for structural cerebral alterations and neurocognitive problems leading to cognitive impairment3,4. The brain abnormalities acquired due to OSA are not easily visible on conventional T2 structural MRI, however, by applying e.g. grey-level co-occurrence-based texture analysis (TA), a statistical image processing technique, we can assess normal appearing white matter regions to characterize subtle brain injury and assess whether these are related to cognitive impairment. The aim of this study is to characterize brain abnormalities on T2-weighted MRI using TA on specified regions of interest (ROIs) impacted by cognitive impairment in obese children with and without OSA.Methods
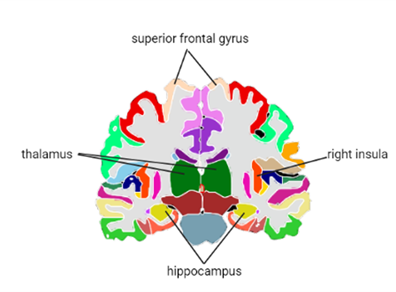
Data were acquired on a 3T MRI system (Siemens Magnetom Trio) as part of a larger cohort clinical study and retrospectively analyzed. T1-weighted MPRAGE anatomical images were acquired using a 32-channel head coil (TR/TE=2300/2.98 ms, FOV=256mm, voxel size=1×1×1mm, FA=9°). T2-weighted images were acquired using a FLAIR sequence (TR/TE = 9000/85 ms, FOV = 220mm, slices = 25, slice thickness = 4.5mm). All subjects underwent polysomnography to confirm the presence and severity of OSA, based on the Obstructive Apnea and Hypoxia Index (OAHI). Data from 14 obese subjects were used: 8 subjects with moderate-severe OSA and 6 subjects with no OSA. Prior to TA, brain extraction (BET, FSL) and co-registration (FLIRT, FSL) were performed. Using the T1 weighted anatomical images, ROI anatomical regions were selected (left precuneus, superior frontal gyrus, thalamus, right insula, amygdala, and hippocampus) in LIFEx (IMIV, CEA, France) with the aid of Neuromorphetrics Scalable Brain Atlas (seen in Figure 1) for each subject. 3D TA was then applied to the specified ROIs in T2-weighted data and texture feature extraction was executed to produce 157 first and second-order texture features per ROI (LIFEx). Attribute selection was then performed by WEKA machine learning software (University of Waikato, New Zealand) to select the top 10 features. The features were compared between the OSA and non-OSA groups using a Student's t-test, Benjamini-Hochberg corrected for multiple comparisons with an α level of 0.05 for each ROI.Results
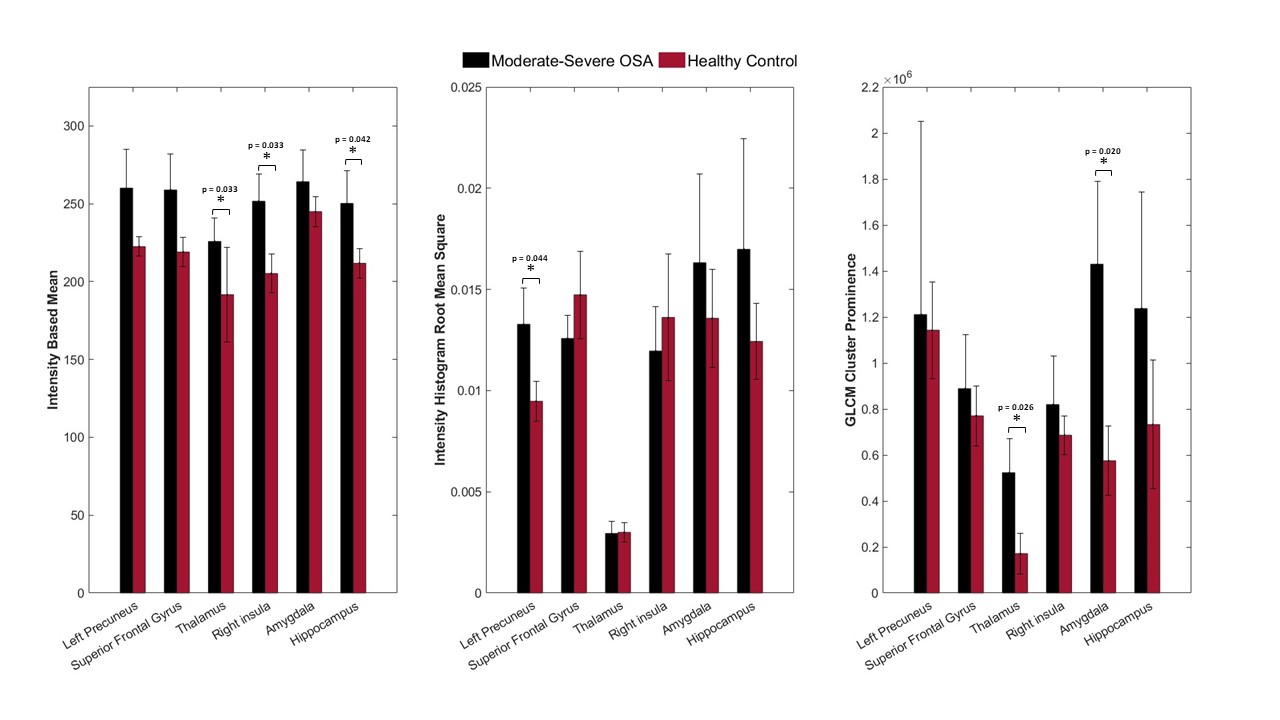
Three out of the ten texture features showed significant differences (p < 0.05) between the two groups. “Intensity Based Mean" was significantly higher in the mod-severe subjects in the thalamus, right insula, and hippocampus, “Intensity Histogram Root Mean Square” was significantly higher in the mod-severe subjects in the left precuneus, and "GLCM Cluster Prominence " was significantly higher in mod-severe subjects within the thalamus and amygdala, as seen in Figure 2.Conclusion
We investigated 3D MRI TA in regions of cognitive impairment in children with and without OSA, and how texture differences may be used to assess subtle brain injuries. Our results suggest that the significant features, identified by TA, that differ between OSA and non-OSA patients are related to cortical and sub-cortical structure abnormalities, which are more severe in the moderate-severe OSA cases5. Furthermore, this may also reflect lower tissue homogeneity and a decrease in cortical density and thickness6. This study provides insight into the application of MRI texture analysis in subjects in OSA. TA may serve as a measure of early structural changes in normal-appearing white matter in cortical and sub-cortical structures prior to visible hypoxic/ischemic damage. This may allow for a better understanding of how brain damage develops in subjects with OSA, and may be able to assist in more timely interventions. TA may offer a useful and cost-effective image processing tool without the requirement of advanced imaging techniques. Further research is required to fully understand the observed differences between the OSA and non-OSA groups.Acknowledgements
No acknowledgement found.References
[1] Atrick, P. et al., Current Concepts: Obstructive Sleep Apnea. 2, 1996, Vol. 334.
[2] Tauman, R. and Gozal, D. Obstructive sleep apnea syndrome in children. Expert Review of Respiratory Medicine. 2011. 10.1586/ers.11.7.
[3] Chan, K. C., et al., Neurocognitive dysfunction and grey matter density deficit in children with obstructive sleep apnoea. 2014, Sleep Medicine. 10.1016/j.sleep.2014.04.011.
[4] 4. Xanthopoulos, M. S. et al., Neurobehavioral Functioning in Adolescents With and Without Obesity and Obstructive Sleep Apnea. 2015, SLEEP. 10.5665/sleep.4498.
[5] Meo, S. et al., (2019). Effect of Obesity on Cognitive Function among School Adolescents: A Cross-Sectional Study. Obesity Facts,12(2), pp.150–156. doi:10.1159/000499386.
[6] Goldstone, A., Willoughby, A. R., de Zambotti, M., Franzen, P. L., Kwon, D., Pohl, K. M., ... & Baker, F. C. (2018). The mediating role of cortical thickness and gray matter volume on sleep slow-wave activity during adolescence. Brain Structure and Function, 223(2), 669-685.
Figures