1931
Age-related cell size and cellularity variation in deep gray matter in vivo1Shandong Provincial Hospital, Shandong University, Jinan, China, 2Philips Healthcare, Beijing, China, 3Shandong Provincial Hospital Affiliated to Shandong First Medical University, Jinan, China, 4Center for Nano & Micro Mechanics, Department of Engineering Mechanics, Tsinghua University, Beijing, China
Synopsis
Keywords: Neurodegeneration, Degenerative, aging
The aging progress of neuron is characterized by degenerative changes of structure and function. Few studies have focus on the structure in cellular level. In this study, we quantified cell size and cellularity in globus pallidus, putamen and substantia nigra pars compacta using time dependent diffusion imaging. Subgroup analysis by age showed the increased intracellular volume fraction of putamen in older people while diameter does not change over age. These findings might demonstrate the potential of MRI cell size imaging to assess the degeneration of neuron on cellular level.Introduction
Morphological neuron population aging occurs during almost the whole adult life1,2. There is evidence of a gradual decline in the volume of nuclei with age3. However, the cellular mechanisms underlying this decline are unknown. Since cell size and cellularity could be quantified non-invasively by temporal diffusion spectroscopy4–6, which makes it possible to explore aging degenerative changes in the microstructure of nuclei such as cell sizes and intracellular volume fractions rather than mere the whole nuclei in vivo. Substantia nigra pars compacta (SNpc), globus pallidus (Gp) and putamen (Pt) are associated with neurodegenerative diseases over age3, but cell-level changes are still unknown regarding how these changes manifest in MRI.The purpose of this study is to quantify cell size, intracellular volume fraction and cellularity in SNpc, Gp and Pt using time dependent diffusion imaging technique based on oscillating gradient spin echo (OGSE) with pulsed gradient spin echo (PGSE) sequences and explore microstructural changes of cell-level in young and older adult cohorts.
Methods
Forty-three healthy volunteers (23 older and 20 young adults ) were recruited from the local community. All participants were scanned on a clinical 3T MRI scanner (Ingenia CX, Best, the Netherlands) with a 32-channel phased-array head coil. The acquisition protocol began with a 3D T1-weighted turbo field echo (T1W-TFE) scan for planning, acquired by the imaging parameters as follows: FOV (field of view) = 240×240×160 mm3; flip angle = 8°; repetition time (TR)/echo time (TE) = 6.9/3.6 ms; matrix size = 240×240; slice thickness = 1 mm. For PGSE and OGSE, FOV= 220×220×63 mm3; repetition time (TR)/echo time (TE) = 1904/97ms (PGSE), 8022/109ms (N1), 8089/109ms (N2); matrix,112×107; section thickness=3 mm. Five b-values were used in PGSE and N1 for the first 20 participants (14 older and 6 young adults). The later 23 participants (9 older and 14 young adult) were scanned with a larger number of b-values. Diffusion sequence parameters especially the diffusion times were shown in Table 1. Images were set perpendicular to the base of the fourth ventricle. The superior limit of the scan coverage was defined in line with the superior body of the corpus callosum.We defined six ROIs including both sides of SNpc, Gp and Pt, and the ROIs were manually drawn on N2 images by experienced radiologists. To minimize partial volume effects, each ROI was traced on one axial slice in which the structure was the most prominent and its borders well defined. Mean cell size d, intracellular volume fraction vin, and extracellular diffusion coefficient Dex, cellularity were fitted using in-house developed software based on MATLAB using IMPULSED model7. The fitted parameters were compared between the two groups with multiple unpaired t-test (normally distributed data) in GraphPad Prism 9.3.1. FDR correction was applied for multiple comparisons.
Results
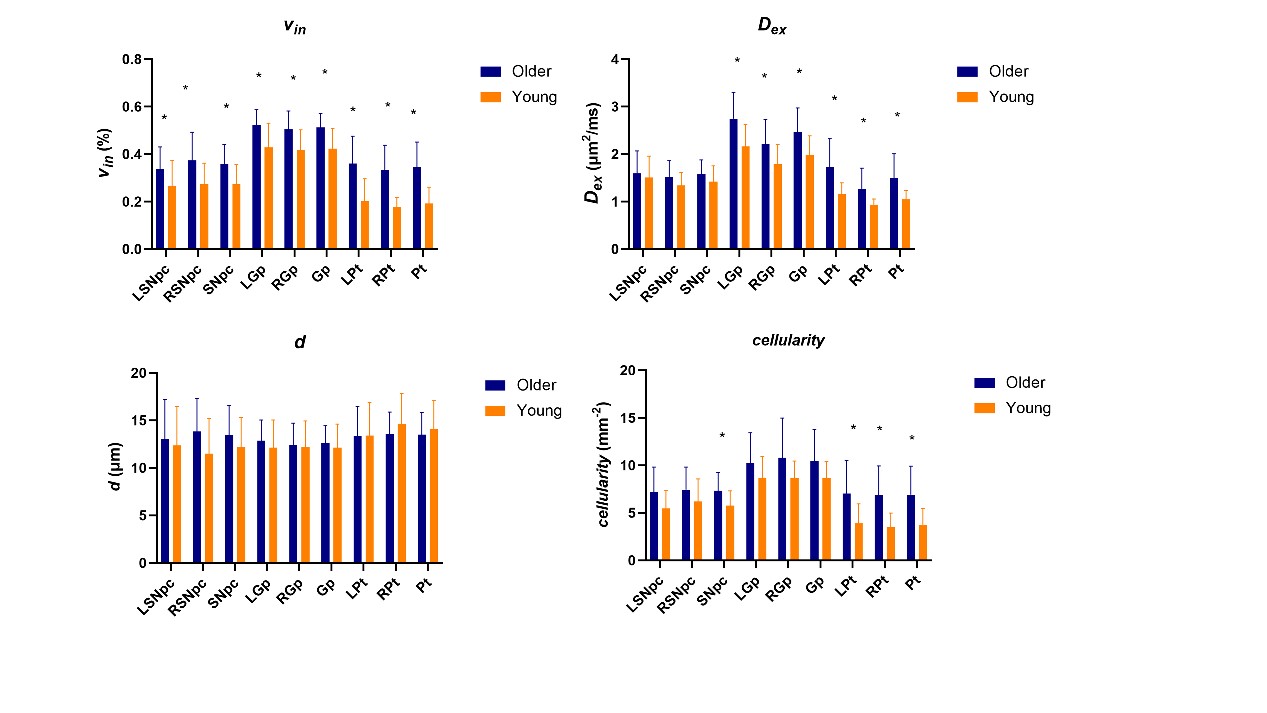
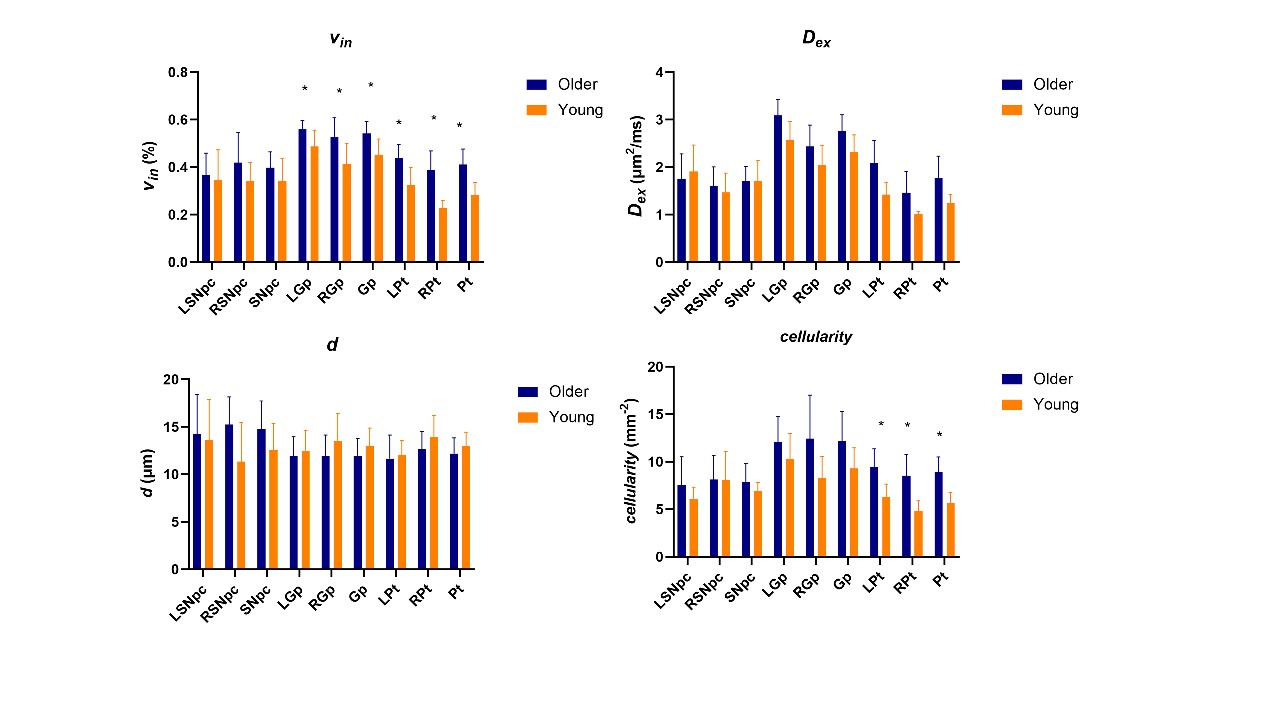
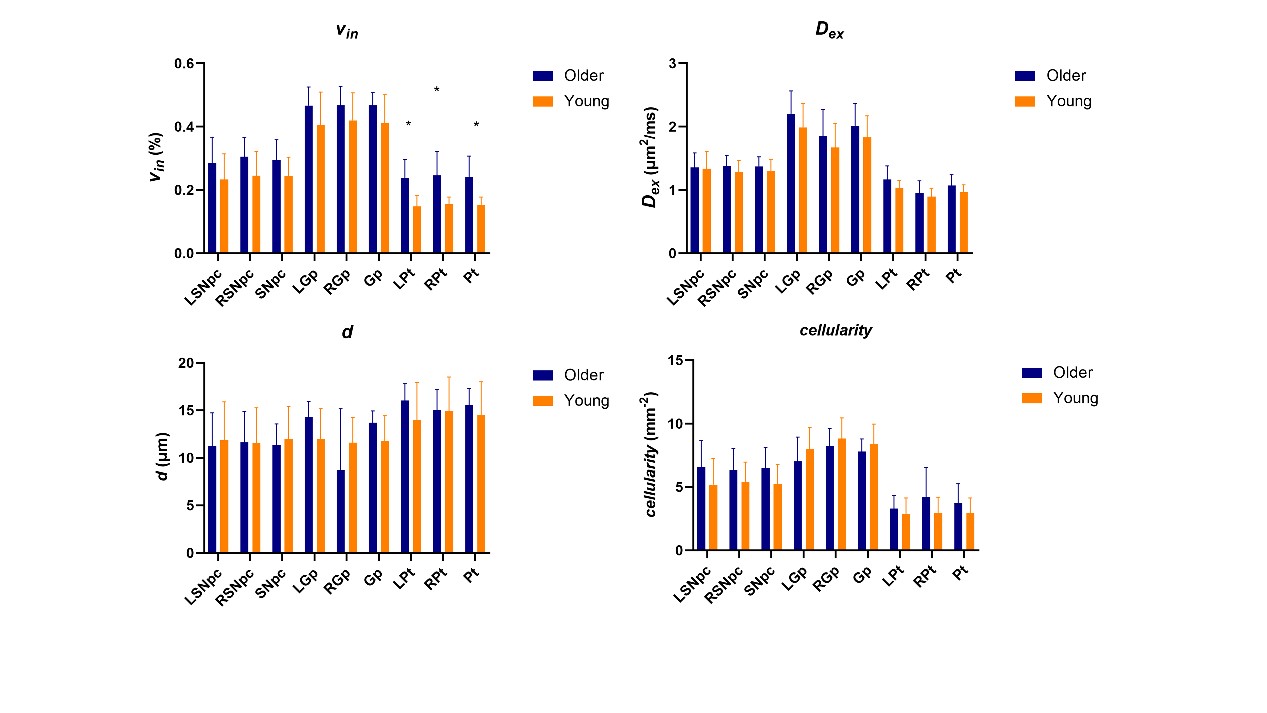
Among all participants, vin(%) of unilateral and bilateral SNpc (older: 0.358±0.082, young: 0.273±0.084, P=0.002), Gp (older: 0.513±0.059, young: 0.424±0.085, P<0.001;) and Pt (older: 0.345±0.106, young: 0.191±0.070, P<0.001) in older adult cohort than the young adult cohort. Dex of unilateral and bilateral Gp and Pt and cellularity of bilateral SNpc, unilateral and bilateral Pt were significantly higher in older (Figure 1). In the early 20 subjects, vin of unilateral and bilateral Gp(older: 0.542±0.050, young: 0.453±0.065, P=0.004;) and Pt (older: 0.412±0.065, young: 0.282±0.053, P<0.001) and cellularity of unilateral and bilateral Pt in older adult cohort than the young adult cohort (Figure 2). In the subsequent 23 subjects, vin of unilateral and bilateral Pt (older: 0.241±0.066, young: 0.153±0.025, P<0.001) were significantly higher in the elder group (Figure 3). Table 2 shows the means and standard deviations of the indices for elder and young adult cohorts.Discussion
In this study, we directly observe the difference in cell size and cellularity of SNpc, Gp and Pt between the older and young people at a cellular level in the in-vivo human brain which suggested morphological neuron population aging conforming to histologic findings2. The increased vin of Pt in older people is most prominent and consistent which might correspond to the increased cell volume4. However, d of Pt does not increase over age, it may indicate the increased vin is mainly contributed by the finite extracellular volume. The cellularity of Pt increases in older people while d does not differ, it may suggest the increased cellularity is mainly due to the increased intracellular volume instead of cell diameter. While the statistical findings of the current analysis among the three groups were inconsistent, there is still a visible tendency for increases in vin of SNpc, Gp and Pt in older people. Given the small sample sizes, we will continue to increase the sample size to further focus on the difference of cell size and cellularity of cerebral nuclei.Conclusion
Our study showed that the changes in cell sizes, intracellular volume fractions and cellularity of SNpc, Gp and Pt in young and older adult cohorts can be detected by MRI non-invasively, which may demonstrate the potential of MRI cell size imaging to assess the neurodegeneration of nerve cell on cellular level.Acknowledgements
The authors gratefully thank all the volunteers for their participation and support in the study. This work was supported in part by the Natural Science Foundation of Shandong (grant number: ZR2020QH267) and the Taishan Scholars Project (grant number: tsqn201812147).References
1. Magnaeva AS, Gulevskaya TS, Anufriev PL, Baranich T, Sukhorukov VS. Morphological characteristics of the brain nervous tissue during aging. Arkhiv patologii. 2022 Jan;84:20.
2. Schmitt O, Eggers R, Haug H. Quantitative investigations into the histostructural nature of the human putamen. Annals of Anatomy - Anatomischer Anzeiger. 1995 May;177(3):243–50.
3. Király A, Szabó N, Tóth E, Csete G, Faragó P, Kocsis K, et al. Male brain ages faster: the age and gender dependence of subcortical volumes. Brain Imaging and Behavior. 2016 Sep;10(3):901–10.
4. Xu J, Jiang X, Li H, Arlinghaus LR, McKinley ET, Devan SP, et al. Magnetic resonance imaging of mean cell size in human breast tumors. Magn Reson Med. 2020 Jun;83(6):2002–14.
5. Devan SP, Jiang X, Luo G, Xie J, Quirk JD, Engelbach JA, et al. Selective Cell Size MRI Differentiates Brain Tumors from Radiation Necrosis. Cancer Research. 2022 Oct 4;82(19):3603–13.
6. Xu J. Probing neural tissues at small scales: Recent progress of oscillating gradient spin echo (OGSE) neuroimaging in humans. Journal of Neuroscience Methods. 2021 Feb;349:109024.
7. Jiang X, Li H, Xie J, McKinley ET, Zhao P, Gore JC, et al. In vivo imaging of cancer cell size and cellularity using temporal diffusion spectroscopy: Cancer Cell Size and Cellularity Using IMPULSED. Magn Reson Med. 2017 Jul;78(1):156–64.
Figures
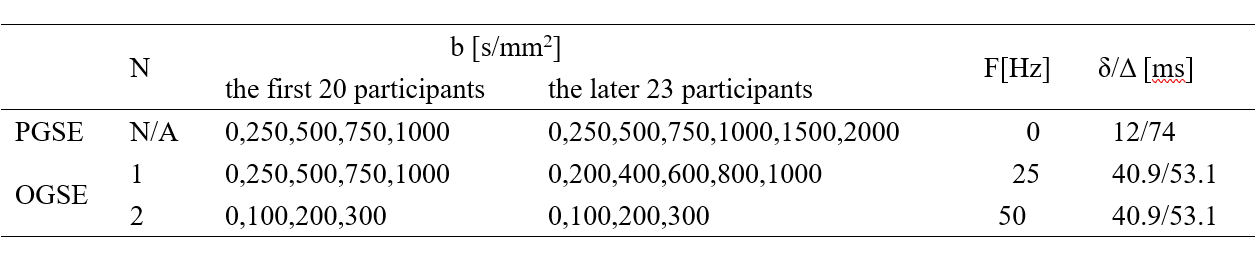
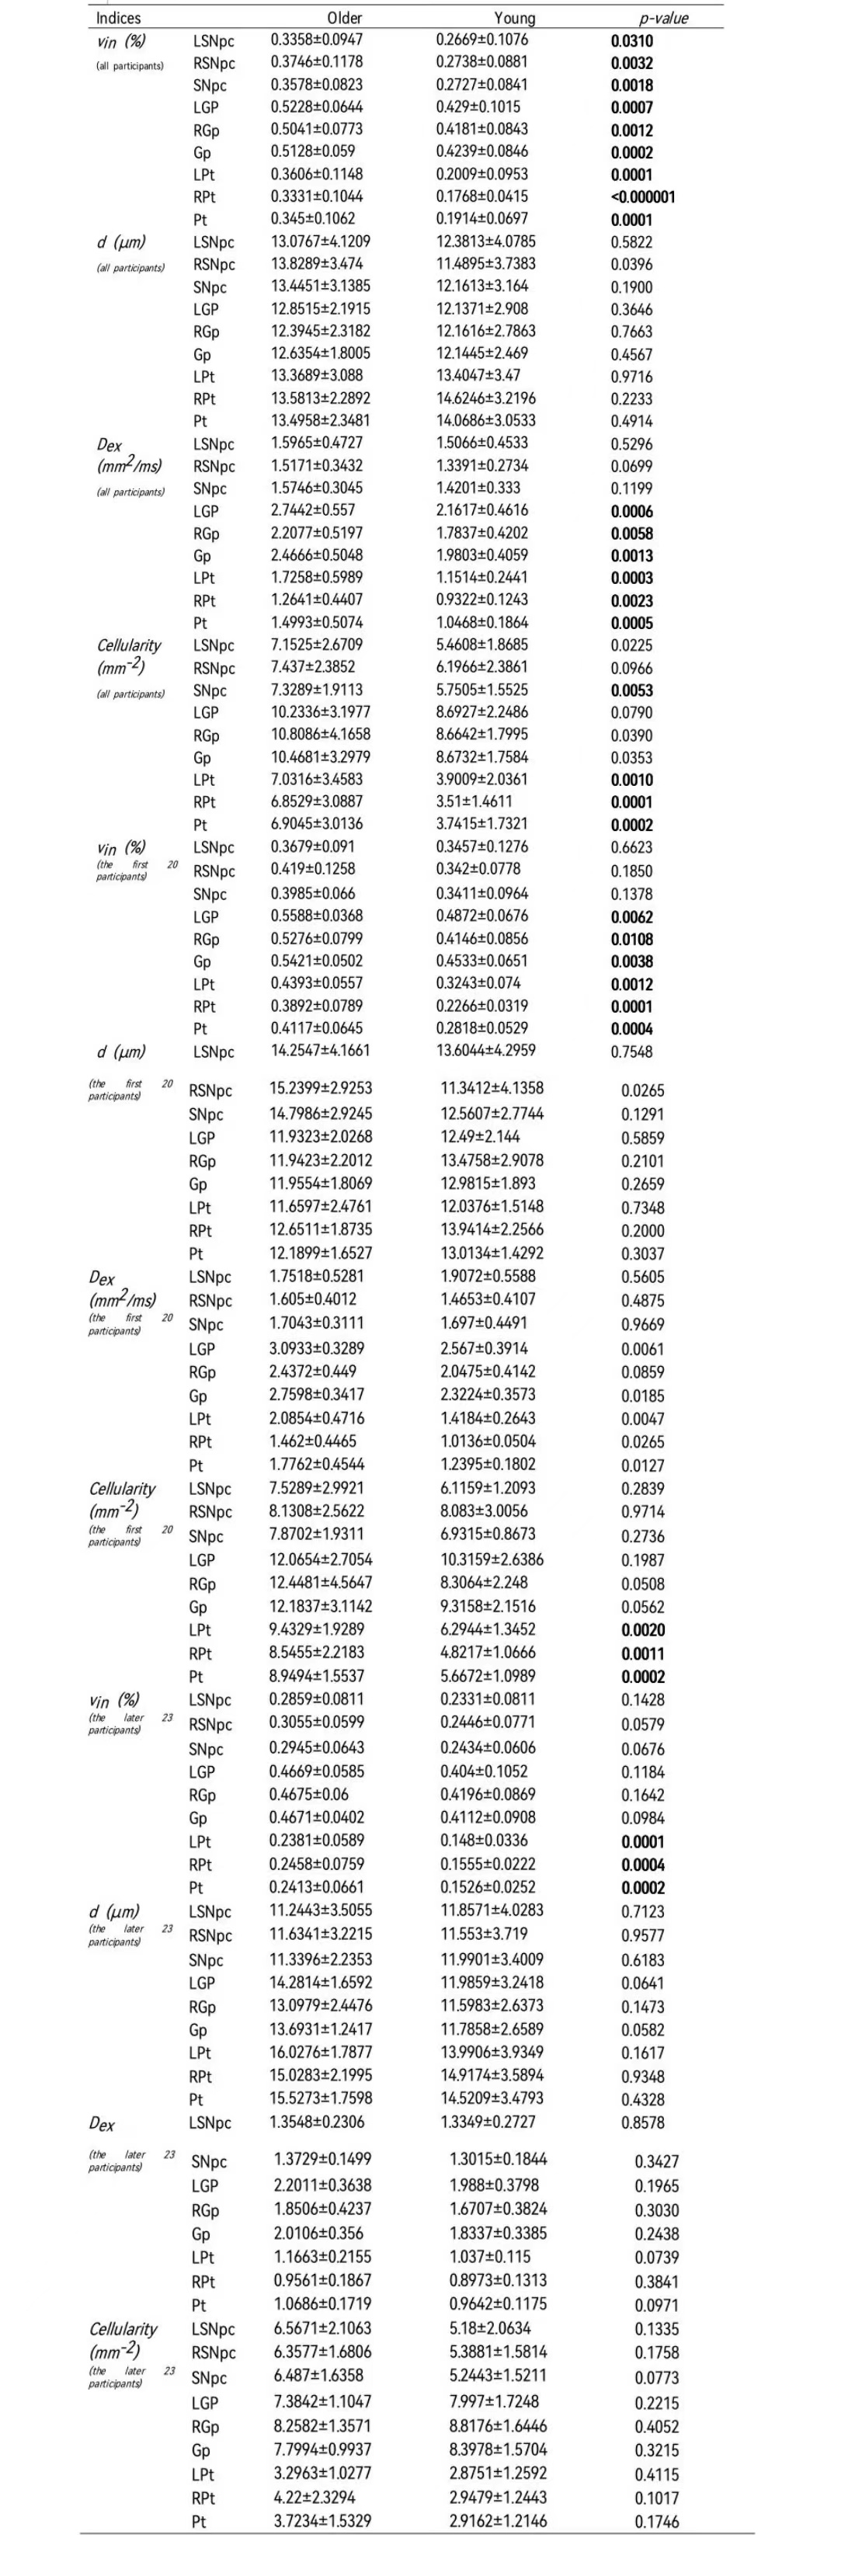
Table 2 vin, Dex, d and cellularity in the unilateral and bilateral ROIs in the SNpc, Gp and Pt between older and young adult cohorts. Data are presented as mean ± standard deviation.