1930
Comparing brain amyloid load using PET to grey matter perfusion using ASL on the OASIS-3 dataset1Institute of Biomedical Engineering, Department of Engineering Science, University of Oxford, Oxford, United Kingdom
Synopsis
Keywords: Neurodegeneration, Alzheimer's Disease, Tracers
Alzheimer’s disease (AD) is the leading cause of dementia, and it is associated with cerebral amyloid beta accumulation and changes in cerebral perfusion. Amyloid PET imaging can be used to measure the amyloid beta load, while ASL-MRI is preferred for cerebral perfusion measurements, which may occur before amyloid beta accumulation. This study compares the amyloid beta load with the CBF in grey matter, in both cognitively healthy and cognitively impaired subjects from the OASIS-3 dataset. A logistic regression model using this data was able to classify the cognitive status of subjects with a 78.48% test accuracy.Introduction
Alzheimer’s disease (AD) is a neurodegenerative disease that is the leading cause of dementia 1 2. The number of people living with dementia is projected to continue to increase over the next few decades 3 4; therefore, it is important to identify and understand pathological, physiological, and other biomarkers for the disease. AD is associated with an accumulation of amyloid beta in the brain 2 5 6 7, commonly measured using amyloid PET imaging 8 and the [18F]AV45 florbetapir (AV45) tracer 8 9. The standardized uptake value ratio (SUVR) is used for quantification of PET tracers including AV45 8, and the Centiloid scale, which uses typical “high-certainty” amyloid negative patients and “typical” Alzheimer’s disease patients as anchors on the scale, can be used to standardize the amyloid imaging assessments 10. Interestingly, changes in cerebral perfusion, which can be measured non-invasively using arterial spin labelling magnetic resonance imaging (ASL-MRI), may occur prior to the amyloid beta accumulation 7. Therefore, ASL-based perfusion imaging has the potential to provide a completely non-invasive MRI-based metric for earlier AD diagnosis 11.In this study, we compare the SUVR Centiloid values obtained with amyloid PET with the CBF perfusion in grey matter using ASL, in both cognitively healthy and cognitively impaired subjects from the OASIS-3 dataset 12. The aim was to investigate the relationship between these biomarkers of AD.
Methods
Data from 393 subjects (sex: 219F/174M; age: mean=71.22years, SD=8.22years) of the OASIS-3 dataset were selected for further analysis (PET [18F]AV45 scans and ASL-MRI). 3T Siemens scanners were used for the MRI acquisition, and single timepoint pulsed ASL (PASL) was used for labelling (TI1=700ms, TI2=1900ms, TR=4000ms). Individual cognitive levels were assessed and categorized as cognitively healthy (n=275, 159F/116M) or cognitively impaired (n=118, 60F/58M). PET processing included the calculation of two Centiloid values for the AV45 tracer: the FreeSurfer-calculated SUVR (fSUVR), and the FreeSurfer-calculated partial volume corrected SUVR using a regional spread function (fSUVR-rsf) 12. PET imaging analyses were performed using the PET unified pipeline (PUP), and the analysis used a peak time window of 50 to 70 minutes for the AV45 tracer 12.ASL data pre-processing was performed using FSL and included extraction of first volume (calibration image) and motion correction. A standard kinetic model was fitted to the data using BASIL 13 (T1a=1.65s, T1t=1.3s), and the resulting CBF maps were calibrated using a voxelwise long TR approach (labelling efficiency = 0.9) 14. Regional CBF values were computed for the grey matter (segmentation using FAST).
Results
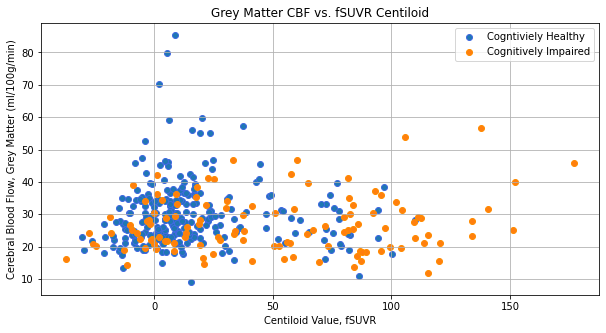
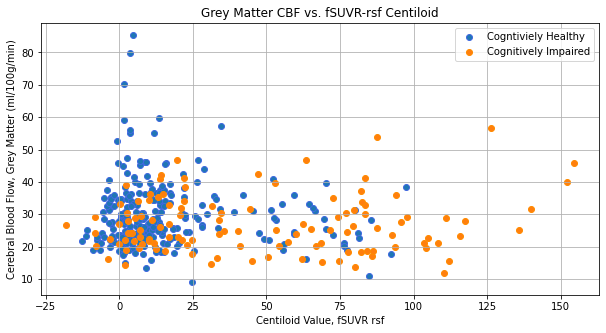
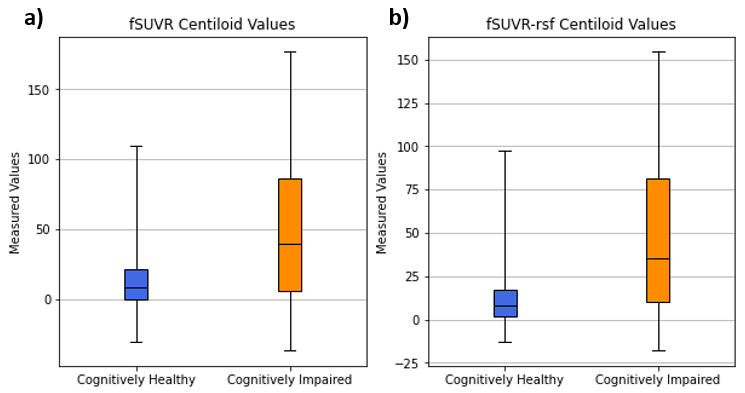
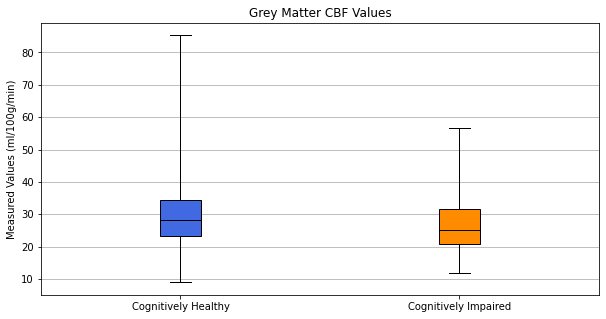
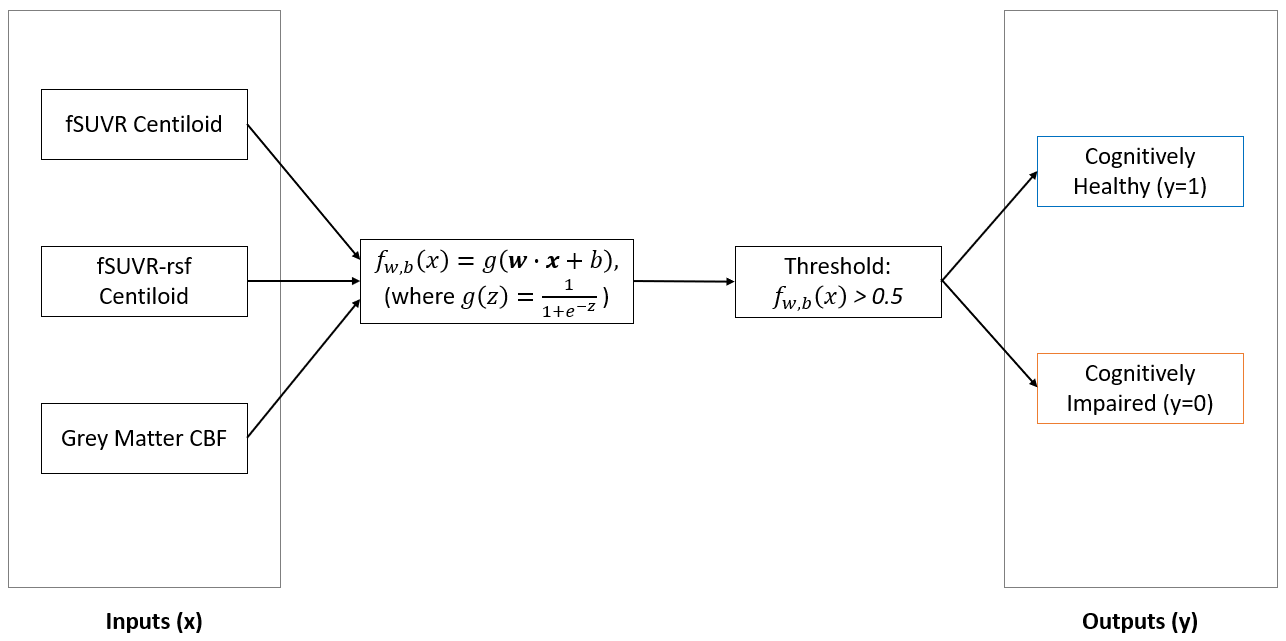
The fSUVR and fSUVR-rsf Centiloid values compared to the CBF perfusion in the grey matter for cognitively healthy and cognitively impaired groups are shown in Figures 1 and 2. The distributions of the Centiloid and CBF values for each group are shown in the box plots in Figures 3 and 4. The fSUVR and fSUVR-rsf Centiloid values within each group were closely matched.A logistic regression model, shown in Figure 5, was created to determine whether the cognitive function of subjects could be predicted from the fSUVR, fSUVR-rsf, and CBF values. Data from 314 subjects was used to train the model, while the remaining data from 79 subjects was used to test the model. The test accuracy was 78.48%.
Discussion
Both the standard and partial volume corrected SUVR Centiloid measurements were included in this analysis to attempt to identify any trends, and both provided similar results.There were statistically significant differences between cognitively healthy and impaired groups across their Centiloids and grey matter CBF measurements. The two Centiloid values and the grey matter CBF were used to create a logistic regression model to classify subjects as either cognitively healthy subjects or cognitively impaired. This model was successful in classifying test subjects with a 78.48% accuracy, which suggests that cortical amyloid beta levels and CBF perfusion in the grey matter can be used to classify subjects based on their cognitive function.
There are some additional trends that can be identified from the data. Of note, all the subjects with the highest CBF perfusion levels are cognitively healthy, and additionally, the subjects who have the highest CBF perfusion levels also have some of the lowest Centiloid values, representing a lower amyloid beta load. Conversely, all the subjects with the highest amyloid beta loads as seen by the higher belong to the cognitive impairment group; within this group the CBF perfusion levels were relatively unimpacted. These results indicate that an analysis of CBF perfusion on its own is not sufficient for distinguishing between cognitively healthy and cognitively impaired subjects, and there could be other factors that would impact this relationship. The OASIS-3 dataset also contains demographic information such as race, sex, age, and education, and these factors should be explored in isolation to identify any potential confounding effects.
Conclusion
We investigated the relationship between the fSUVR and fSUVR-rsf Centiloid values, and the grey matter CBF. A logistic regression model which uses these three measurements as inputs was able to classify subjects into cognitively healthy and cognitively impaired groups with a 78.48% success rate. More research should be conducted to investigate the role, if any, of other demographics and the relationship between amyloid beta load and grey matter CBF.Acknowledgements
Data were provided [in part] by OASIS-3: Principal Investigators: T. Benzinger, D. Marcus, J. Morris; NIH P50AG00561, P30NS09857781, P01AG026276, P01AG003991, R01AG043434, UL1TR000448, R01EB009352. AV-45 doses were provided by Avid Radiopharmaceuticals, a wholly owned subsidiary of Eli Lilly.References
1. DeTure, M. A. & Dickson, D. W. The neuropathological diagnosis of Alzheimer’s disease. Mol. Neurodegener. 14, 32 (2019).
2. Su, Y. et al. Partial volume correction in quantitative amyloid imaging. NeuroImage 107, 55–64 (2015).
3. Livingston, G. et al. Dementia prevention, intervention, and care: 2020 report of the Lancet Commission. The Lancet 396, 413–446 (2020).
4. Brookmeyer, R., Johnson, E., Ziegler-Graham, K. & Arrighi, H. M. Forecasting the global burden of Alzheimer’s disease. Alzheimers Dement. 3, 186–191 (2007).
5. Spires-Jones, T. L. & Hyman, B. T. The Intersection of Amyloid Beta and Tau at Synapses in Alzheimer’s Disease. Neuron 82, 756–771 (2014).
6. Huber, C. M., Yee, C., May, T., Dhanala, A. & Mitchell, C. S. Cognitive Decline in Preclinical Alzheimer’s Disease: Amyloid-Beta versus Tauopathy. J. Alzheimers Dis. 61, 265–281 (2018).
7. Hays, C., Zlatar, Z. & Wierenga, C. The Utility of Cerebral Blood Flow as a Biomarker of Preclinical Alzheimer’s Disease. Cell. Mol. Neurobiol. (Accepted), (2016).
8. Ottoy, J. et al. A simulation study on the impact of the blood flow-dependent component in [18F]AV45 SUVR in Alzheimer’s disease. PLOS ONE 12, e0189155 (2017).
9. Clark, C. M. et al. Use of Florbetapir-PET for Imaging β-Amyloid Pathology. JAMA 305, 275–283 (2011).
10. Klunk, W. E. et al. The Centiloid Project: Standardizing quantitative amyloid plaque estimation by PET. Alzheimers Dement. 11, 1 (2015).
11. Alsop, D. C., Detre, J. A. & Grossman, M. Assessment of cerebral blood flow in Alzheimer’s disease by spin-labeled magnetic resonance imaging. Ann. Neurol. 47, 93–100 (2000).
12. LaMontagne, P. J. et al. OASIS-3: Longitudinal Neuroimaging, Clinical, and Cognitive Dataset for Normal Aging and Alzheimer Disease. http://medrxiv.org/lookup/doi/10.1101/2019.12.13.19014902 (2019) doi:10.1101/2019.12.13.19014902.
13. BASIL: Bayesian Interface for Arterial Spin Labeling MRI. FSL, Oxford Centre for Functional MRI of the Brain https://fsl.fmrib.ox.ac.uk/fsl/fslwiki/BASIL.
14. Pinto, J. et al. Calibration of arterial spin labeling data—potential pitfalls in post-processing. Magn. Reson. Med. 83, 1222–1234 (2020).
Figures