1929
Glutathione+γ-Aminobutyric Acid Detection Improves Inter-Subject Concentration Variability at 3T
Jack Knight-Scott1, Marie Caillaud2, Isabelle Gallagher2, Yanrong Li2, and Andreana P. Haley2
1Radiology, Children's Healthcare of Atlanta, Atlanta, GA, United States, 2Psychology, The University of Texas at Austin, Austin, TX, United States
1Radiology, Children's Healthcare of Atlanta, Atlanta, GA, United States, 2Psychology, The University of Texas at Austin, Austin, TX, United States
Synopsis
Keywords: Neurodegeneration, Spectroscopy
Quantification of the combination glutathione (GSH) + γ-aminobutyric acid (GABA) at 3T in medium TE but high signal-noise brain spectra yields a stable concentration with a low coefficient of variation (CV) of only 6%, smaller than individual CV values for GSH or GABA. While an indication of the interdependency of GSH and GABA quantification, [GSH+GABA] also suggests a pathway for the study of perturbations in GABA and GSH at 3T while maintaining the high information content typical of un-edited spectra.Introduction
In vivo neuro-studies at 3T are limited in the measurement γ-aminobutyric acid (GABA) due to its normally low concentration and significant overlap with other metabolites, particularly macromolecules (MM) and glutathione (GSH) (1). While spectral editing at 3T improves the reliability of GABA detection by partially separating its C4 multiplet, overall information content is greatly sacrificed. In this work, we examine the potential use of high SNR spectra for indirectly studying GABA at 3T in the clinical setting, while maintaining the high information content associated with short-to-medium echo time (TE) spectra.Methods
The study was approved by the IRB and performed on a Siemens 3T MRI system using a 20-channel phased-array head-neck coil. High SNR water-suppressed spectra were acquired from 5 participants (3/2 female/male, age range: 46-68 yrs, mean: 62.4±9.2 yrs) using a commercial PRESS sequence (occipito-parietal junction (Fig. 1), 288 NEX, 16.4 mL, TE/TR=30/2000 ms, 2500 Hz SW, 2048 pts). A water reference, 8 NEX, was acquired and corrected for T1 and T2 losses to use for molal quantitation (2,3). All water-suppressed spectra were analyzed using LCModel 6.3-1R (4) using the signal-corrected water reference for quantitation. Spectra were analyzed with and without GSH in a 19-metabolite basis set: alanine (Ala), aspartate (Asp),creatine (Cr), GABA, glucose (Glc), glutamate (Glu), glutamine (Gln), GSH, glycine (Gly), glycerophosphocholine (GPC), lactate (Lac), myo-Inositol (mI), N-acetylaspartate(NAA), N-acetylaspartylglutamate (NAAG), phosphocholine(PCh), phosphocreatine (PCr), phosphoroylethanolamine (PE), scyllo-Inositol (sI), and taurine (Tau). To reflect the inherent difficulty in separating overlapping metabolite spectral patterns, PC+GPC is reported as tCho, Cr+PCr is reported as tCr, and mI+Gly is reported as mIno+.Results
The effect of high SNR is obvious in Table 1, with the primary metabolites: NAA, tCr and tCho, all with CRLB of 3% or less, and coefficient of variation (CV) values of 5% and less. In comparison, GABA has a respectable, but slightly high CV of 13.7% but a CRLB nearly ten points higher. Removal of GSH from the basis set increased the GABA concentration by 82% (range: 47-107%, Fig. 2), increased the CV from 13.7% to 16.7%, but lowered the average Cramér-Rao Lower Bounds (CRLB) from 23.4% to 14.4%. In comparison, the combination of GSH and GABA, yielded a CRLB of ~ 10% and a CV of only 6% that is better than GABA or GSH measured alone.| Table 1. Concentration µmoles/g ± CRLB | |||||||||||||||||||||||||||
| Subject | NAA | mIno+ | Glu | tCr | tCho | PE | GSH | GABA | GSH+GABA | ||||||||||||||||||
| 1 | 10.08 | ± | 2 | 6.15 | ± | 3 | 7.94 | ± | 5 | 7.68 | ± | 2 | 1.63 | ± | 2 | 2.89 | ± | 13 | 1.89 | ± | 7 | 1.13 | ± | 26 | 3.02 | ± | 10 |
| 2 | 9.25 | ± | 2 | 5.52 | ± | 3 | 7.55 | ± | 5 | 7.07 | ± | 2 | 1.47 | ± | 3 | 2.62 | ± | 13 | 1.59 | ± | 8 | 1.44 | ± | 19 | 3.04 | ± | 10 |
| 3 | 9.51 | ± | 2 | 6.20 | ± | 3 | 8.35 | ± | 4 | 7.77 | ± | 1 | 1.47 | ± | 3 | 2.92 | ± | 12 | 1.94 | ± | 7 | 1.14 | ± | 26 | 3.09 | ± | 10 |
| 4 | 10.01 | ± | 2 | 4.97 | ± | 2 | 7.42 | ± | 5 | 6.85 | ± | 2 | 1.52 | ± | 2 | 3.23 | ± | 12 | 1.94 | ± | 7 | 1.40 | ± | 20 | 3.33 | ± | 9 |
| 5 | 9.78 | ± | 2 | 6.50 | ± | 2 | 7.61 | ± | 4 | 7.17 | ± | 2 | 1.57 | ± | 2 | 3.08 | ± | 12 | 1.76 | ± | 7 | 1.07 | ± | 26 | 2.83 | ± | 10 |
| Mean | 9.73 | | | 5.87 | | | 7.78 | | | 7.31 | | | 1.53 | | | 2.95 | | | 1.82 | | | 1.24 | | | 3.06 | | |
| std | 0.35 | 0.62 | 0.38 | 0.40 | 0.07 | 0.12 | 0.15 | 0.170 | 0.182 | ||||||||||||||||||
| CV | 3.6% | 10.5% | 4.8% | 5.4% | 4.3% | 4.0% | 8.2% | 13.7% | 5.9% | ||||||||||||||||||
Discussion
As discussed in detail by Near et al. (5), GABA metabolite concentration variability is strongly dependent on line width and SNR that is not wholly predicted by CRLB. In high SNR spectra such as acquired here (Fig. 3) metabolite line width and hence peak overlap might well dominate concentration variability. As suggested by Near et al, our GABA variability is considerably lower than one would expect for CRLB values above 20%. Comparison of mean GABA concentrations with and without GSH in the model, demonstrates the sensitivity of GABA to overlapping contributions from GSH, suggesting that GABA and GSH spectral patterns are irrevocably linked in unedited spectra at 3T at a medium TE of 30 ms. Examination of the combination of GSH+GABA yields a CV that is lower than either GSH or GABA, further indication that GSH and GABA are not accurately separated. With such a low CV, these preliminary results suggest that small changes in GABA or GSH might be indirectly detectable through the combination measurement. Further stability might be gained through reduced TEs, as complex coupled spin systems such as GABA an GSH detectability improves at very short TE acquisitions (5 ms < TE ≤ 10 ms) (6,7).Conclusion
At a medium TE of 30 ms, results suggest that in high SNR spectra at 3T, the combination concentration of glutathione+γ-aminobutyric acid is more reliable than separate measurements of GSH or GABA. With a CV of only 5.9%, GSH+GABA could be measurably sensitive to any underlying perturbations of either metabolite, and thus provide a new method for tracking potential changes in either.Acknowledgements
No acknowledgement found.References
- Mescher M, Merkle H, Kirsch J, Garwood M, Gruetter R. Simultaneous in vivo spectral editing and water suppression. NMR Biomed 1998;11:266–272.
- Provencher S. Estimation of metabolite concentrations from localized in vivo proton NMR spectra. Magn Reson Med 1993; 30:672-679.
- Knight-Scott J. Analysis of saturated T2 curves for rapid relaxometry measurements in PRESS localization. Proc. ISMRM, 19th Scientific Meeting and Exhibition, (Montreal, Canada, 2011) p 1454.
- Knight-Scott J et al. Molality as a unit of measure for expressing 1H MRS brain metabolite concentrations in vivo. Magn Reson Imag 2003; 21:787-797.
- Near J et al. Unedited in vivo detection and quantification of γ-aminobutyric acid in the occipital cortex using short-TE MRS at 3 T. NMR Biomed. 2013; 26:1353-62.
- Wijtenburg SA et al. Reproducibility of phase rotation STEAM at 3T: focus on glutathione. Magn Reson Med 2014; 72:603–609.
- Wijtenburg SA et al. Comparing the reproducibility of commonly used magnetic resonance spectroscopy techniques to quantify cerebral glutathione. J. Magn. Reson. Imaging 2019; 49:176–183.
Figures
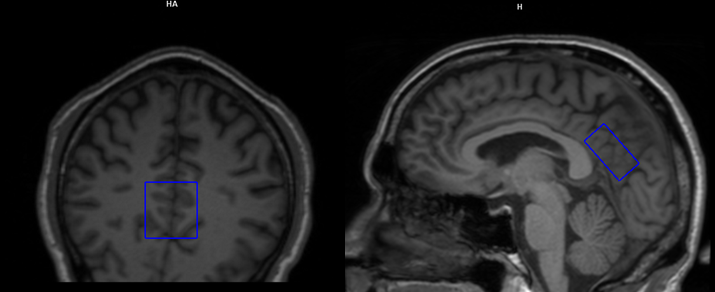
Figure 1. Position of typical localization VOI.
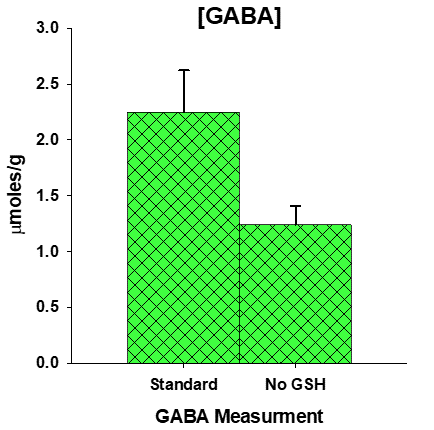
Figure 2. GABA concentration dependency on GSH presence in basis set.
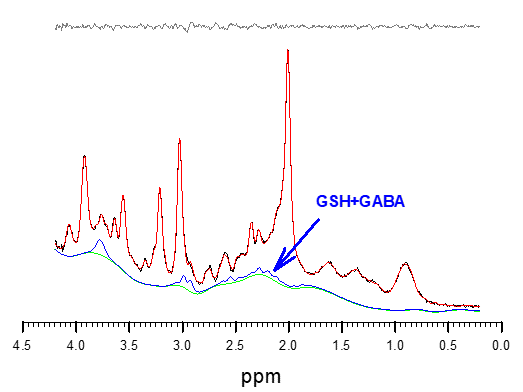
Figure 3. Typical LCModel fit to high SNR spectra with GABA+GSH characteristic spectrum.
DOI: https://doi.org/10.58530/2023/1929