1918
T2 mapping with GRAPPATINI for the characterization of adult-onset and juvenile-onset Huntington Disease
Maria Eugenia Caligiuri1, Maria Celeste Bonacci1, Tobias Kober2, Domenico Zacà3, Ferdinando Squitieri4,5, Aldo Quattrone1, and Umberto Sabatini1
1Neuroscience Research Center, Università degli Studi Magna Graecia di Catanzaro, Catanzaro, Italy, 2Advanced Clinical Imaging Technology, Siemens Healthcare AG, Lausanne, Switzerland, 3Siemens Healthcare, Milan, Italy, 4Italian League for Research on Huntington Disease, Rome, Italy, 5IRCSS Casa Sollievo della Sofferenza/CSS-Mendel, Rome, Italy
1Neuroscience Research Center, Università degli Studi Magna Graecia di Catanzaro, Catanzaro, Italy, 2Advanced Clinical Imaging Technology, Siemens Healthcare AG, Lausanne, Switzerland, 3Siemens Healthcare, Milan, Italy, 4Italian League for Research on Huntington Disease, Rome, Italy, 5IRCSS Casa Sollievo della Sofferenza/CSS-Mendel, Rome, Italy
Synopsis
Keywords: Neurodegeneration, Rare disease, Huntington Disease
T2 mapping is a quantitative MRI technique that may provide further insight regarding the changes that differentially underlie Huntington Disease in two of its clinical forms, adult-onset and juvenile-onset. Here we present pilot evidence that the study of T2 properties of the brain might be of great benefit to the research focused on this rare disease.Background
Juvenile-onset Huntington’s disease (joHD, neurological onset ≤ 20 years) is a rare HD variant associated with large CAG repeat-size alleles ( > 60), which shows different clinical features from adult-onset HD, and typically progresses more rapidly.(1) For these reasons, it is crucial to monitor and characterize patterns of disease progression in joHD and compare them to the more studied adult form. Quantitative MRI (qMRI) techniques, which measure intrinsic properties of brain tissue, may provide further insight regarding the changes that differentially underlie the two forms of HD.Objective
In this study we have analyzed T2 maps of 14 patients with HD (12 with adult-onset HD, 2 with joHD), with the aim of comparing the distribution of T2 values in the striatum of the adult and the juvenile-onset phenotype.Methods
Fourteen patients with HD (12 adult-onsetHD 8M/4F, age: 44.1±10.5; 2 joHD, 2F, 22 and 24 yo), underwent an hybrid acquisition on a 3T PET-MR Biograph mMR (Siemens Healthcare). The protocol comprised, among other MRI sequences and FDG-PET, a T2 relaxometry sequence (GRAPPATINI (2), TR=4s, 5 undersampling blocks, 16 echos, 0:174.4ms, spaced by 10.9 ms; Resolution: 0.45 x 0.45 x 4 mm3). T2 mapping acquisition and reconstruction were performed using a multi-contrast spin-echo research application sequence. This sequence applies an iterative reconstruction procedure that allows to obtain T2 maps directly on the scanner, with a very convenient acquisition time (~3 minutes). In particular, a block-sampling scheme is employed to split the k-space in N blocks, one per echo time. At each TE, only one block is sampled, meaning that the k-space center is sampled once in N echo times. As an empirical result, it is suggested that improved results are obtained by sampling the center at least 3 times (3*N+1 echoes should be sampled - here we had 5 undersampling blocks and 16 echos). During offline post-processing, we processed the 3D T1-weighted images (ADNI-style MPRAGE) with Freesurfer, to obtain segmentations of gray and white matter and of the bilateral striatum (putamen + caudate). The striatal region of interest was chosen since it is a crucial site for HD-related abnormalities, usually detected earlier and in larger measure in joHD rather than HD. Afterwards, using FSL, a simulated TE=80s image (output of the WIP package, with more anatomical detail) was used to calculate the linear transform to the individual structural space. This transform was then applied to the T2map. Finally, we calculated histograms of T2 value distributions in left and right caudate nucleus and putamen. Histograms were calculated after masking out CSF voxels, to avoid contamination of high signal values. Normalization and graphical representation of the histograms were performed using an in-house script in matlab: for each joHD patient and each ROI, we compared the individual histogram towards the first quartile, second quartile (median) and third quartile of the adult-onset HD cohort distribution of T2 values.Results and Discussion
The distributions of T2 values in the striatal regions greatly differed between adult-onset and joHD (Figures 1 & 2 show caudate distribution for the two joHD patients, Figures 3 & 4 show the putaminal distributions). In particular, the median shape of the distribution in the adult cohort was indeed different from the expected T2 distribution in healthy tissue, as reported in literature (3), but centered on plausible T2 values for GM structures (~ 50 ms). On the contrary, the histograms derived from the two joHD patients were more narrow but completely shifted towards higher T2 values, suggesting that the processes of striatal degeneration in this subtype of HD are greatly accelerated compared to the adult form (of note: the joHD patients have half the age of most adultHD) (4). Furthermore, we also found evidence of asymmetric damage between the two hemispheres, in both structures and for both patients, a less common finding among adult-onset patients, which has been instead described in histopathological studies on the very rare pediatric and juvenile forms of HD.Conclusion
T2 relaxometry, and qMRI techniques in general, might provide great benefits to the field of HD research. In particular, they might provide additional information, complementary to what is already known from post-mortem histopathology in these rare (and rarest, in case of joHD) patients. Earlier and better characterization of disease status and progression might help to better identify optimal candidates for future trials of newly developed drugs.Acknowledgements
No acknowledgement found.References
1. Fusilli, C.; Migliore, S.; Mazza, T.; et al. Biological and clinical manifestations of juvenile Huntington’s disease: a retrospective analysis. Lancet Neuro 2018, 17.11, 986-993.
2. Hilbert, T et al. “MARTINI and GRAPPA – When Speed is Taste." Proc Int Soc Magn Reson Med. Milan, Italy(2014).
3. Cercignani, M., Dowell, N.G., and Tofts P. Quantitative MRI of the Brain, second edition, CRC Press (2004), 93-94.
4. Tabrizi, S.; Scahill, R.I.; Owen, G.; et al. Predictors of phenotypic progression and disease onset in premanifest and early-stage Huntington's disease in the TRACK-HD study: analysis of 36-month observational data. The Lancet Neurology 12.7 (2013): 637-649.
Figures
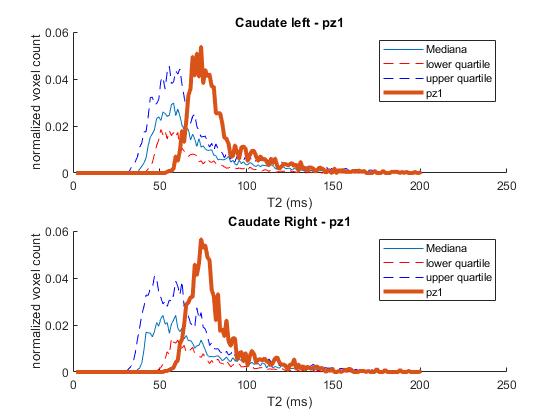
Figure 1: Caudate T2 distribution for a HDstage 3 patient with joHD (bold line) compared to the median and IQR distribution of the adult HD patients
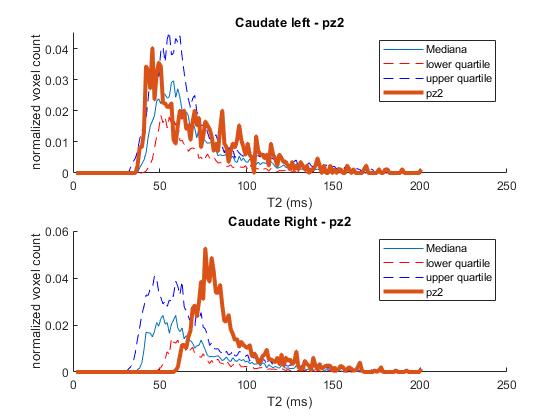
Figure 2: Caudate T2 distribution for a HDstage 2 patient with joHD (bold line) compared to the median and IQR distribution of the adult HD patients
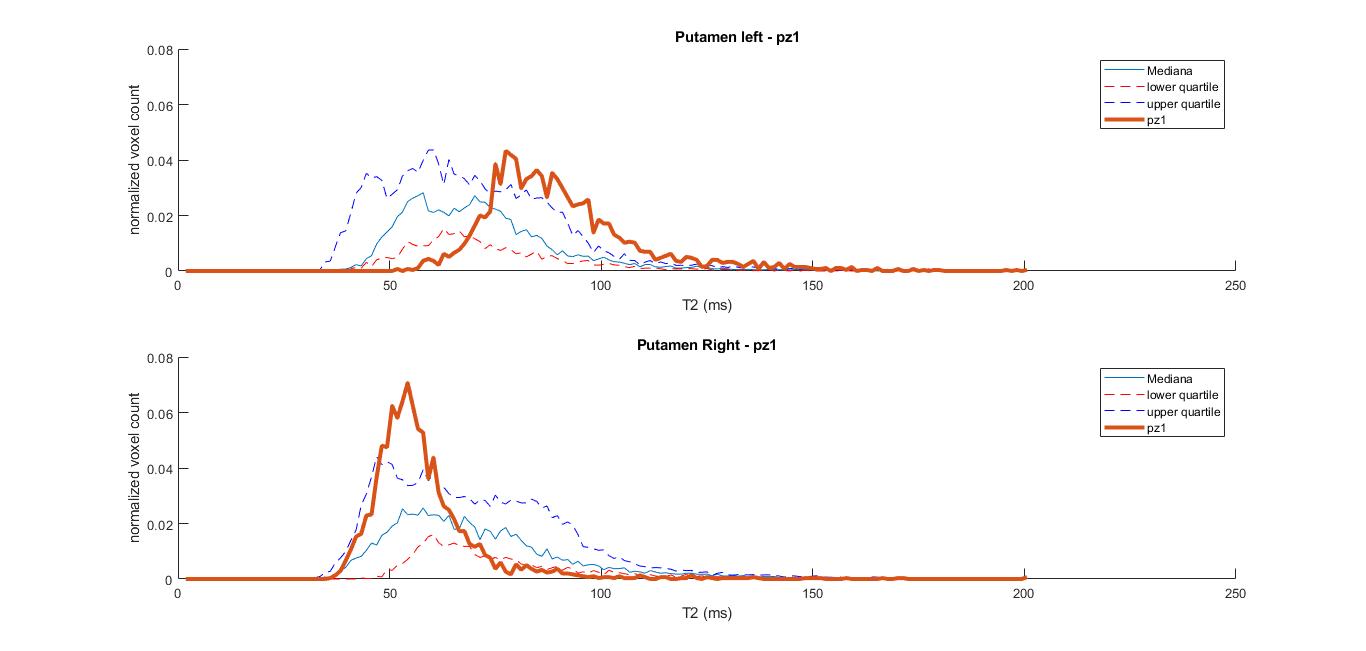
Figure 3: Putaminal T2 distribution for a stage 3 patient with joHD (bold line) compared to the median and IQR distribution of the adult HD patients
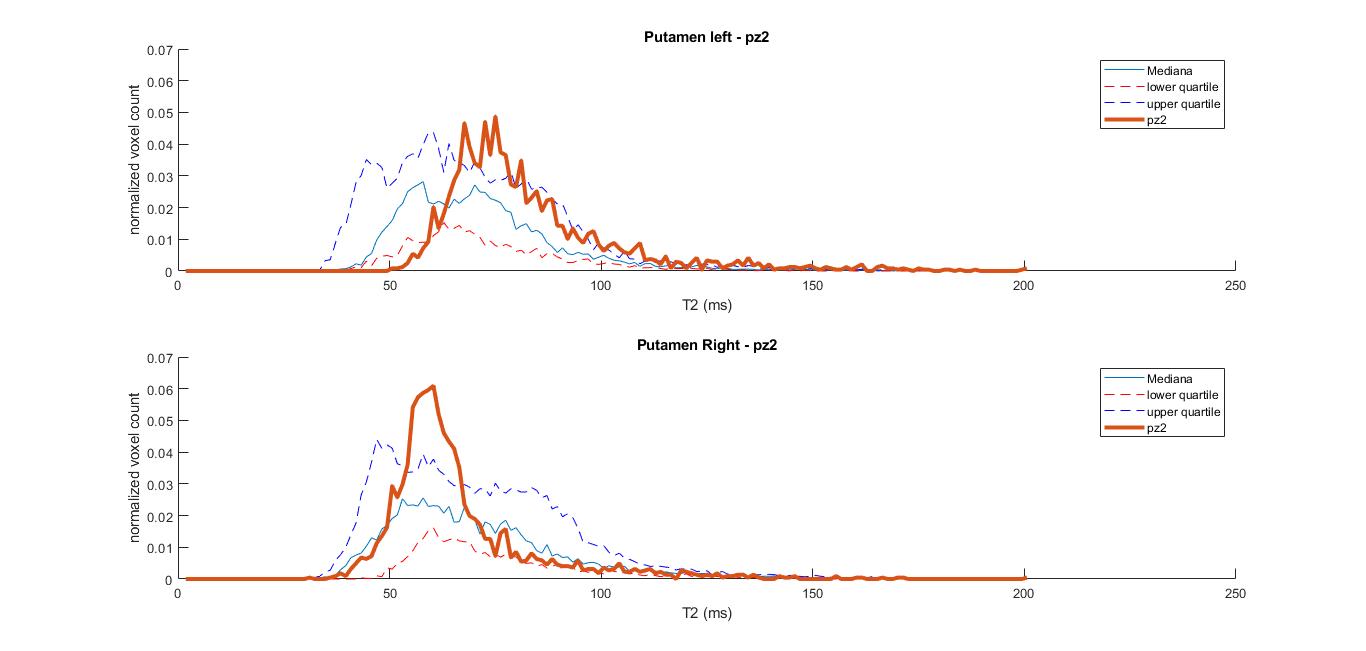
Figure 4: Putaminal T2 distribution for a stage 2 patient with joHD (bold line) compared to the median and IQR distribution of the adult HD patients
DOI: https://doi.org/10.58530/2023/1918