1915
Leakage phase perfusion in healthy volunteers and subjects post-COVID-19: results from the C-MORE study1POLARIS, University of Sheffield MRI Unit, IICD, The University of Sheffield, Sheffield, United Kingdom, 2Institute for Lung Health, Leicester NIHR Biomedical Research Centre, University of Leicester, Leicester, United Kingdom, 3Department of Health Sciences, University of Leicester, Leicester, United Kingdom, 4Division of Cardiovascular Medicine, Radcliffe Department of Medicine, National Institute for Health Research (NIHR) Oxford Biomedical Research Centre (BRC), University of Oxford, Oxford, United Kingdom, 5Division of Cardiovascular Medicine, Radcliffe Department of Medicine, University of Oxford, Oxford, United Kingdom, 6Full group details can be found in Appendix 1 of, https://doi.org/10.1016/S2213-2600(21)00383-0, London, United Kingdom
Synopsis
Keywords: Lung, Lung
Disruption to pulmonary perfusion is seen in several diseases, with most work focusing on the first-pass to calculate metrics of pulmonary blood volume and flow and mean transit time. The additional information from the leakage-phase acquisition has shown utility in multiple organs but it is less commonly used in the lung. This work aimed to assess the differences between fitting data with and without the first-pass bolus to estimate the volume transfer constant and fractions of blood in the extravascular-extracellular space and plasma in a multicentre setting.Introduction
Disruption to pulmonary perfusion is seen in a number of diseases1-4, with most work focusing on the first-pass to calculate metrics of pulmonary blood volume and flow (PBV/PBF) and mean transit time (MTT), or by quantifying the presence of defects5-9. Leakage-phase acquisitions have shown utility in multiple organs10-12 but is less commonly used in the lung13, primarily due to the movement of the lung during long dynamic contrast-enhanced MRI (DCE-MRI) acquisitions. This work aimed to assess the differences between fitting data with/without the first-pass bolus to estimate the volume transfer constant, and fractions of blood in the extravascular-extracellular space and plasma14.Methods
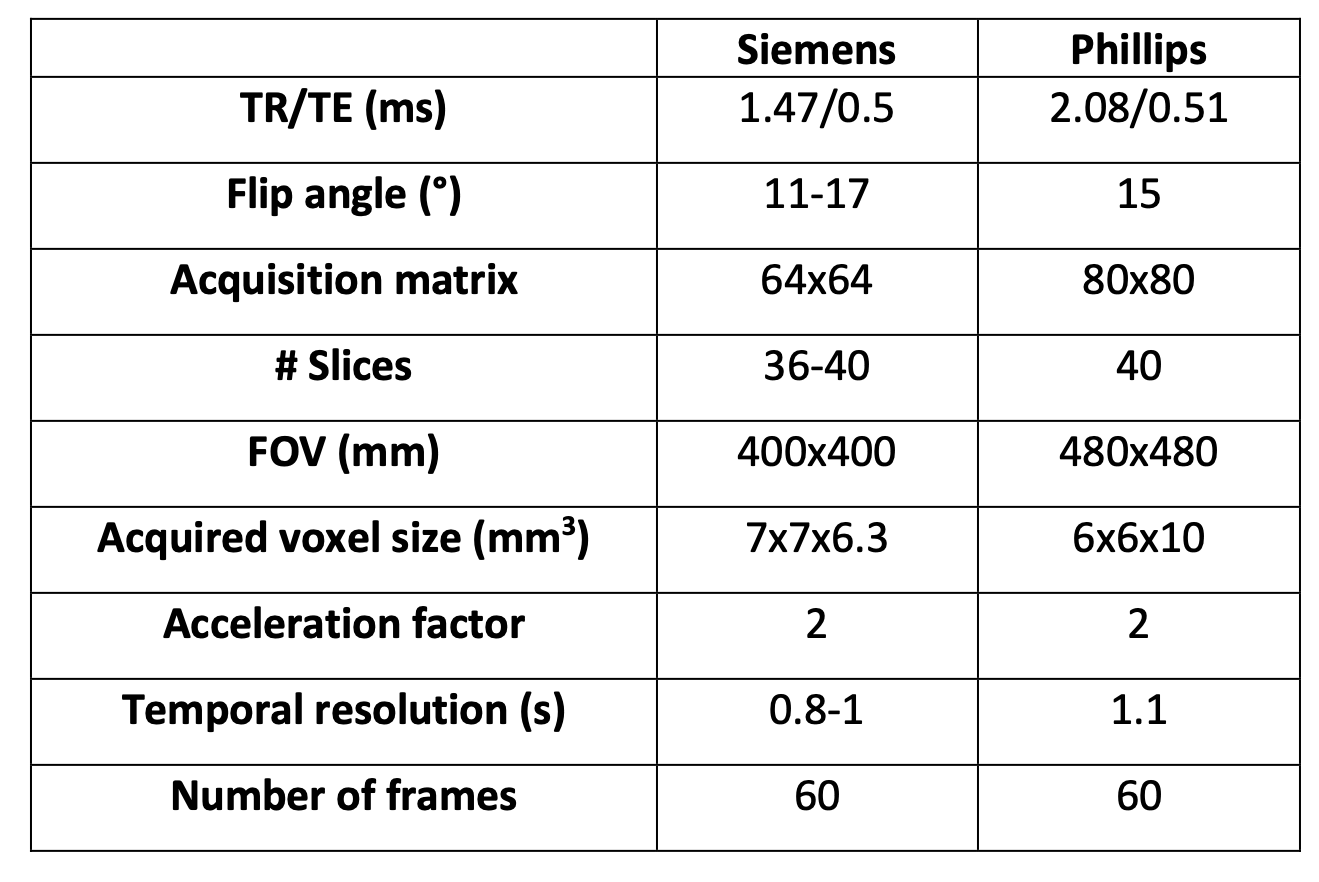
Subjects were recruited from 12 centres as part of the ongoing C-MORE study (NCT04510025).Imaging: Images were acquired at 3 Tesla (Phillips Ingenia, Achieva, Siemens Skyra, Siemens Prisma, Siemens Magnetom Vida) using the same protocol (Table 1), save for minor differences due to manufacturer limitations. Patients were required to hold their breath at end-expiration for as long as possible.
Image analysis: All data was co-registered to the first frame of the acquisition using the ANTs registration package15. Peak signal enhancement images, generated by taking the maximum signal enhancement over the whole dynamic time course for each voxel, were segmented to exclude the left and right pulmonary veins, pulmonary artery and second generation pulmonary arterial vessels using ITK-SNAP16.
Signal intensity was converted to contrast agent concentration by using the signal normalisation method:$$\frac{S(t)-S(0)}{S(0)}$$Where S(t) is the signal at time point t, and S(0) is the signal from the first acquisition. This conversion method was chosen due to the absence of pre-contrast measurements of longitudinal relaxation time of the lung.
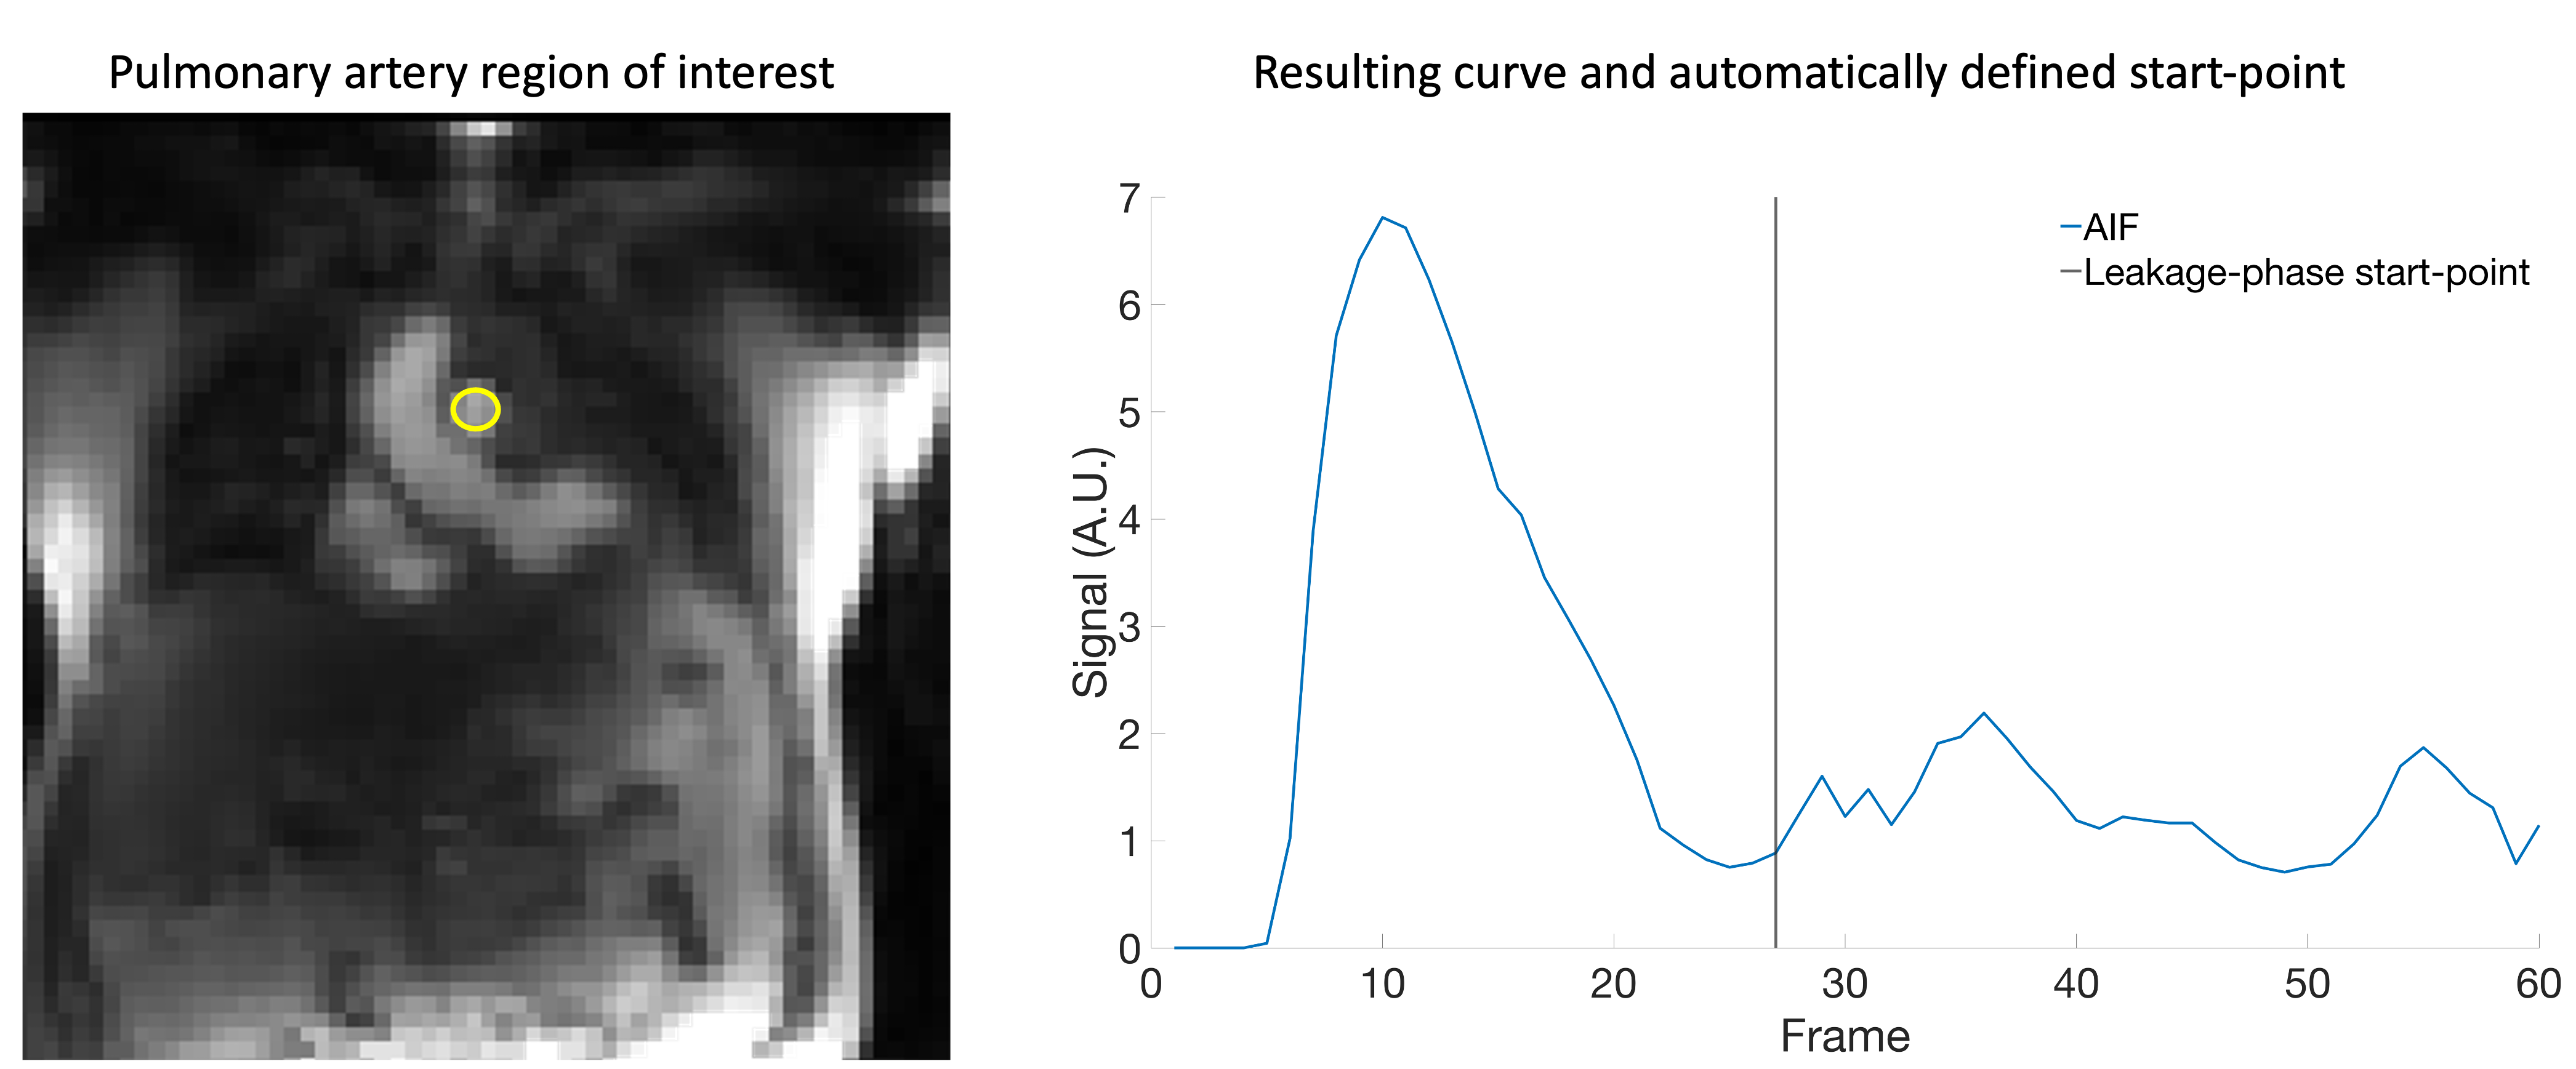
The arterial input function (AIF) was defined by manually placing a region of interest in the pulmonary artery. The Extended Tofts model was then applied by utilising open source software for perfusion analysis17 to generate parametric maps of: volume transfer constant (Ktrans) and the plasma and interstitial volume fractions (vp and ve respectively).
Data were analysed in two ways; first all frames of the data were fit using the Extended Tofts model (all_data). Second, automated code was developed to identify the two highest peaks in the arterial input function (AIF) and locate the minima between these points. By adding 5 frames to this point (to account for delay between contrast in the pulmonary artery and lung) the start-point of the leakage-phase only (leak_only) data was defined (Figure 1). Prior to this calculation data was smoothed using a Savitsky-Golay18 filter with order of 3 and frame length of 5.
Statistical analysis
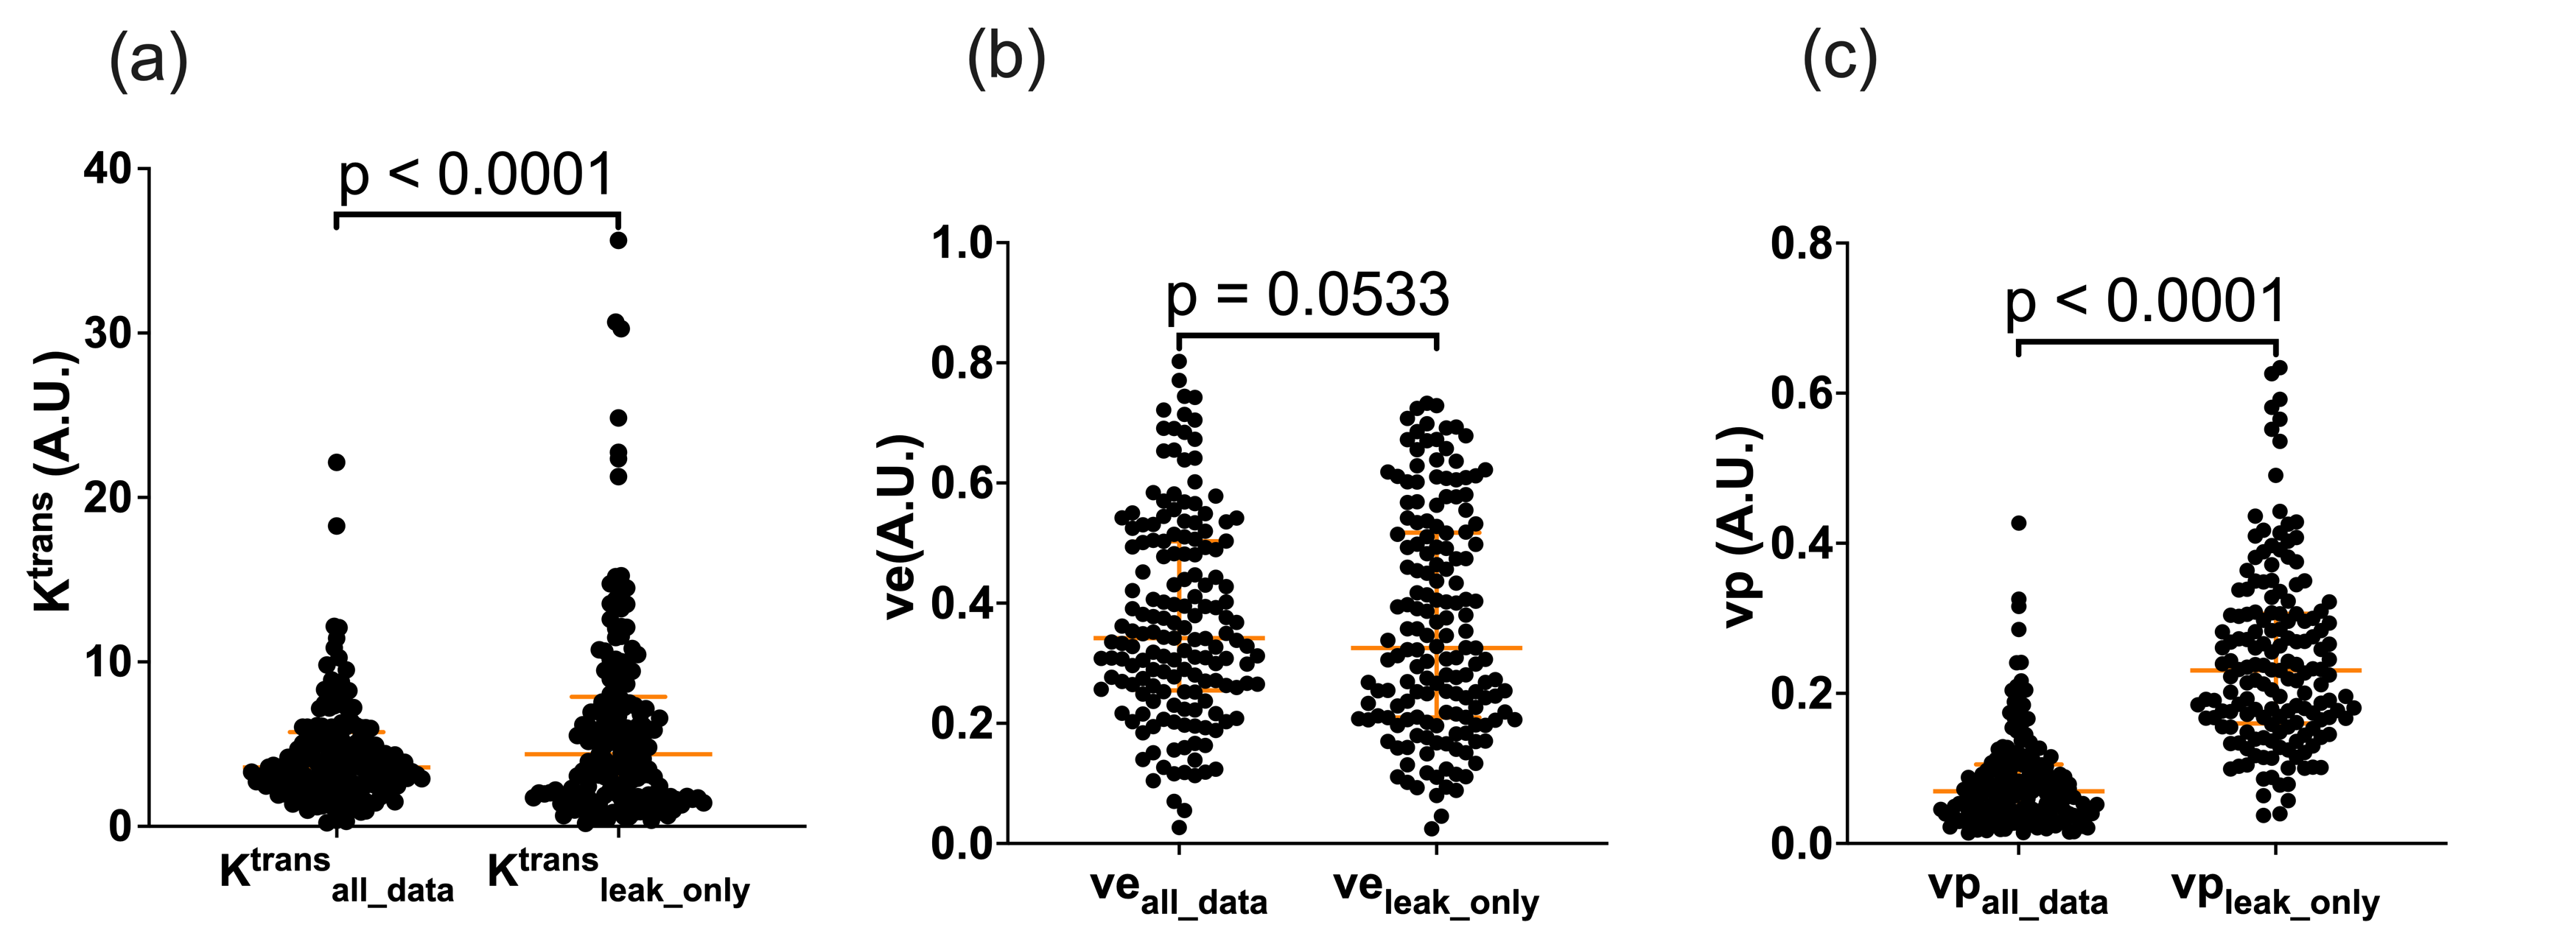
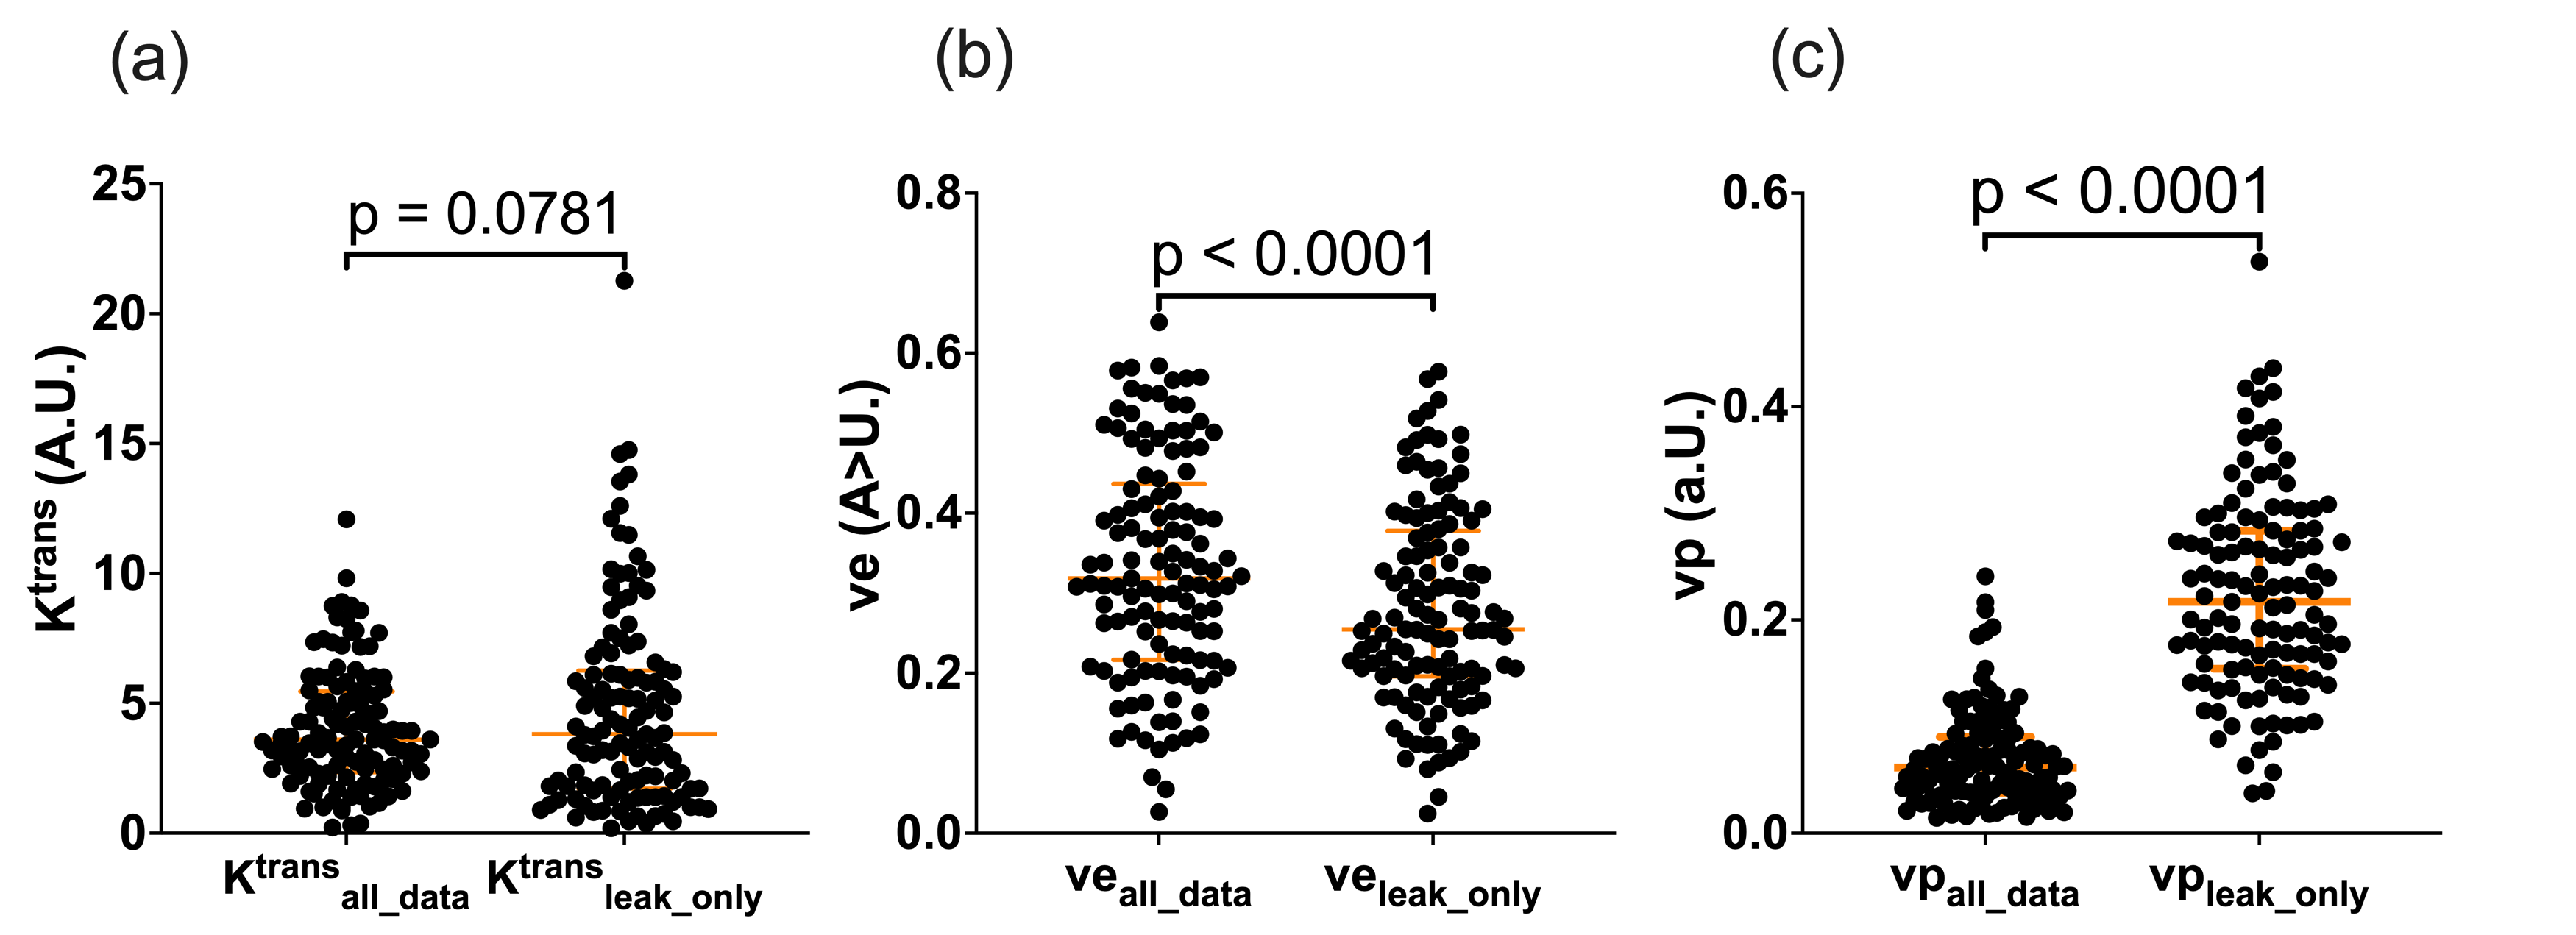
Data were assessed for normality using the Shapiro-Wilk test. Wilcoxon matched-pairs t tests were carried out to compare Ktrans, νe and νp generated from all data and from the leakage phase only data.Results
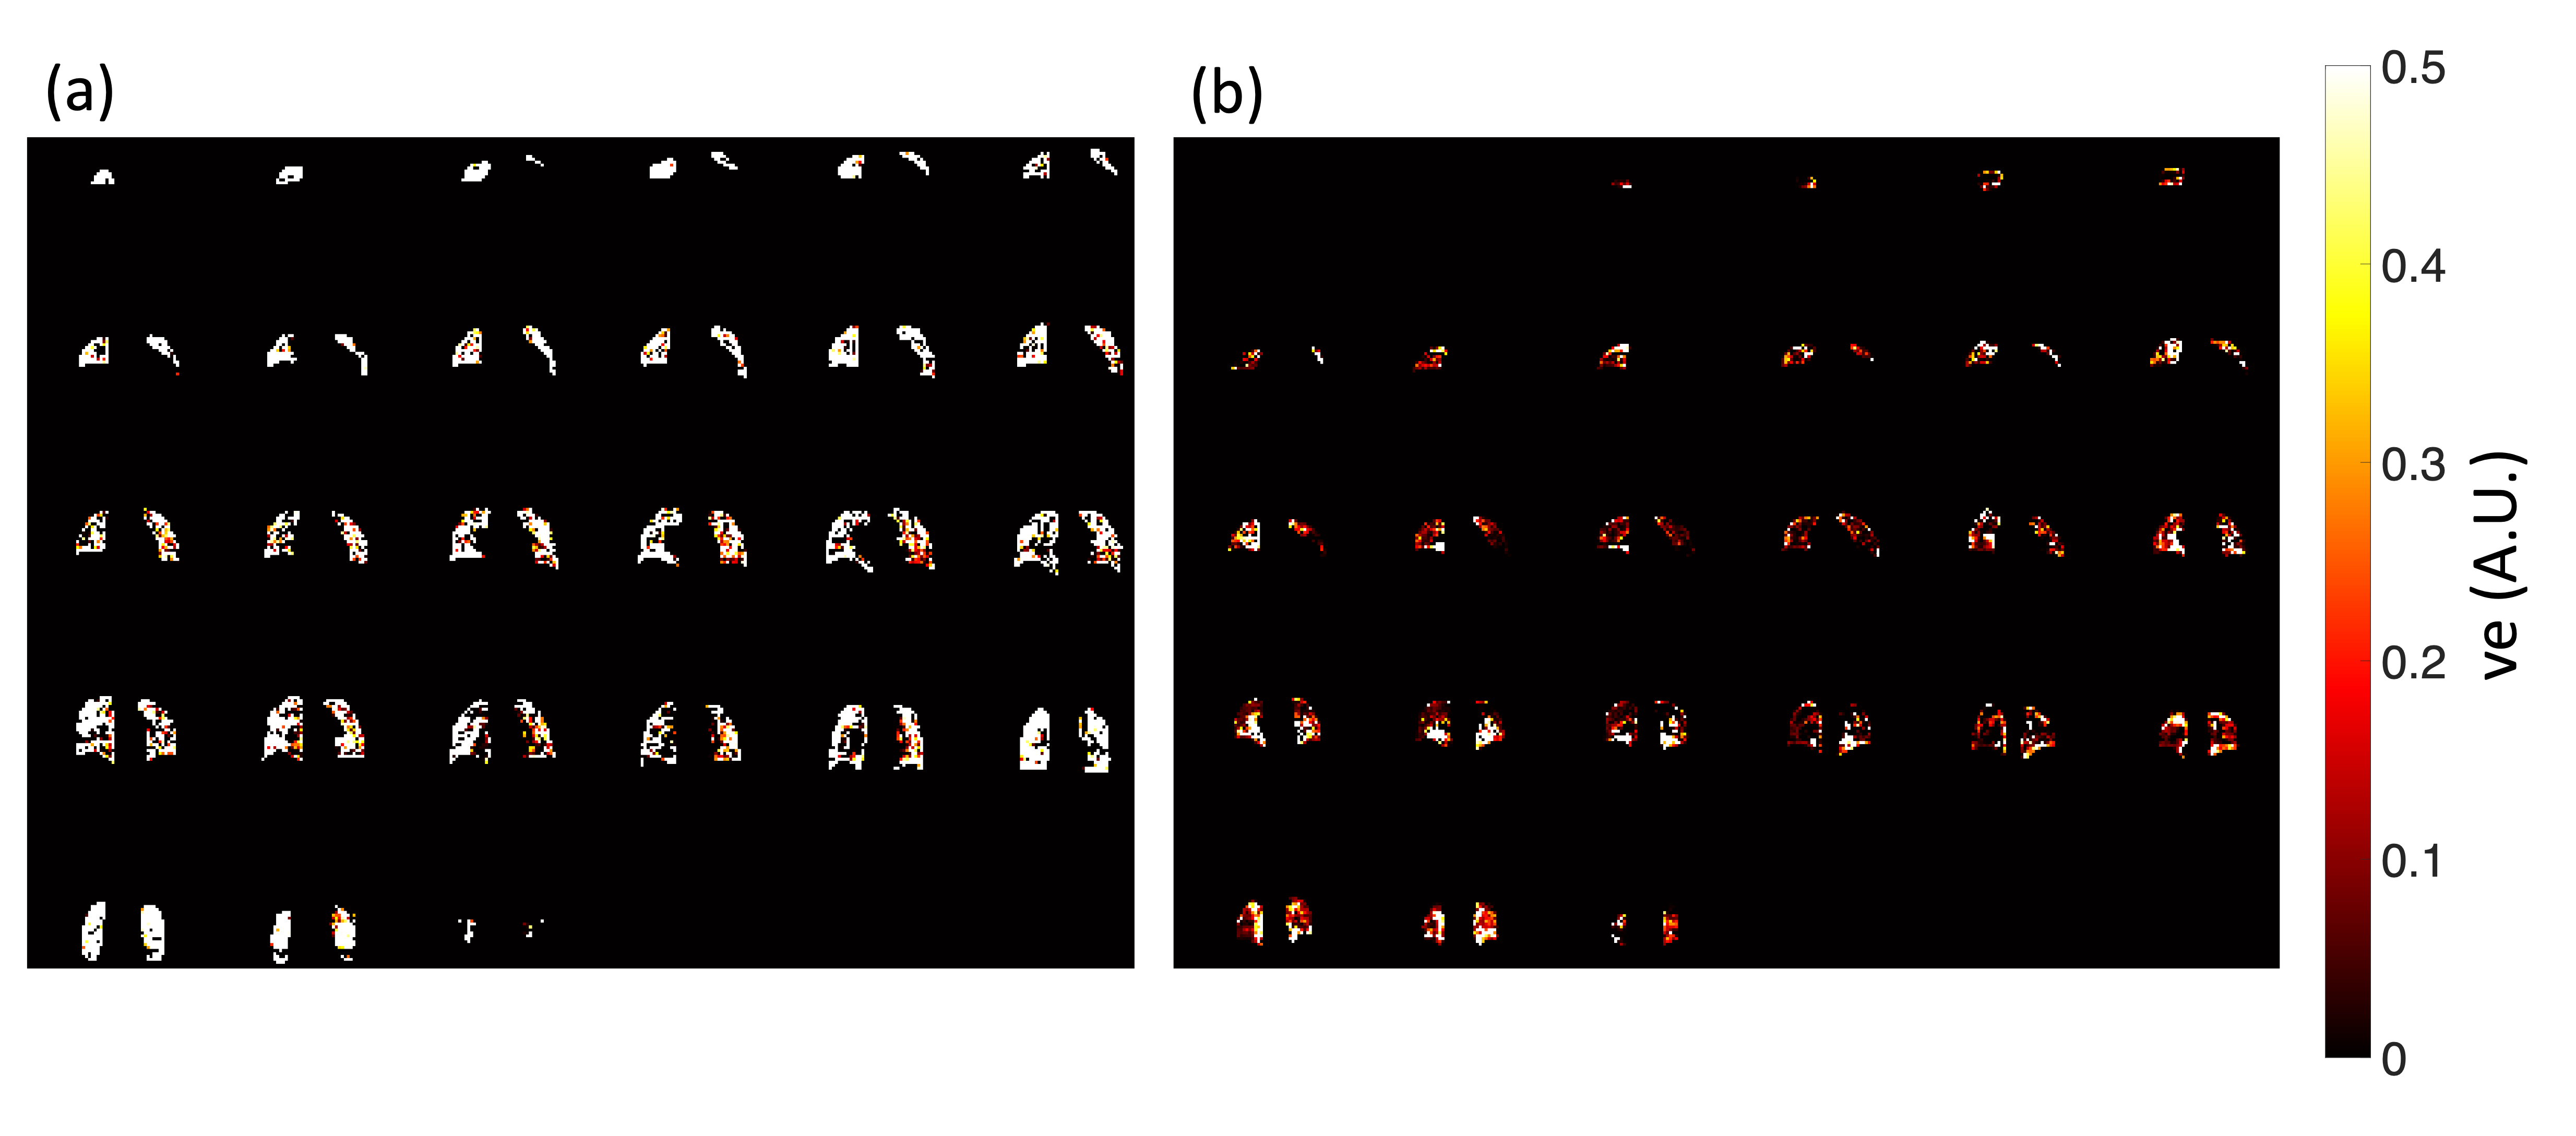
Data from 196 subjects were available for analysis with 161 datasets able to be segregated for leakage phase analysis using the method described in Figure 1. The 161 datasets included 95 males and 66 females with a median (IQR) age of 54 (17.3) years.Significant differences were seen between Ktrans (p<0.0001) and vp (p<0.0001) when using the two different fitting strategies (Figure 2) with no significant difference seen between the ve values (p=0.0533) when considering all 161 datasets. Several subjects had values of ve that were unreliable, with the whole lung being given similar values of ve as shown in Figure 3. Subjects who had >40% of the lung ≥0.8 were considered unuseable and this resulted in 40 subjects’ data being excluded from comparisons (36 from leakage-phase only and 4 from all timepoints). When excluding this data significant differences were seen between ve and vp (p<0.0001 for both) but not between Ktrans (p=0.0781) (Figure 4).
Discussion
Pulmonary perfusion imaging is becoming more common in research and has been used in the clinic for pulmonary hypertension for several years, with leakage-phase metrics proving useful in several other organs11, 13, 18-20. The acquisition of leakage-phase data is less explored given the additional image processing required to overcome respiratory motion, and the difficulty in synchronising multiple sites acquisition protocols.One limitation of this study is the relatively short period of acquisition when compared to standard leakage-phase imaging (usually ~5 minutes vs. 1 minute here) and this may be a source of error in the outcome metrics. This acquisition means that by discarding the data from the first-pass bolus in patients with low blood flow, there is limited data for the leakage-phase analysis. Therefore, utilising all data would be preferable, with future work focused on defining an alternative first-pass end point.
The lack of a baseline T1 map means the estimates of contrast agent concentration are not as accurate which may be a cause of the erroneous values seen. The image processing and analysis pipeline developed was successfully applied to 82% of the data available at the time of writing, showing it can be used for several sites data, however longer acquisitions should be explored.
In conclusion, an image processing pipeline was developed and employed on several datasets acquired from multiple centres with a high success rate. Utilising all data-points or a subset has a significant impact on metrics derived using the Extended Tofts model.
Acknowledgements
National Institute of Health Research (NIHR) (NIHR-RP-R3-12-027), the Medical Research Council (MR/M008894/1) and C-MORE/PHOSP-COVID (MR/V027859/1 and COV0319) for funding. BR is supported by BHF Oxford CRE (RE/18/3/34214). Radiographic and administration teams at all sites.References
1. L. A. Torres, et al., Eur. Respir. J., 2022.
2. N. D. Weatherley, et al., Thorax, 2021. 76(2): p. 144-151.
3. A. Ter-Karapetyan, et al., PLoS One, 2018. 13(12): p. e0208587.
4. X. Tao, et al., Sci. Rep., 2016. 6.
5. Y. Ohno, et al., J. Magn. Reson. Imaging, 2010. 31(5): p. 1081-1090.
6. Y. Ohno, et al., American Journal of Roentgenology, 2007. 188(1): p. 48-56.
7. C. S. Johns, et al., J. Magn. Reson. Imaging, 2017.
8. B. J. Jobst, et al., PLoS One, 2015. 10(3): p. e0121520.
9. S. Rajaram, et al., Thorax, 2013: p. thoraxjnl-2012-203020.
10. P. S. LaViolette, et al., J. Neurooncol., 2014. 116(3): p. 543-549.
11. J. Cheriyan, et al., J. Magn. Reson. Imaging, 2022.
12. Z. Li, et al., J. Magn. Reson. Imaging, 2016. 44(1): p. 98-104.
13. S. B. Montesi, et al., ERJ Open Research, 2021.
14. P. S. Tofts, et al., J. Magn. Reson. Imaging, 1999. 10(3): p. 223-232.
15. B. B. Avants, et al., Insight J, 2009.
16. P. A. Yushkevich, et al., Neuroimage, 2006. 31(3): p. 1116-1128.
17. S. R. Barnes, et al., BMC Med. Imaging, 2015. 15(1): p. 1-20.
18. R. W. Schafer, IEEE Signal processing magazine, 2011. 28(4): p. 111-117.
19. W.-J. Zhang, et al., Radiology, 2015. 278(3): p. 906-916.
20. J. H. Naish, et al., Magn. Reson. Med., 2009. 61(6): p. 1507-1514.
21. M. Vivoda Tomšič, et al., BMC Cancer, 2022. 22(1): p. 1-11.
Figures