1914
129Xe MRI Ventilation Predicts Longitudinal Quality-of-Life Improvement in Post-Acute COVID-19 Syndrome1Department of Medical Biophysics, Western University, London, ON, Canada, 2Robarts Research Institute, London, ON, Canada, 3Division of Respirology, Department of Medicine, Western University, London, ON, Canada
Synopsis
Keywords: Hyperpolarized MR (Gas), Lung
Post-acute COVID-19 syndrome (PACS) is an umbrella term for symptoms and poor quality-of-life, four weeks+ after acute COVID-19 infection, reported in up to 30% of COVID-19 survivors. The longitudinal trajectory of PACS remains largely unknown. 129Xe MRI ventilation defects did not help to explain longitudinal quality-of-life outcomes in PACS and thus, texture analysis was used to evaluate potential ventilation features that could explain quality-of-life. We identified the 129Xe MRI ventilation texture features that predicted clinically relevant quality-of-life improvements 15-months post-infection, outperforming clinical models. These findings also suggest that ventilation texture features capture underlying pathophysiology not reflected by ventilation-defect-percent.INTRODUCTION
Post-acute COVID-19 syndrome (PACS) is defined by persistent symptoms and poor quality-of-life four-weeks+ post-acute COVID-19 in ~6-30% of patients.1,2 The St. George’s Respiratory Questionnaire (SGRQ) score provides a measure of quality-of-life that accounts for symptoms, activity limitation, and impact,3 and was shown to be highly abnormal in patients with PACS.4 The SGRQ-score allows for the longitudinal monitoring of post-COVID symptoms on patient quality-of-life.Although the pathologies driving the pulmonary sequelae of COVID-19 remain poorly understood, previous work has postulated the presence of an airways disease phenotype in PACS2,5 or a pulmonary vascular phenotype defined by abnormal gas-exchange.6,7 Computed tomography (CT) imaging has provided the primary imaging approach for diagnosis and monitoring of COVID-19. Although the presence of air-trapping is used as an indirect measure of small airways disease, the small airways are not easily identified using chest CT.
Importantly, hyperpolarized 129Xe MRI provides a direct way to quantify inhaled gas distribution abnormalities,8 including ventilation heterogeneity that stems from airway luminal inflammation,9 airway obliteration,10 and occlusion.11 The binary classification of ventilation defects defined as ventilation-defect-percent (VDP) does not explain changes in PACS quality-of-life and so, we explored the role of 129Xe MRI texture features, which can be used to evaluate ventilation heterogeneity by extracting signal intensity differences in the ventilated regions. Previous work reported significantly different 129Xe MRI texture features between PACS participants and healthy controls.12 Thus, 129Xe MRI texture features may provide additional information, beyond ventilation defects, associated with the persistent sequelae in PACS. The objective of this study was to utilize machine-learning in combination with ventilation texture feature analysis to predict clinically relevant improvements in quality-of-life using 129Xe MRI.
METHODS
We evaluated 41 participants with persistent respiratory symptoms, who completed a baseline visit 3-months post-infection and a 12-month follow-up. All participants provided written informed consent to an approved protocol that included 129Xe MRI, pulmonary function testing, and quality-of-life questionnaires.4 SGRQ was self-administered under supervision.3Anatomical 1H and hyperpolarized 129Xe MRI were acquired using a 3T Discovery MR750 (General Electric Health Care, WI, USA) with broadband capability as previously described.13,14 Anatomical 1H images were acquired using a fast-spoiled gradient-recalled echo (FGRE) sequence (total acquisition time, 8 seconds; TR msec/TE msec, 4.7/1.2; flip angle, 30°; field of view, 40×40 cm2; bandwidth, 24.4 kHz; 128×80 matrix, zero padded to 128×128; partial echo percentage, 62.5%; 15-17 slices; slice thickness, 15 mm; no gap). Static ventilation images were acquired using a three-dimensional FGRE sequence (total acquisition time, 14 s; TR msec/TE msec, 6.7/1.5; variable flip angle; field of view, 40×40 cm2; bandwidth, 15.63 kHz; 128×128 matrix, zero padded to 128×128; 14 slices; slice thickness, 15 mm; no gap). Participants were instructed to inhale and hold 1.0 L of gas (100% N2 for anatomical scan and 400 mL hyperpolarized 129Xe mixed with 600 mL 4He for hyperpolarized scan) to ensure volume matched images.
Participants were dichotomized by whether they experienced a change greater than the minimal-clinically-important-difference (MCID) in SGRQ-score (≥4 points)15 15-months post-infection. Texture features were extracted from the 3-dimensional application of gray-level run-length, gap-length, zone-size, dependence, gray-tone difference, and co-occurrence-matrices via PyRadiomics platform.16 Feature selection was performed using Boruta analysis via a random forests classifier to identify MRI features that contributed to the machine-learning model’s accuracy. Classification Learner application (MATLAB R2020a) was used to test single and ensemble models. Model performance was evaluated using area under the receiver-operator-curve (AUC), as well as accuracy, sensitivity, and specificity metrics.
RESULTS
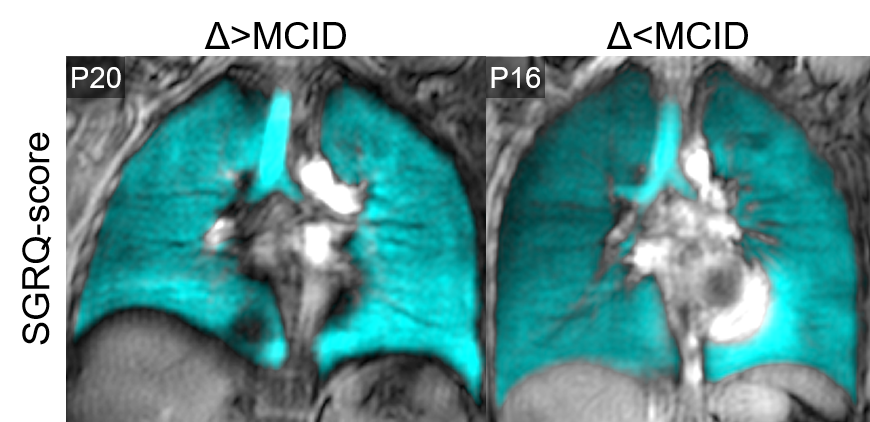
Table 1 provides demographic and imaging characteristics for PACS participants, where 68% experienced a change >MCID in SGRQ-score. Figure 1 shows 129Xe MRI for representative participants in each group, where ventilation is qualitatively similar. Table 2 provides a summary of the best model performances for predicting improvement in SGRQ-score≥4 points, where a weighted K-nearest neighbours (KNN) model exclusively trained on MRI texture features was the best performer (AUC=0.91) and outperformed models trained on clinical measures (AUC=0.75). Figure 2 shows that, of the features in the MRI-model, ΔSGRQ significantly related to original shape maximum 3D diameter (ρ=.39, p=.02) and minor axis length (ρ=.47, p=.005).DISCUSSION
Using machine learning methods, we identified 129Xe MRI texture features that predicted 1-year quality-of-life improvement in participants with PACS. Models consisting of MRI texture features outperformed clinical models, where the KNN MRI-model using a weighted-neighbours approach outperformed complex ensemble models. In addition, the change in SGRQ correlated with maximum 3D diameter and minor axis length, which informed on the overall shape and size of the ventilation patchiness and distribution. The texture features in the MRI-model also informed on fine textures that contribute to ventilation heterogeneity which may be intuitively understood as fine “patchiness”. Thus, MRI texture features provided information about ventilation beyond the binary classification of ventilated versus non-ventilated regions quantified using VDP. The evaluation of signal intensity differences and spatial pixel locations exploited by texture features help predict longitudinal quality-of-life improvements in PACS.CONCLUSION
129Xe MRI ventilation texture feature extraction, enabled using machine-learning, provided a method to predict which PACS participants would experience clinically relevant 1-year quality-of-life improvements. 129Xe MRI ventilation texture analysis may reveal underlying small airway pathophysiology contributing to quality-of-life in PACS.Acknowledgements
No acknowledgement found.References
1 Nalbandian, A. et al. Nat Med (2021).
2 Global Burden of Disease Long COVID Collaborators JAMA (2022).
3 Jones, P.W. et al. Am Rev Respir Dis (1992).
4 Kooner, H.K. & McIntosh M.J. et al. BMJ Open Respir Res (2022).
5 Cho, J.L. et al. Radiology (2022).
6 Matheson, A.M. et al. Radiology (2022).
7 Grist, J.T. et al. Radiology (2022).
8 Kirby, M. et al. Acad Radiol (2012).
9 Svenningsen, S. et al. Am J Respir Crit Care Med (2018).
10 Svenningsen, S. et al. Thorax (2014).
11 Svenningsen, S. et al. Chest (2019).
12 Kooner, H.K. et al. ISMRM (2021).
13 Parraga, G. et al. Invest Radiol (2007).
14 Svenningsen, S. et al. J Magn Reson Imaging (2013).
15 Jones, P.W. COPD (2005).
16 Van Griethuysen, J.J. et al. Cancer Res (2017).
Figures