1913
Investigating the effects of Long COVID on cerebrovascular reactivity using VASO at 3T1Biomedical Sciences, University of York, York, United Kingdom, 2York Neuroimaging Centre, University of York, York, United Kingdom, 3Psychology, University of York, York, United Kingdom, 4School of Physics, Engineering, and Technology, University of York, York, United Kingdom, 5Medical and Biological Engineering, University of Leeds, Leeds, United Kingdom, 6Hull York Medical School, University of York, York, United Kingdom, 7School of Medicine, University of Leeds, Leeds, United Kingdom, 8Institute of Sport, Manchester Metropolitan University, Manchester, United Kingdom
Synopsis
Keywords: Blood vessels, COVID-19, cerebrovascular reactivity
Strategies to help sufferers from Long COVID (LC) mostly focus on symptoms management. There is an urgent need for understanding whether and how the cerebrovascular system is implicated in emergent symptoms. Here we use advanced cerebral blood volume (CBV)-based imaging techniques to appropriately quantify changes in vascular reactivity in patients affected by LC compared to healthy volunteers. A slower vasodilation mechanisms, leading to inappropriate oxygen supply during neuronal function, could be used as biomarker and help clinical diagnosis.Introduction
Long COVID (LC) is a highly debilitating condition following infection following COVID-19. It is reported to affect more than 1.7 million people in the UK alone1. LC symptoms encompass fatigue, headaches, chronic weakness, and 'brain fog' lasting for more than 2 months2. Research into COVID-19 pneumonia has shown extensive micro- and macro-thrombosis at the level of pulmonary capillary, venous, and arteriolar systems3-5. Clot debris at this level can lead to neurological pathologies such as strokes. Brain post-mortem analysis in COVID-19 sufferer show diffuse cerebral organic brain tissue disease6. Understanding the mechanisms linking these pieces of evidence is of the utmost importance to shape personalised preventive and therapeutic strategies. In this study, we use multimodal functional imaging to assess how thrombotic complication may impair cerebrovascular reactivity. While BOLD methods of assessing cerebral haemodynamic reflect complex interplay between blood oxygenation, blood volume, and other physiological parameters, rendering quantifiability and interpretability of the signal difficult, novel VASO fMRI technique provides measurements of Cerebral Blood Volume changes. These are spatially localised to cerebral microvasculature and more robust to changes in underlying physiology. We hypothesise that the resultant inadequate oxygen supply to the brain caused by the disrupted haemodynamics may account for the widely reported fatigue and mental fog, and act as a unique biomarker of organic brain disease for improved clinical diagnosis.Methods
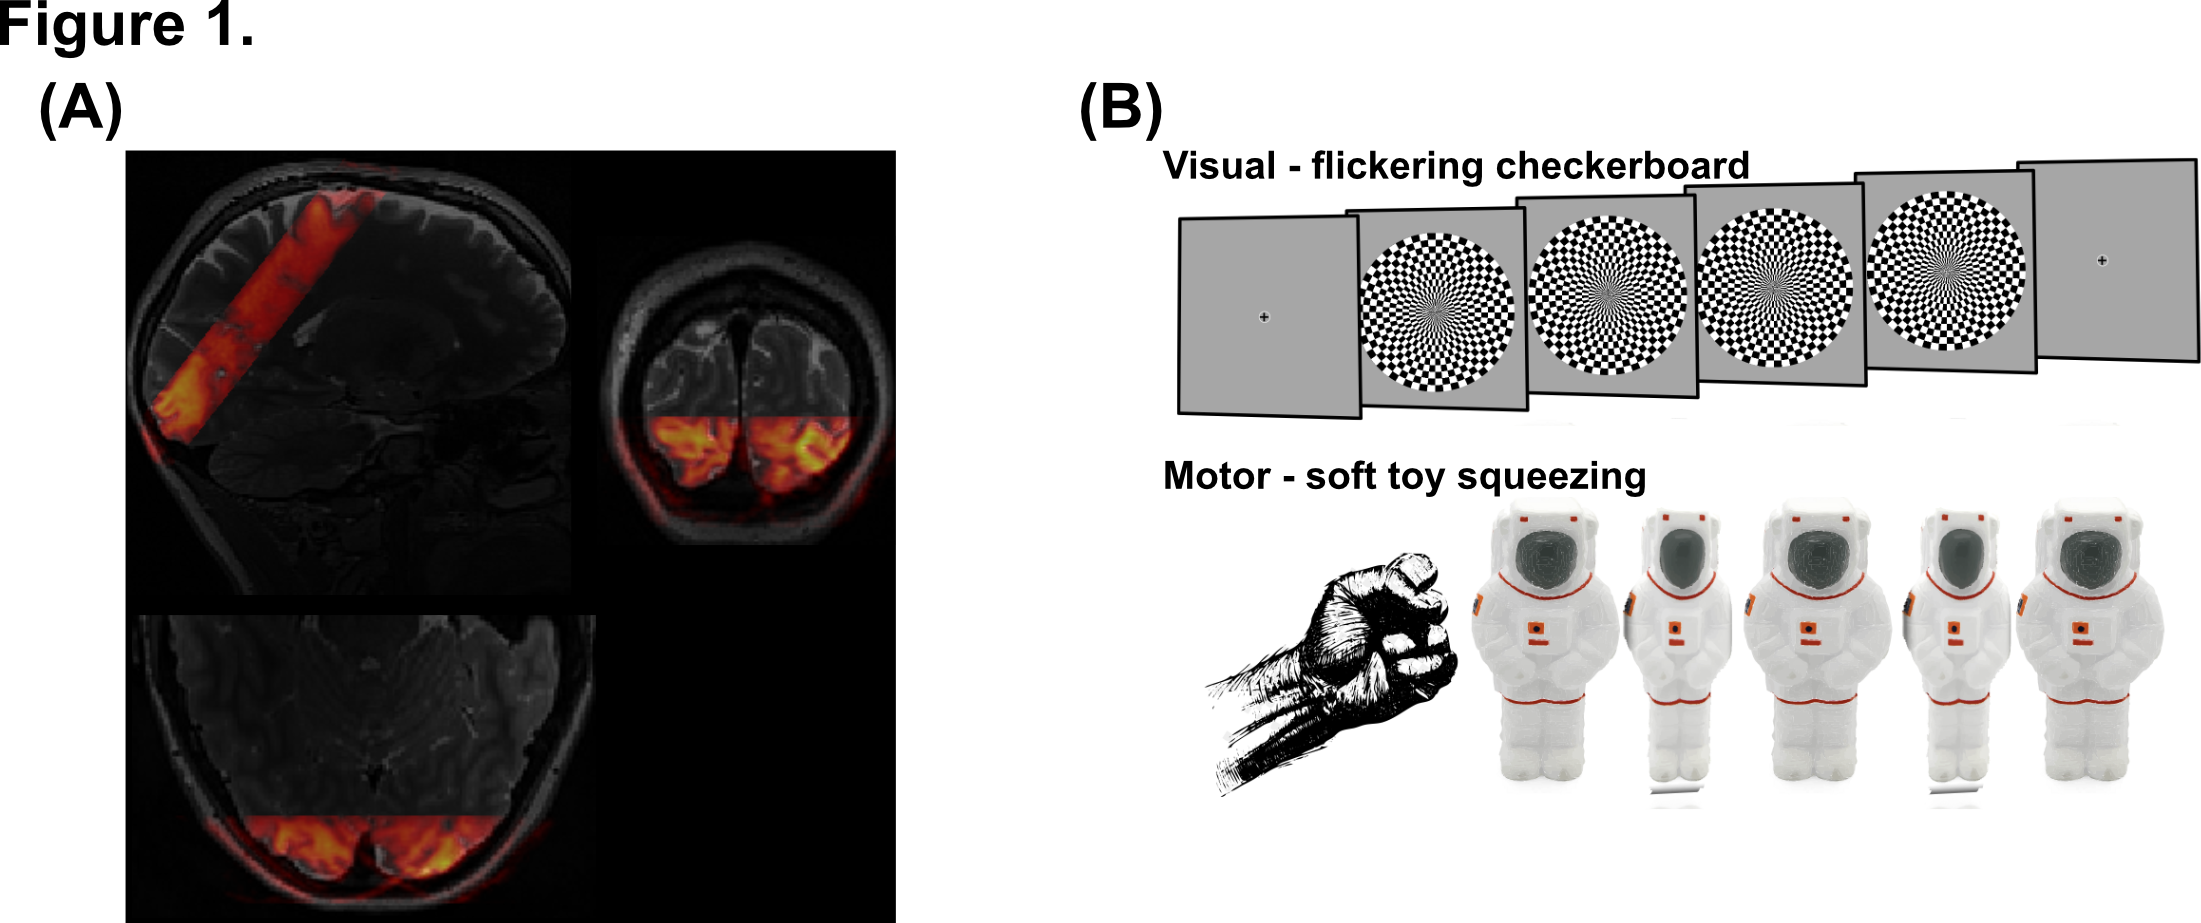
Data acquisition: Imaging data was acquired on a Siemens MAGNETOM Prisma 3T scanner using a 32 channel RX head coil at the York Neuroimaging Centre (York, UK). Functional scans consisted of one GE-EPI, whole brain acquisition (nominal resolution 2.5mm isotropic, 52 slices, TR/TE=1000/30ms, pF=7/8, flip angle=75º, Multi-Band factor=4, bandwidth=1786Hz/Px, FoV=200mm), and between one and three 3D-EPI based VASO acquisition optimised for the use at clinical field strength7 (nominal resolution 1.2mm isotropic, 20 slices, TI1/TI2/TR/TE=1145/2115/2610/17.2ms, pF=6/8 with POCS#8, flip angle=30º, FLASH GRAPPA 3, bandwidth=1008Hz/Px, FoV=190mm). Slice position and orientation for VASO were optimised to cover early visual and primary motor cortex (Figure 1A). A high-resolution (0.8mm isotropic) T1-weighted structural image was acquired using standard MP2RAGE.Paradigm: A single run of GE-EPI / VASO functional scan lasted ~13min. A block design was implemented in the study as follows: ~60s of initial fixation, followed by on-blocks of ~16s with a 8Hz flickering checkerboard, and subsequent ~54s off-blocks, repeated 10 times. The longer off-block timing is essential to capture the full haemodynamic, essential in investigating changes in cerebrovascular reactivity. Throughout the session, participants were: (1) required to maintain fixation at the centre of the screen; (2) squeezing a soft toy with their dominant hand.
Data analysis: GE-EPI data was analysed using FSL FEAT (preprocessing and GLM analysis at the first level). VASO data were split into CBV and BOLD, motion corrected using SPM12, BOLD contamination correction was performed using LAYNII8, and custom Matlab scripts were used for GLM analysis and timecourse analysis.
Results & Discussion
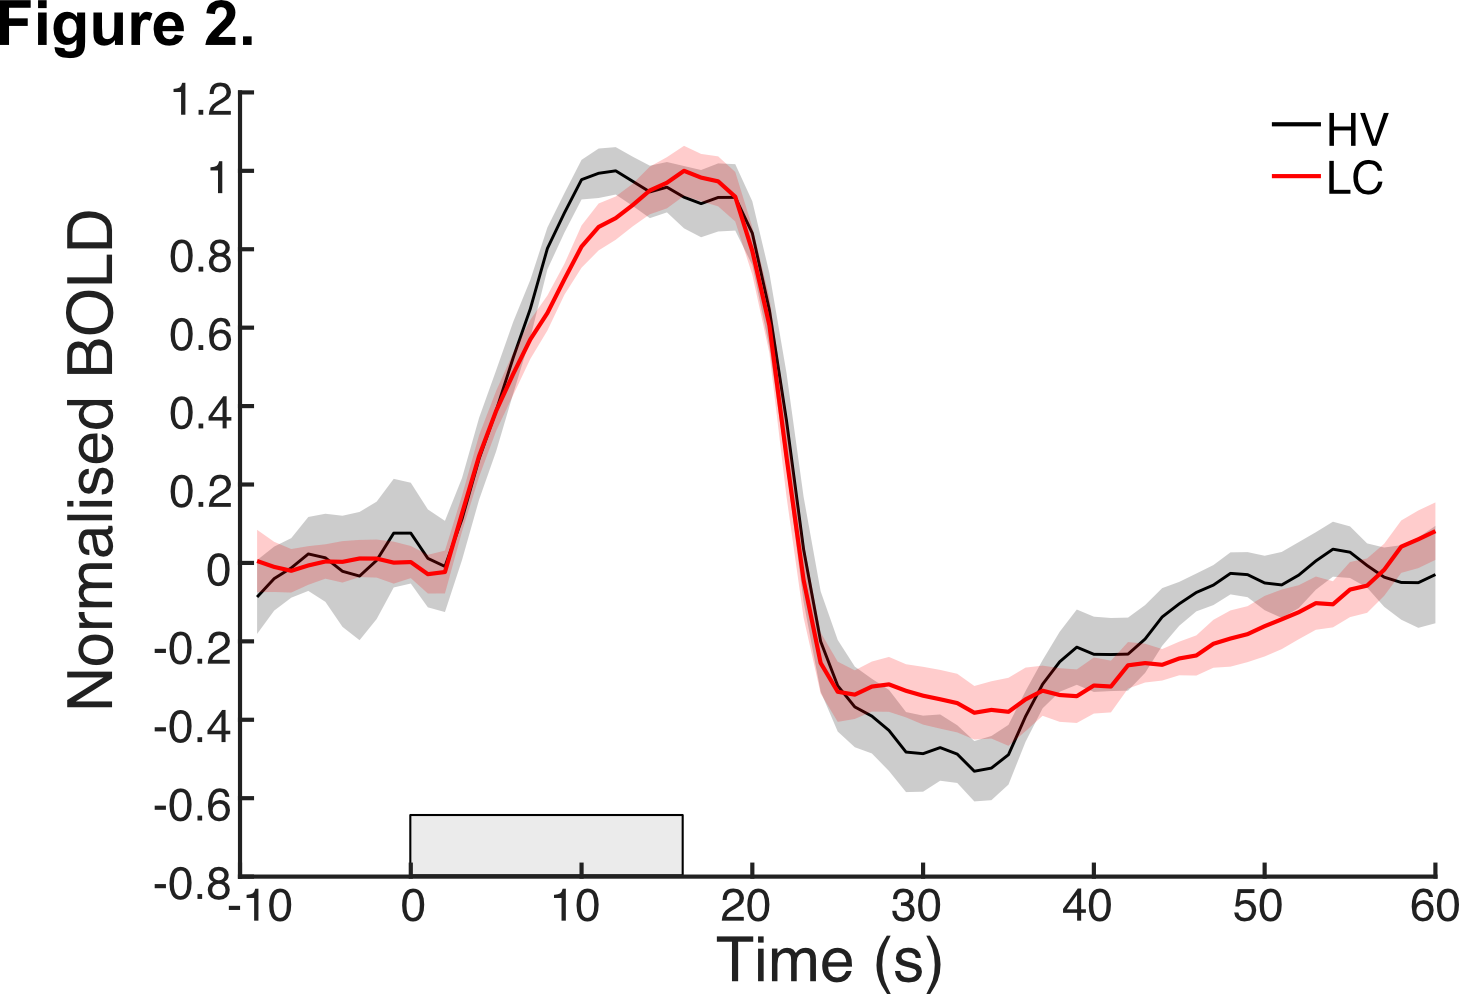
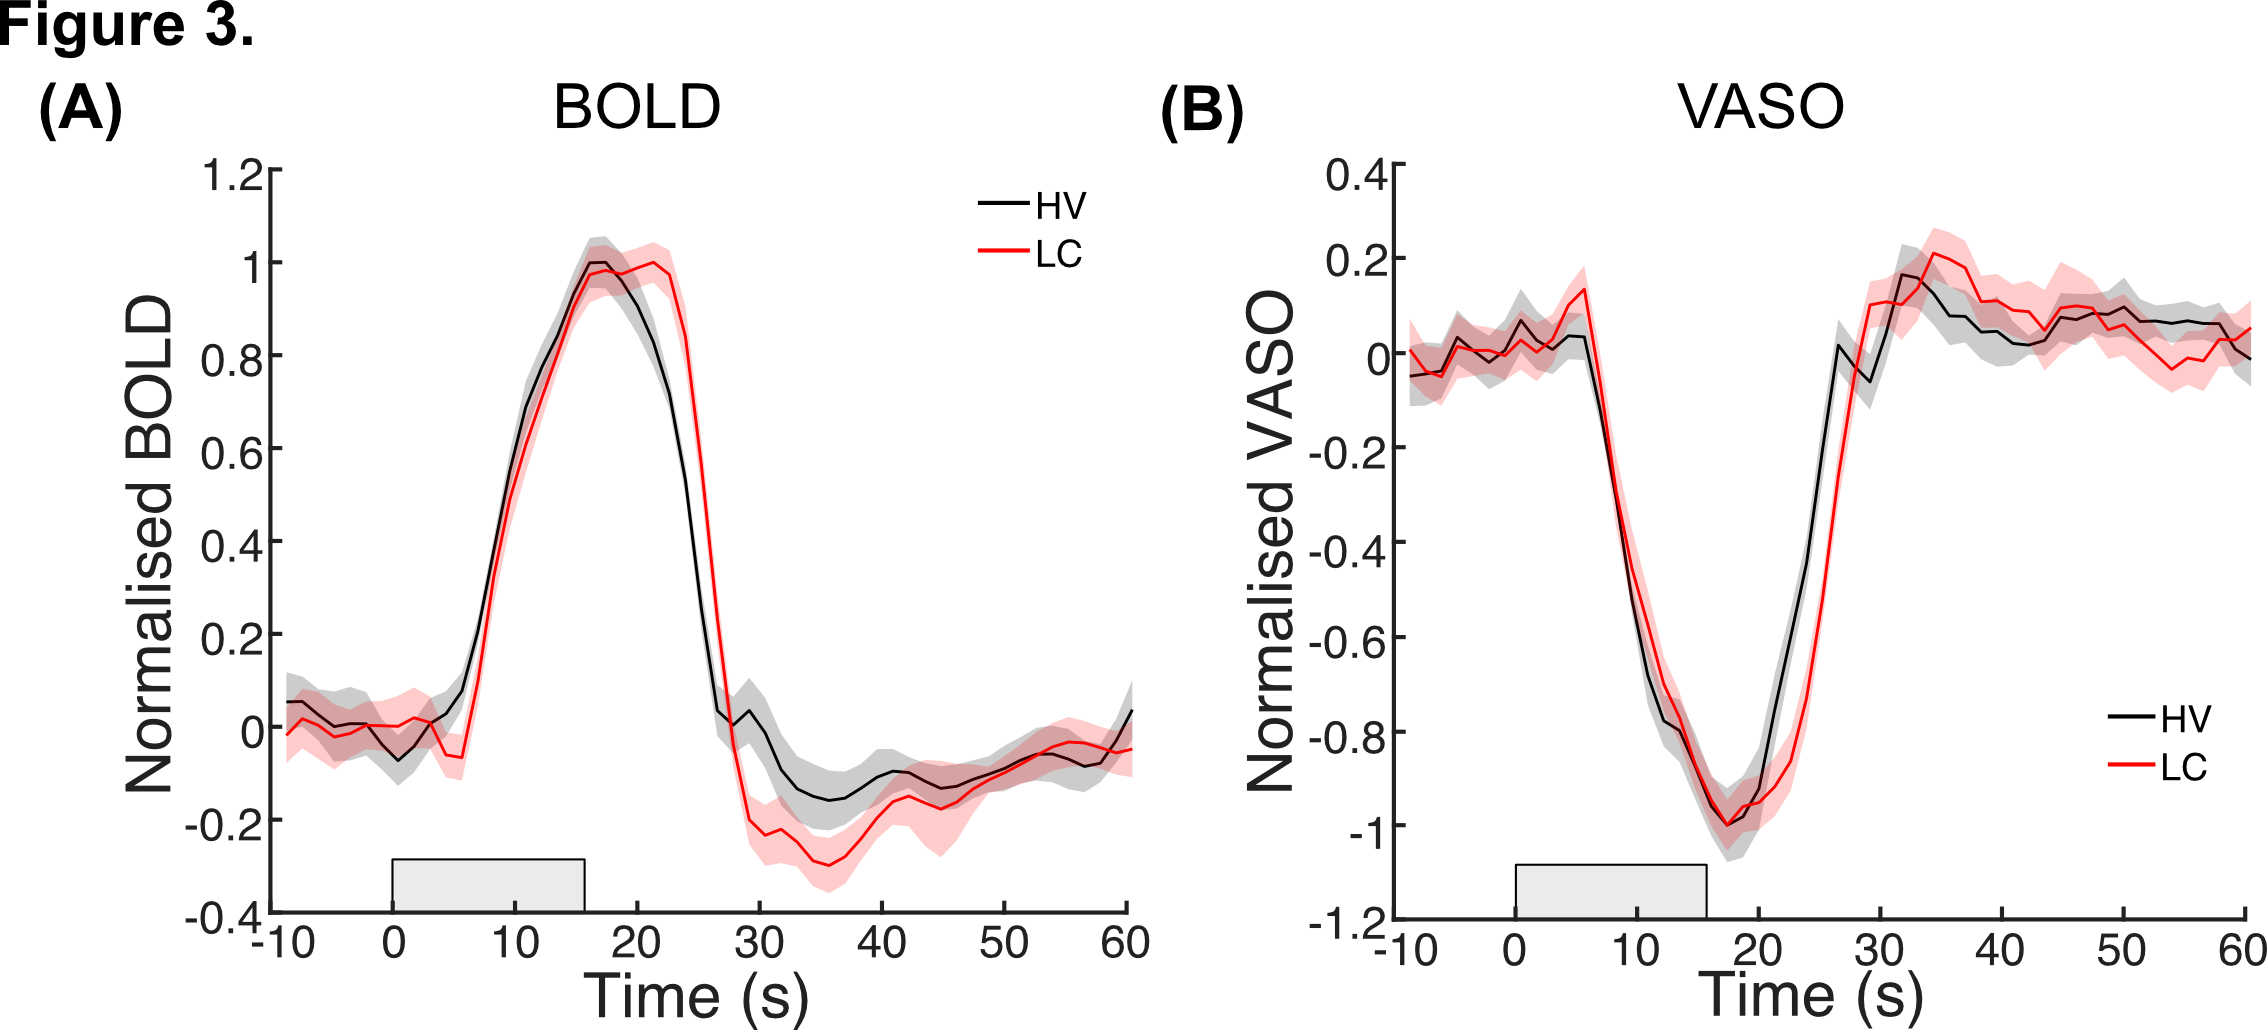
fMRI data from the GE-EPI acquisition show subtle differences in the haemodynamic response to the flickering checkerboard (Figure 2), with slower time to reach peak response in LC compared to healthy volunteers (HV) and prolonged post stimulus dynamics in recovering back to baseline. These features suggest slower vascular reactivity, delay in vasodilation in response to blood supply demand, in LC sufferers, which could underlie symptoms of organic brain disease. The results are further confirmed in data from VASO acquisition. The BOLD signal in response to 16s of flickering checkerboard shows delayed peak response for LC compared to HV participants, alongside a sustained post stimulus undershoot (Figure 3A). On the other hand, VASO data shows reduced signal from extravascular space in LC compared to HV (Fig 3B), again supporting the hypothesis that elasticity of vessels in LC are impaired, leading to a deficit in oxygen supply in response to neuronal activity. We explore differences in spatial mapping of brain activity for both positive and negative BOLD. We also investigate vascular reactivity with simple breath holding experiments. Data are supported with clinical blood markers for Long COVID.Conclusion & Summary
Here we investigate the effects of Long COVID on cerebrovascular reactivity using BOLD and CBV (based on VASO) measurements at 3T, using robust sensory stimulation in the visual and motor cortex. Firstly, analysis of BOLD timeseries show changes in onset and offset dynamics of the haemodynamic response, with a delayed time-to-peak and prolonged post stimulus undershoot for LC sufferers. This supports our hypothesis that LC affects vasculature reactivity. Importantly, these findings are corroborated when obtaining more quantitative measurements of cerebral blood volume using VASO acquisition. Here, a reduced signal from extravascular space suggests a decreased reactivity (vasodilation) of the microvasculature involved in supplying oxygen to the surrounding tissue during neuronal activity. In the future, combining this data with diffusion-weighted imaging to quantify biophysical changes associated with neuronal reactivity will help better characterise the effects that this debilitating condition has on the micro and macro vasculature of the brain and how these relate to experienced symptoms.Acknowledgements
No acknowledgement found.References
1. Ayoubkhani D, Pawelek P. Prevalence of ongoing symptoms following coronavirus (COVID-19) infection in the UK: 7 April 2022 [Internet]
2. World Health Organisation (WHO). A clinical case definition of post COVID-19 condition by a Delphi consensus [Internet]. 2021
3. Lax SF, Skok K, Zechner P, et al. Pulmonary Arterial Thrombosis in COVID-19 With Fatal Outcome: Results from a Prospective, Single-Center, Clinicopathologic Case Series. Ann Intern Med. 2020;173(5):350-61
4. Thachil J, Srivastava A. SARS-2 Coronavirus-Associated Hemostatic Lung Abnormality in COVID-19: Is It Pulmonary Thrombosis or Pulmonary Embolism? Semin Thromb Hemost. 2020;46(7):777-80
5. Fox SE, Akmatbekov A, Harbert JL, et al. Pulmonary and cardiac pathology in African American patients with COVID-19: an autopsy series from New Orleans. Lancet Respir Med. 2020;8(7):681-6
6. Matscheke J, Lütgehetmann M, Hagel C, et al. Neuropathology of patients with COVID-19 in Germany: a post-mortem case series. Lancet Neurol. 2020;19(11):919-29
7. Stirnberg R, & Stöcker T. Segmented K-Space Blipped-Controlled Aliasing in Parallel Imaging (Skipped-CAIPI) for High Spatiotemporal Resolution Echo Planar Imaging. Magn Reson Med., 2020; 85(0):1540-1551
8. Huber L, Poser BA, Bandettini PA, et al. (2021). LayNii: A software suite for layer-fMRI. NeuroImage, 237:118091
Figures