1912
Quantitative pulmonary perfusion in patients with COVID-19 using dynamic contrast enhanced MRI at 0.55T1National Heart, Lung, and Blood Insitute, National Institutes of Health, Bethesda, MD, United States, 2Critical Care Medicine Department, Clinical Center, National Institutes of Health, Bethesda, MD, United States, 3National Institute of Allergy and Infection Diseases, National Institutes of Health, Bethesda, MD, United States
Synopsis
Keywords: Lung, COVID-19
COVID-19 infection has been reported to cause pulmonary perfusion defects associated with pulmonary embolism and infiltrates. We used quantitative dynamic contrast enhanced 0.55T MRI, with pharmacokinetic modelling, to monitor lung perfusion longitudinally in 139 patients with COVID-19. We observed significant associations between disease severity and perfusion during the convalescent phase (91-365d post symptom onset); and between abnormal perfusion during the acute phase (0-40d) and low pulmonary function later during recovery. Quantitative pulmonary perfusion measured by MRI may be a useful metric to study patients with COVID-19 infection, and early results suggest long-term perfusion abnormalities in patients with severe disease.Introduction
COVID-19 infection has been reported to cause pulmonary perfusion defects associated with pulmonary embolism and infiltrates. Perfusion has been qualitatively assessed by nuclear scintigraphy, MRI, and dual-energy CT in patients with COVID-19 (1-3). MRI studies have included hyperpolarized Xenon imaging to investigate the dissolved gas phase(4), PREFUL non-contrast ventilation-perfusion imaging(5), and dynamic contrast enhanced imaging measuring time-to-peak in the lung as a marker of perfusion resistance (6).Quantitative perfusion measured in ml/g/min, as assessed by dynamic contrast enhanced (DCE) MRI and pharmacokinetic modeling, has not been thoroughly characterized. Here, we used quantitative DCE MRI in a large cohort of patients with COVID-19 to monitor lung perfusion longitudinally.
Methods
Patients provided written informed consent for research MRI. We used a contemporary 0.55T MRI system (prototype MAGNETOM Aera, Siemens Healthcare, Erlangen, Germany) for imaging, which offers high-quality pulmonary images (7). DCE imaging used a dynamic 3D Cartesian gradient echo acquisition with a frame rate of 1.5s/volume (breath held, resolution = 3.75x3.75x20mm3, TE/TR = 0.76/2.5ms, FA = 31°). Gadolinium contrast was injected (2ml at 4ml/s) to image the first pass of contrast through the pulmonary tissue, and tissue perfusion was calculated using the two-compartment exchange model with the main-pulmonary artery used for the arterial input function. Perfusion modelling was performed using the open-source ROCKETSHIP software package (8).We performed 139 DCE imaging exams between June 2020 and Oct 2022; 32 patients were imaged in the acute phase (1-40d after symptom onset), 50 patients were imaged in the recovery phase (41-90d), and 57 patients were imaged in convalescent phase (91d-365d). Patients were grouped by their disease severity, based on the NIAID ordinal scale (1-2 non-hospitalized, 4 – hospitalized, 5- supplemental oxygen, 6 – high-flow oxygen).
One hundred eleven (111) patients also underwent pulmonary function testing at least once during the study period. The diffusing capacity for carbon monoxide (DLCO) and the forced expiration volume in 1 second (FEV1), measured as percent predicted, were compared to quantitative pulmonary perfusion.
Additionally, 7 healthy volunteers were imaged with the identical DCE protocol and processing. For the purposes of group-wise analysis, “normal” perfusion was defined as mean ± 1 standard deviation of global perfusion in healthy volunteers (5.7±1.9 ml/g/min used here).
Results
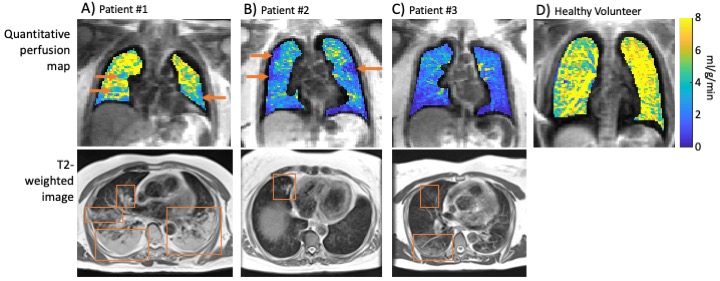
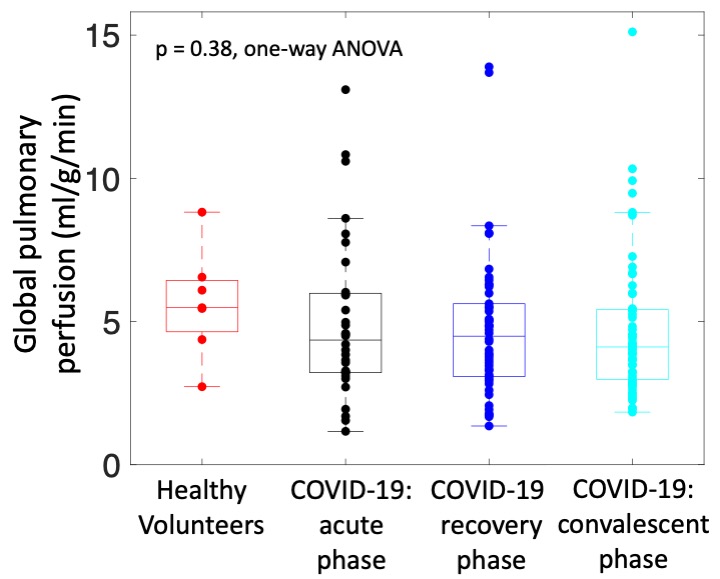
Figure 1 provides example quantitative perfusion maps and T2-weighted MRI in three example patients and a healthy volunteer. We observed several “abnormal” perfusion patterns: patients with global perfusion that was outside of the range of normal (either higher or lower), patients with visible perfusion defects, and patients with apparent hypoxic vasoconstriction.There was no significant difference in mean global perfusion between imaging timepoints in patients following COVID-19 and healthy volunteers (Figure 2, healthy volunteers: 5.7±1.9 ml/g/min; acute phase: 5.0±2.8 ml/g/min; recovery phase: 4.7±2.6 ml/g/min; convalescent phase: 4.7±2.5 ml/g/min; p = 0.38, one-way ANOVA).
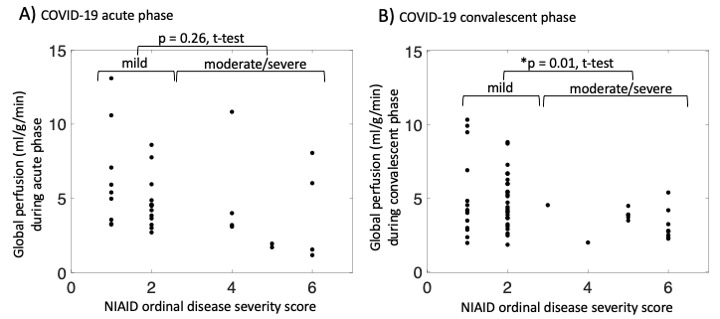
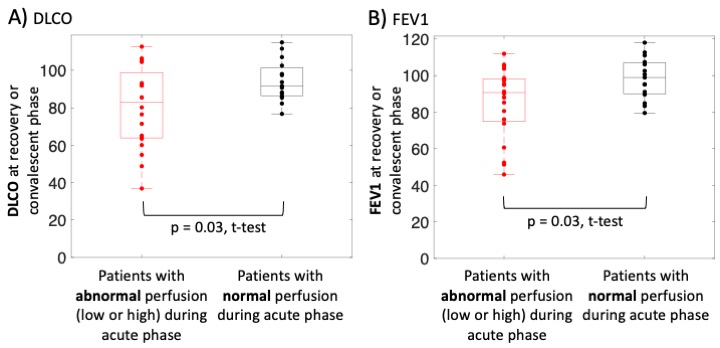
In the acute phase, there was no significant difference in global perfusion between patients with mild disease (severity scores 1-2) and those with moderate-severe disease (severity score 4-6) (Figure 3A, p = 0.26, t-test). However, in the convalescent phase, there was a significant difference between these two groups (Figure 3B, p = 0.01, t-test). Furthermore, patients who exhibited “abnormal” perfusion during the acute phase (either low or high compared to healthy volunteers) exhibited significantly lower pulmonary function (Figure 4; FEV1: p = 0.03, t-test; DLCO: p = 0.03, t-test) during the recovery or convalescent phase.
Discussion and Conclusion
Quantitative pulmonary perfusion measured by MRI may be a useful metric to study patients with COVID-19 infection. Early results suggest that there are long-term perfusion abnormalities in patients with severe disease, and that patients with abnormal perfusion in the acute phase develop reduced pulmonary function in the long-term. Future work will assess regional perfusion from 3D quantitative perfusion maps, and additional correlation with clinical data.Acknowledgements
This work was supported by the NHLBI DIR (Z01-HL006257). We would like to acknowledge the assistance of Siemens Healthcare in the modification of the MRI system for operation at 0.55T under an existing cooperative research agreement between NHLBI and Siemens Healthcare.References
1. Le Berre A, Boeken T, Caramella C, Afonso D, Nhy C, Saccenti L, Tardivel AM, Gerber S, Frison Roche A, Emmerich J, Marini V, Zins M, Toledano S. Dual-energy CT angiography reveals high prevalence of perfusion defects unrelated to pulmonary embolism in COVID-19 lesions. Insights Imaging 2021;12(1):24.
2. Heiss R, Grodzki DM, Horger W, Uder M, Nagel AM, Bickelhaupt S. High-performance low field MRI enables visualization of persistent pulmonary damage after COVID-19. Magn Reson Imaging 2020;76:49-51.
3. Lavely WC, Patel VK. Ventilation-Perfusion Scans After the COVID-19 Pandemic: Counterpoint-Ventilation Studies Are Here to Stay. AJR Am J Roentgenol 2022;218(1):31-32.
4. Grist JT, Collier GJ, Walters H, Kim M, Chen M, Abu Eid G, Laws A, Matthews V, Jacob K, Cross S, Eves A, Durant M, McIntyre A, Thompson R, Schulte RF, Raman B, Robbins PA, Wild JM, Fraser E, Gleeson F. Lung Abnormalities Depicted with Hyperpolarized Xenon MRI in Patients with Long COVID. Radiology 2022:220069.
5. Levy S, Heiss R, Grimm R, Grodzki D, Hadler D, Voskrebenzev A, Vogel-Claussen J, Fuchs F, Strauss R, Achenbach S, Hinsen M, Klett D, Schmid J, Kremer AE, Uder M, Nagel AM, Bickelhaupt S. Free-Breathing Low-Field MRI of the Lungs Detects Functional Alterations Associated With Persistent Symptoms After COVID-19 Infection. Invest Radiol 2022;57(11):742-751.
6. Yu JZ, Granberg T, Shams R, Petersson S, Skold M, Nyren S, Lundberg J. Lung perfusion disturbances in nonhospitalized post-COVID with dyspnea-A magnetic resonance imaging feasibility study. J Intern Med 2022.
7. Campbell-Washburn AE, Ramasawmy R, Restivo MC, Bhattacharya I, Basar B, Herzka DA, Hansen MS, Rogers T, Bandettini WP, McGuirt DR, Mancini C, Grodzki D, Schneider R, Majeed W, Bhat H, Xue H, Moss J, Malayeri AA, Jones EC, Koretsky AP, Kellman P, Chen MY, Lederman RJ, Balaban RS. Opportunities in Interventional and Diagnostic Imaging by Using High-performance Low-Field-Strength MRI. Radiology 2019:190452.
8. Barnes SR, Ng TS, Santa-Maria N, Montagne A, Zlokovic BV, Jacobs RE. ROCKETSHIP: a flexible and modular software tool for the planning, processing and analysis of dynamic MRI studies. BMC Med Imaging 2015;15:19.
Figures