1911
Evident Cerebral Perfusion Recovery in COVID-19 Patients: Results Based on Arterial Spin Labeling MRI1Department of Medical Imaging, Henan Provincial People’s Hospital & Zhengzhou University People’s Hospital, Zhengzhou, China, 2Henan Key Laboratory of Neurological Imaging, Zhengzhou, China, 3MR Collaboration, Siemens Healthcare Ltd, Beijing, China
Synopsis
Keywords: Neuroinflammation, COVID-19, perfusion,follow up
COVID-19 may affect the brain of patients, ranging in severity from confusion to life-threatening strokes. This study investigated the potential cerebral perfusion change in COVID-19- infected patients using pseudo-continuous arterial spin labeling (pCASL) sequence by follow up after patients recovered for 4, 12 and 18 months. It’s found that both cerebral blood flow (CBF) and bolus arrival time (BAT) values derived from pCASL demonstrated an increasing tendency over time in several brain areas in COVID-19 survivors after whole brain analysis. Our findings indicated that COVID-19 survivors may experience compensatory brain function recovery and this recovery process would be slow.Introduction
Coronavirus Disease 2019 (COVID-19), caused by severe acute respiratory syndrome coronavirus 2 (SARS-CoV-2) has been widely distributed worldwide since 2019. It was confirmed that SARS-CoV-2 could invade central nervous system (CNS) through the ACE2 in brain 1. Neurological damage may persist in recovered patients 2-3. The brain perfusion abnormality has been reported in COVID-19 patients by arterial spin labeling (ASL) perfusion MRI in acute stage and 3 months follow-up 4,5. However, how does the brain perfusion change in patients recovering from COVID-19 remains undiscovered. Multi-delay pseudo-continuous ASL (pCASL) sequence could provide multiple quantitative parameters such as cerebral blood flow (CBF) and bolus arrival time (BAT) to assess the cerebral perfusion. The purpose of this study was to investigate the potential cerebral perfusion change in recovered COVID-19 patients using multi-delay pCASL imaging by a long-time follow-up.Methods
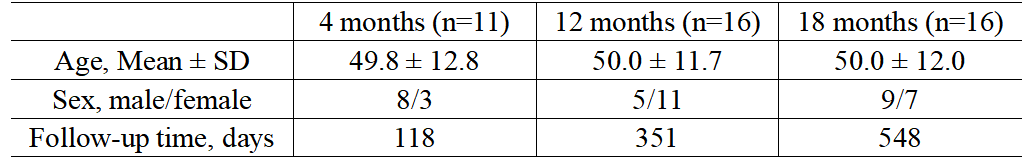
Data Collection43 recovered COVID-19 patients (22 males and 21 females, average age: 50.0 ± 12.1 years) were enrolled and the demographic was shown in Table 1. All patients were divided into 3 groups based on different follow-up time, 4, 12 and 18 months, respectively. MR imaging (MRI) data were acquired on a 3T MAGNETOM Prisma scanner (Siemens Healthcare, Erlangen, Germany) equipped with a 64-channel head/neck coil. The protocol included MPRAGE and pCASL sequence. ASL scans were performed using a 5-delay pCASL sequence (C2P, University of Southern California) with background-suppressed single-shot 3D GRASE readout. Imaging parameters were as follows: five post labeling duration (PLD) times 500/1000/1500/2000/2500 ms; labeling pulse duration, 1500 ms; repetition time, 4100 ms; echo time, 30.56 ms; field of view 224 x 224 mm2, voxel size 3.5 x 3.5 x3.5 mm3, 32 slices covering the whole brain, total acquisition time 5:24 mins including M0 scan. The CBF and BAT values were calculated by processing of the original control and label ASL images based on the original formulation of Buxton et al 6.
Data Processing
The ASL-M0 image were registered to T1 MPRAGE images using SPM12 (https://www.fil.ion.ucl.ac.uk/spm/software/spm12/). Then the deformation field generated from T1 MPRAGE image segmentation was applied to the CBF and BAT images. The differences in CBF and BAT images between 3 groups were analyzed by assessing each region of interest (ROI), including 96 cortical regions using masks generated from the Harvard-Oxford atlas. One-way Analysis of Variance (ANOVA) test and post hoc test with Bonferroni corrected were conducted using SPSS 22.0 software (IBM SPSS Inc., Chicago, IL, USA), and P < 0.05 was considered statistically significant.
Results
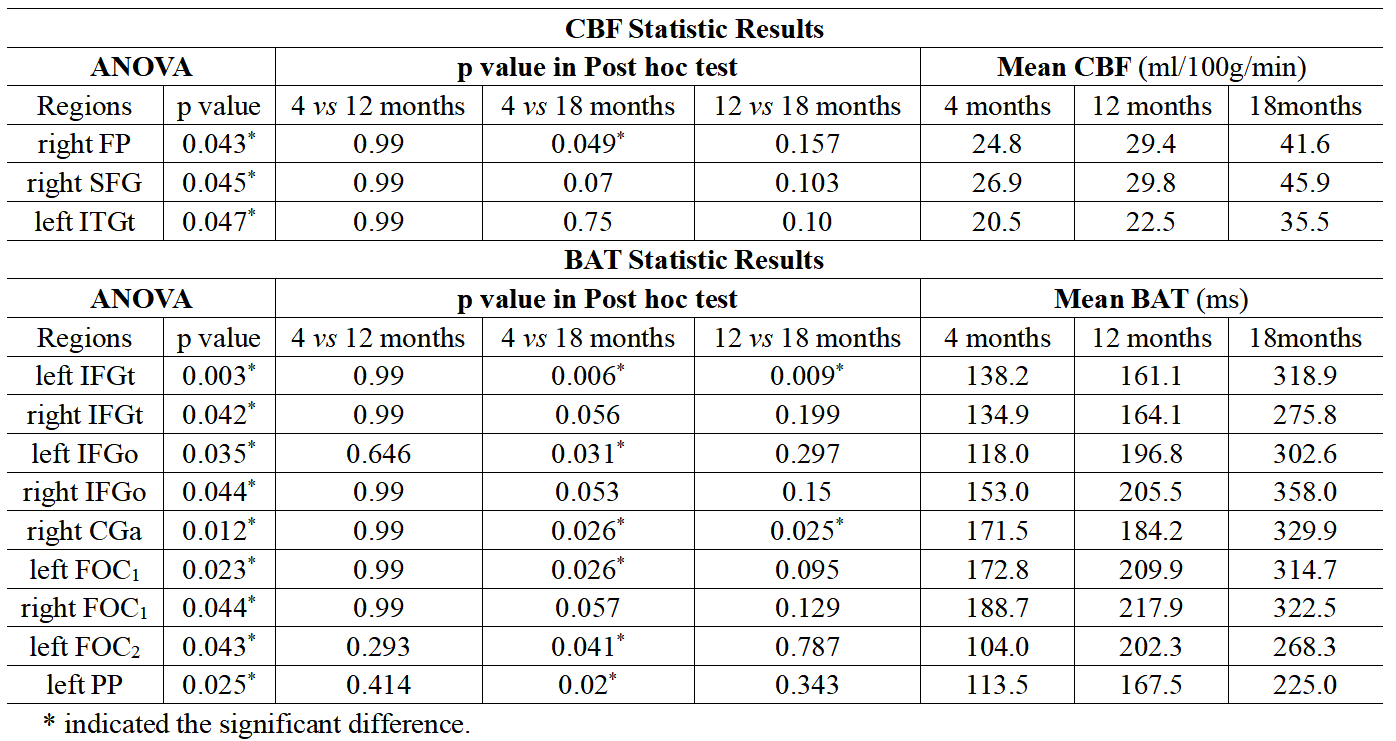
Among 3 groups, the mean CBF values in right frontal pole (FP, p=0.043), superior frontal gyrus (SFG, p=0.045) and temporooccipital part of inferior temporal gyrus (ITGt, p=0.047) had significant difference. After post hoc test with Bonferroni correction, we found 18-month follow-up group had significant higher CBF than 4-month follow-up group in right FP (p=0.049) .The brain areas that have significant difference in mean BAT values between 3 groups included: bilateral pars triangularis of inferior frontal gyrus (IFGt; left, p=0.003; right, p=0.042), pars opercularis of inferior frontal gyrus (IFGo; left, p=0.035; right, p=0.044), frontal orbital cortex (FOC1; left, p=0.023; right, p=0.044), left frontal operculum cortex (FOC2, p=0.043), planum polareand (PP; p=0.025) and right anterior division of cingulate gyrus (CGa, p=0.012). After post hoc test with Bonferroni correction, it’s found that 18-month follow-up group had significant higher BAT than 4-month follow-up group in left IFGt (p=0.006), IFGo (p=0.031), FOC1 (p=0.026), FOC2 (p=0.041), PP (p=0.02) and right CGa (p=0.026). Besides, 18-month follow-up group had significant higher BAT than 12-month follow-up group in left IFGt (p=0.009) and right CGa (p=0.025) (as shown in Figure 1 and Table 2).
Furthermore, we found that CBF and BAT values in the aforementioned brain areas showed an increase trend over the follow-up time (as shown in Figure 2).
Discussion
This study found dynamic increase of cerebral blood flow from 4-month to 18-month follow-up in patients recovering from COVID-19.Previous study found that the overall cortical blood flow decreased at 3-month follow-up 4. The main regions with decreased CBF were concentrated in frontal and temporal cortex 4,7. The authors speculated it may be caused by the destruction of blood-brain barrier, hypoxia or lung inflammation 4,7.
This study found that the CBF significantly increased in FP, SFG and ITGt with the follow-up time increasing after a long-time recovery. It suggested there were a compensatory function recovery in damaged regions, and the degree of dynamic recovery could be more obvious with the recovery time increasing. On the contrary, BAT values significantly increased in frontal and temporal cortex which represented the blood flow speed was slower. We speculated that it’s because the overall trend of blood flow speed was slower after infected with COVID-19. To keep a consistent blood supply, the cerebral blood flow had an increased compensatory process and this dynamic recovery process may be slow. There were some limitations in our study. The sample size was small in each group and there was not enough pCASL imaging of same participants at different follow-up time.
Conclusions
The CBF and BAT values increased gradually in brain frontal and temporal cortex with the increase of follow-up time. It indicated that there was a dynamic recovery process after infected with COVID-19.Acknowledgements
National Natural Science Foundation of China (81720108021), Zhongyuan Thousand Talents Plan Project (ZYQR201810117), Zhengzhou Collaborative Innovation Major Project (20XTZX05015)References
[1] Chen R, Wang K, Yu J, et al. The Spatial and Cell-Type Distribution of SARS-CoV-2 Receptor ACE2 in the Human and Mouse Brains. Front Neurol. 2021 Jan 20;11:573095.
[2] Crook H, Raza S, Nowell J, et al. Long covid-mechanisms, risk factors, and management. BMJ. 2021 Jul 26;374:n1648.
[3] Zhang Y, Xiao M, Zhang S, et al. Coagulopathy and Antiphospholipid Antibodies in Patients with Covid-19. N Engl J Med. 2020 Apr 23;382(17):e38.
[4] Qin Y, Wu J, Chen T, et al. Long-term microstructure and cerebral blood flow changes in patients recovered from COVID-19 without neurological manifestations. J Clin Invest. 2021 Apr 15;131(8):e147329.
[5] Soldatelli MD, Amaral LFD, Veiga VC, et al. Neurovascular and perfusion imaging findings in coronavirus disease 2019: Case report and literature review. Neuroradiol J. 2020 Oct;33(5):368-373.
[6] R. B. Buxton, L. R. Frank, E. C. Wong, et al. “A general kinetic model for quantitative perfusion imaging with arterial spin labeling,” Magn. Reson. Med., vol. 40, no. 3, pp. 383–396, Sep. 1998.
[7] Helms J, Kremer S, Merdji H et al. Neurologic Features in Severe SARS-CoV-2 Infection. N Engl J Med. 2020 Jun 4;382(23):2268-2270.
Figures
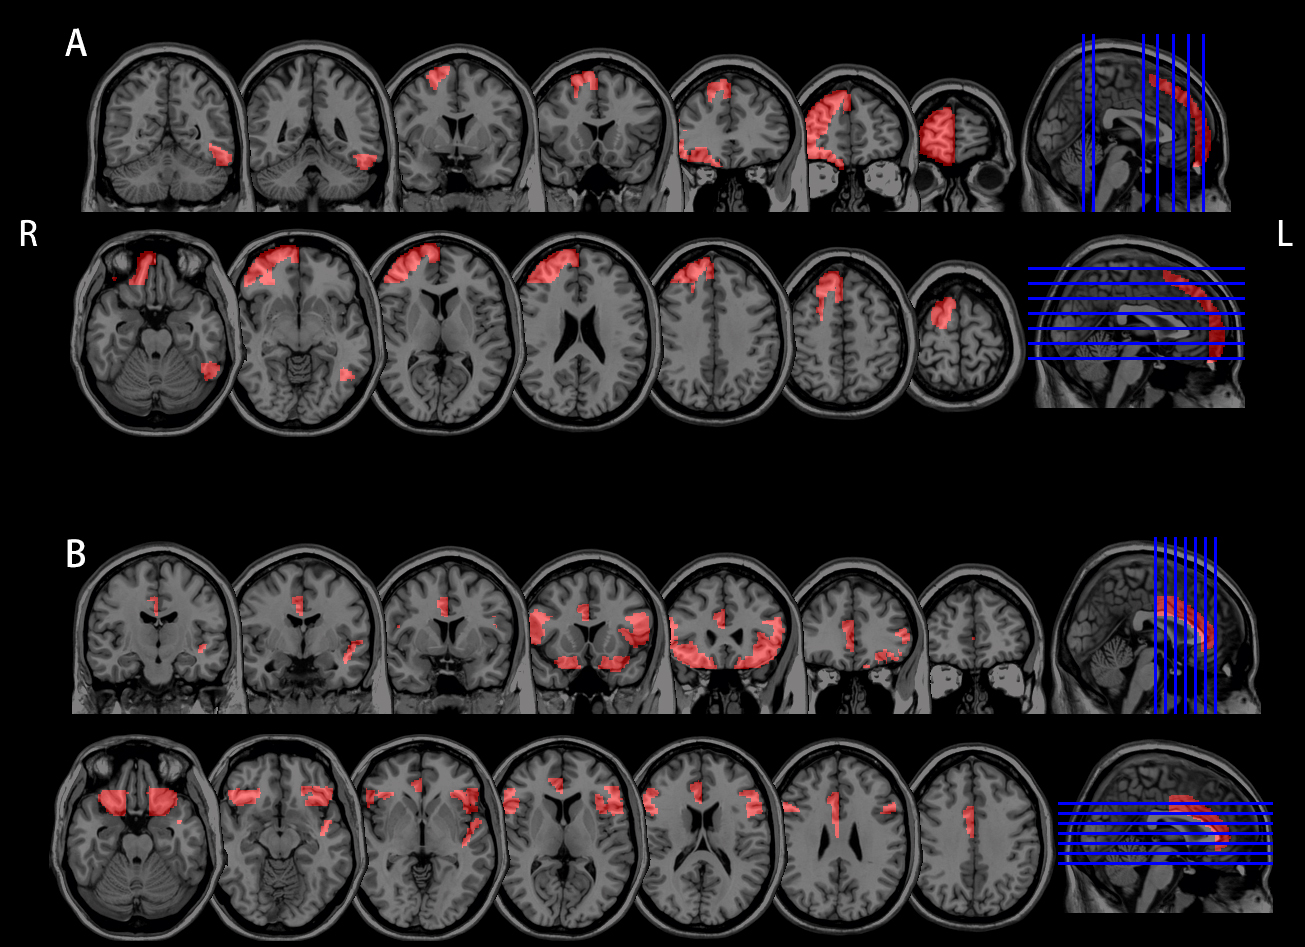
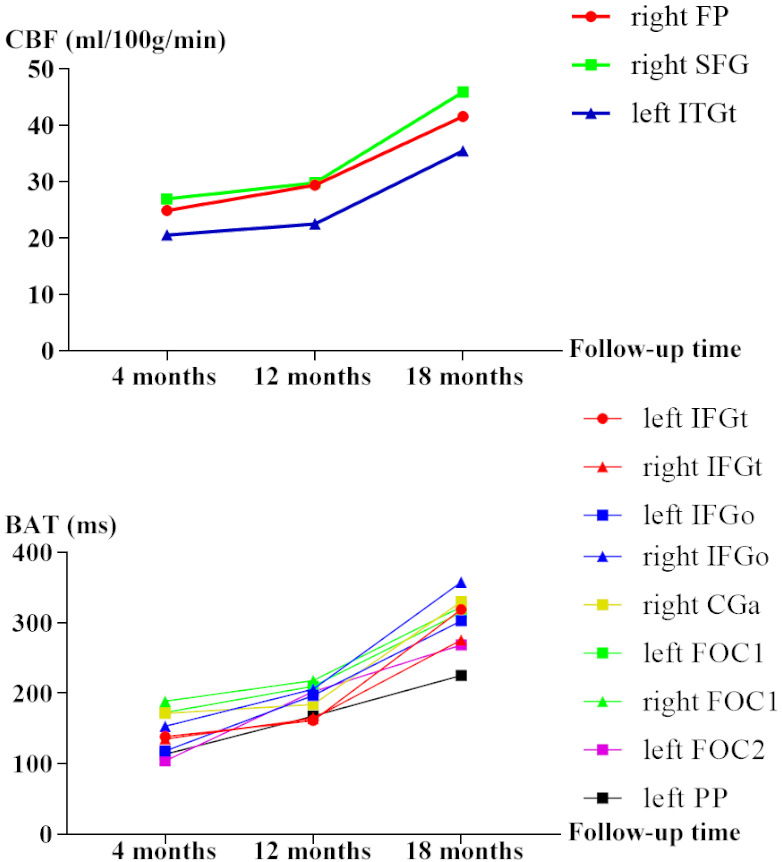
Figure 2. The mean CBF and BAT values with significant difference regions in 3 different follow-up time.