1910
Repeatability of Quantitative Measures in Long COVID using Hyperpolarized 129Xe MRI1Biomedical Engineering, University of Iowa, Iowa City, IA, United States, 2Physics, University of Iowa, Iowa City, IA, United States, 3Radiology, University of Iowa, Iowa City, IA, United States, 4Internal Medicine, University of Iowa, Iowa City, IA, United States
Synopsis
Keywords: Lung, COVID-19
Repeatability visits with hyperpolarized 129Xe MRI of ventilation and gas exchange measures were acquired at baseline and 3-6 weeks after baseline in patients with persistent dyspnea, fatigue, and neurocognitive symptoms (“Long” COVID). Findings did not support the same repeatability of measures found in a previous study of IPF, suggesting instability of pulmonary pathophysiology is a characteristic of Long COVID.Purpose
Repeatability of quantitative image-based measures is important for understanding the precision of potential biomarkers for longitudinal monitoring and for assessing treatment response in therapy trials. This work sought to establish inter-visit repeatability of hyperpolarized 129Xe MRI measures of lung function for patients suffering from persistent dyspnea, fatigue, and neurocognitive symptoms following resolution of acute COVID infection (“Long” COVID)[1].Methods
Four subjects (2 Male, age 52±16 years, range 28-61 years) with prolonged symptoms of Long COVID underwent hyperpolarized Xenon-129 MRI on a 3T scanner (Premier, GE Healthcare) to evaluate gas exchange, regional ventilation and apparent diffusion coefficient (ADC)[2] of inhaled gas. Gas exchange was determined using a 1-point Dixon technique[3] to estimate Xenon transfer from the alveolar airspace (“Gas”) into the tissue and plasma (“Membrane”) and the red blood cells (“RBC”). Gas exchange measures were computed as the ratios of these components, specifically RBC:Membrane, Membrane:Gas and RBC:Gas. The percentage of unventilated lung, or ventilation defect percent (VDP)[4], was calculated using a semiautomatic classification algorithm[5]. ADC was measured using a diffusion weighted sequence with 2 b-values (0 s/mm2 and 12 s/mm2)[6]. The time in between repeated measurement was 3-6 weeks. Repeatability of all 5 measurements between the first and second time-point was evaluated using Bland-Altman analysis in MATLAB [7] and the inter-visit bias, including limits of agreement (LOA), the coefficient of variation (CV), and correlation coefficient (R2) was reported.Results
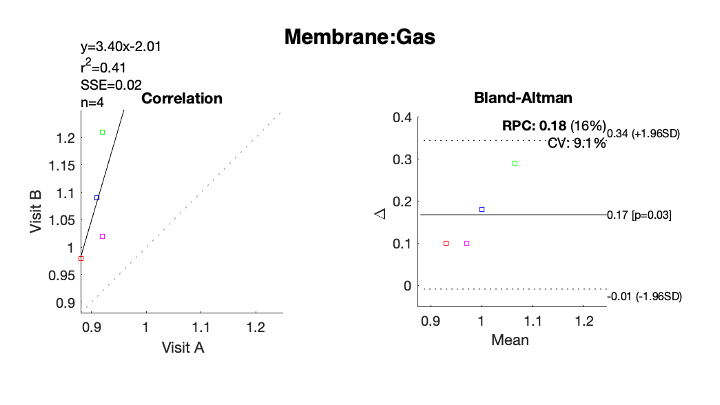
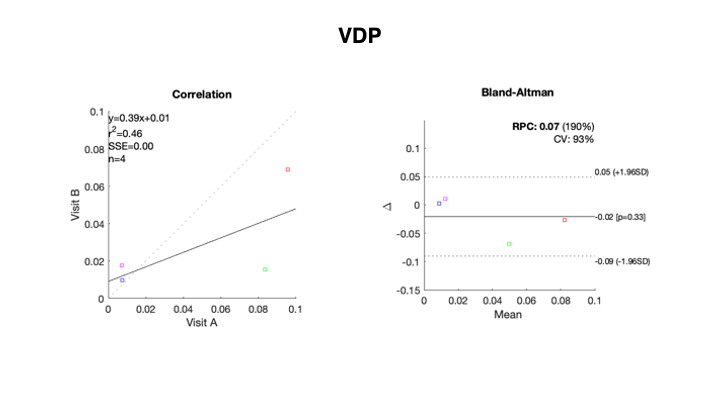
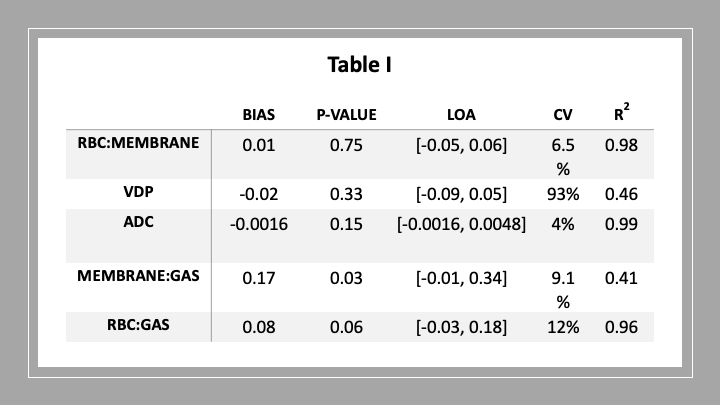
No statistically significant bias was found across visits for any of the measurements other than Membrane:Gas (Figure 1), which increased on average at the follow-up visit (bias=0.17, P=0.03). Coefficients of variation for gas exchange metrics and ADC were relatively low (12%), however CV was much higher (93%) in VDP (Figure 2). VDP and Membrane:Gas also had moderately weak correlations across visits (R2=0.46 and R2=0.41, respectively). A full summary of the repeatability statistics for all 5 measures of interest are provided in Table I.Discussion
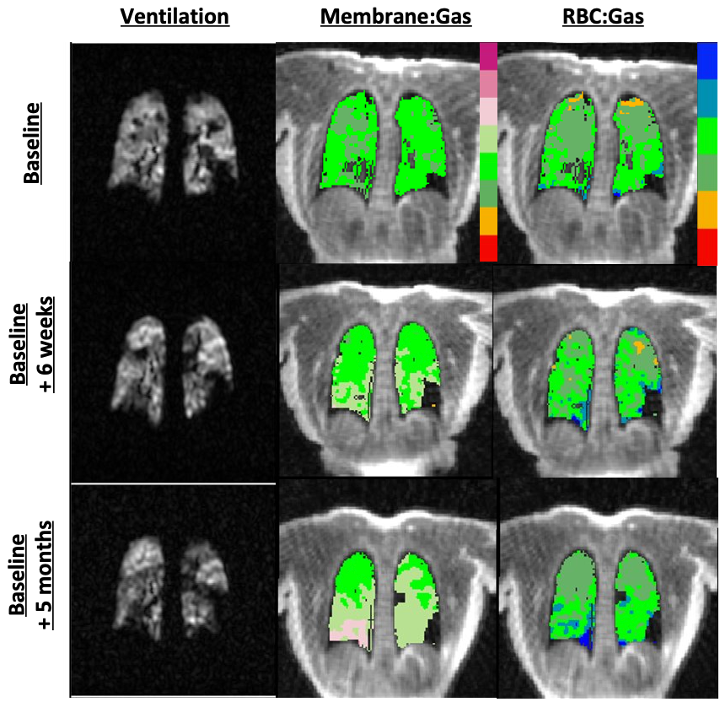
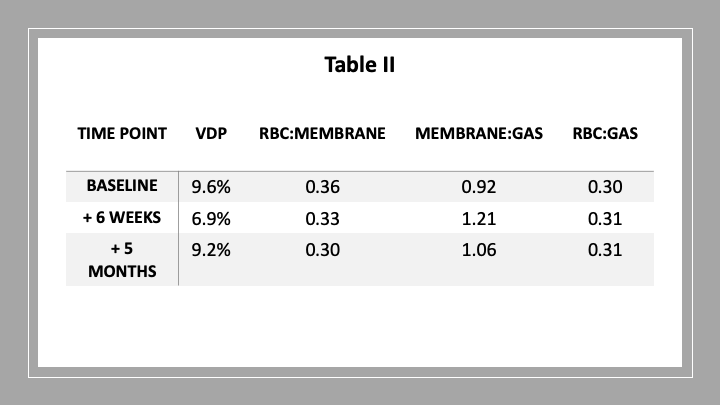
The coefficient of variation of the gas exchange measures is very close, if not slightly lower than previously reported values in healthy volunteers[8]. However, Membrane:Gas ratio has a notably low correlation coefficient and has the only statistically significant bias, indicating an increase in the Membrane:Gas ratio between visits that suggests possible ongoing inflammation. The qualitative pattern of increasing Membrane:Gas ratio at 5 months after baseline persists in the two Long COVID subjects studied with longitudinal follow-up thus far (Figure 3, and Table II). While the VDP bias was not significant at the 0.05 level, VDP has a much larger CV than our other endpoints. Upon examination of two data points (Figure 2, red, green) may be observed with relatively high VDP after visit one. Of these two VDP measures, only one did not appear to significantly change (Figure 2, red), while another did (Figure 2, green). RBC-membrane ratio, ADC, and RBC-gas ratio has high R2 and statistically nonsignificant bias, suggesting that these measures are not only reproducible, but less variable in our ongoing study of Long COVID patients.Conclusion
Three of five Hyperpolarized 129Xe MRI measures of lung function indicate strong repeatability. However, ventilation and membrane-gas ratio showed higher variability than previously reported and likely indicate specific aspects of ongoing lung pathophysiology in Long COVID six weeks after initial scan.Acknowledgements
Funding provided by from the American Lung Association, COVID-19 Respiratory Virus Research AwardReferences
1) Davis, H. E., Assaf, G. S., McCorkell, L., Wei, H., Low, R. J., Re'em, Y., Redfield, S., Austin, J. P., & Akrami, A. (2021). Characterizing long COVID in an international cohort: 7 months of symptoms and their impact. EClinicalMedicine, 38, 101019. https://doi.org/10.1016/j.eclinm.2021.101019
2) Farrell JA, Landman BA, Jones CK, Smith SA, Prince JL, van Zijl PC, Mori S. Effects of signal-to-noise ratio on the accuracy and reproducibility of diffusion tensor imaging-derived fractional anisotropy, mean diffusivity, and principal eigenvector measurements at 1.5 T. J Magn Reson Imaging. 2007 Sep;26(3):756-67. doi: 10.1002/jmri.21053. PMID: 17729339; PMCID: PMC2862967.
3) Kaushik, S. S., Robertson, S. H., Freeman, M. S., He, M., Kelly, K. T., Roos, J. E., Rackley, C. R., Foster, W. M., McAdams, H. P., & Driehuys, B. (2016). Single-breath clinical imaging of hyperpolarized (129)Xe in the airspaces, barrier, and red blood cells using an interleaved 3D radial 1-point Dixon acquisition. Magnetic resonance in medicine, 75(4), 1434–1443. https://doi.org/10.1002/mrm.25675
4) Mummy DG, Kruger SJ, Zha W, Sorkness RL, Jarjour NN, Schiebler ML, Denlinger LC, Evans MD, Fain SB. Ventilation defect percent in helium-3 magnetic resonance imaging as a biomarker of severe outcomes in asthma. J Allergy Clin Immunol. 2018 Mar;141(3):1140-1141.e4. doi: 10.1016/j.jaci.2017.10.016. Epub 2017 Nov 10. PMID: 29129582; PMCID: PMC5844809.
5) Wang, Z. (2020). Quantitative Hyperpolarized 129X e Gas Exchange MRI: Development and Applications (Doctoral dissertation, Duke University).
6) Niedbalski, P. J., Hall, C. S., Castro, M., Eddy, R. L., Rayment, J. H., Svenningsen, S., Parraga, G., Zanette, B., Santyr, G. E., Thomen, R. P., Stewart, N. J., Collier, G. J., Chan, H. F., Wild, J. M., Fain, S. B., Miller, G. W., Mata, J. F., Mugler, J. P., 3rd, Driehuys, B., Willmering, M. M., … Woods, J. C. (2021). Protocols for multi-site trials using hyperpolarized 129 Xe MRI for imaging of ventilation, alveolar-airspace size, and gas exchange: A position paper from the 129 Xe MRI clinical trials consortium. Magnetic resonance in medicine, 86(6), 2966–2986. https://doi.org/10.1002/mrm.28985
7) Ran Klein (2022). Bland-Altman and Correlation Plot (https://www.mathworks.com/matlabcentral/fileexchange/45049-bland-altman-and-correlation-plot), MATLAB Central File Exchange. Retrieved November 9, 2022.
8) Hahn, A. D., Kammerman, J., Evans, M., Zha, W., Cadman, R. V., Meyer, K., Sandbo, N., & Fain, S. B. (2019). Repeatability of regional pulmonary functional metrics of Hyperpolarized 129 Xe dissolved-phase MRI. Journal of magnetic resonance imaging : JMRI, 50(4), 1182–1190. https://doi.org/10.1002/jmri.26745
Figures