1909
Frontal-specific elevation of cerebral oxygen extraction fraction in COVID-19 ICU survivors: a pilot study1Department of Radiology, Johns Hopkins University School of Medicine, Baltimore, MD, United States, 2Department of Surgery, Johns Hopkins University School of Medicine, Baltimore, MD, United States, 3Department of Biomedical Engineering, Johns Hopkins University School of Engineering, Baltimore, MD, United States, 4Department of Biomedical Engineering, Johns Hopkins University School of Medicine, Baltimore, MD, United States, 5Department of Medicine, Johns Hopkins University School of Medicine, Baltimore, MD, United States
Synopsis
Keywords: Infectious disease, COVID-19
Compared to patients with mild COVID-19 disease, critically ill patients requiring intensive-care-unit (ICU) admission are at higher risk of developing post-acute COVID-19 syndrome (PCS). The mechanisms underlying PCS are under investigation and may involve neurovascular damage, which can disrupt oxygen delivery and utilization in the brain. Cerebral oxygen-extraction-fraction (OEF) is an important parameter for the brain’s oxygen utilization. In this work, we evaluated the post-acute changes of regional OEF in COVID-19 ICU-survivors, and found that ICU-survivors had significantly increased OEF in the frontal lobe compared to controls. This suggests that regional OEF may provide a sensitive biomarker in studying PCS.INTRODUCTION
Post-acute COVID-19 syndrome (PCS), characterized by persistent symptoms and/or long-term complications beyond 4 weeks from the onset of symptoms, is highly prevalent and has received growing attention.1 In particular, it has been reported that critically ill patients requiring intensive-care-unit (ICU) admission are at a higher risk of developing long-term neurological deficits and cognitive impairment, compared to those with mild COVID-19 disease.2 The mechanisms underlying PCS are still under investigation and have been suggested to involve neurovascular damage,1,3 which may disrupt oxygen delivery and utilization in the brain. Cerebral oxygen-extraction-fraction (OEF) is an important hemodynamic parameter and reflects a delicate balance between oxygen supply and consumption. Elevated OEF has been demonstrated in cerebrovascular diseases such as carotid occlusion,4 stroke,5 and Moyamoya disease.6 However, to the best of our knowledge, no study has investigated the regional OEF in COVID-19 survivors. In the present pilot study, we used a recently developed technique, accelerated-T2-relaxation-under-phase-contrast (aTRUPC) MRI,7 to evaluate the post-acute changes of regional OEF in COVID-19 ICU-survivors, in comparison with healthy controls. Alterations of regional cerebral-blood-flow (CBF) in COVID-19 ICU-survivors were also examined.METHODS
Participants: We studied five COVID-19 ICU-survivors. The average time between ICU admission and the MRI scan was 122.6 days. For comparison, 19 age- and sex-matched healthy controls were included. The demographical and clinical characteristics of the participants are listed in Table 1. This study was IRB-approved and written informed consent was obtained from every participant.MRI Experiments: All participants were scanned on a 3T Siemens Prisma scanner. On all subjects, regional OEF was measured by aTRUPC using the following parameters:7 2D single-slice in the mid-sagittal plane, field-of-view=200×200mm2, slice thickness=10mm, reconstructed resolution=0.8×0.8mm2, 3 effective-TEs (eTEs): 0, 40 and 80ms, velocity-encoding=15cm/s, GRAPPA=2, and scan time=2.1min.
On all COVID-19 ICU-survivors and a subset of 10 controls, regional CBF was measured using pseudo-continuous-arterial-spin-labeling (pCASL)8 with labeling-duration=1.8s, post-labeling-delay=2.2s and voxel-size=3.4×3.4×4.0mm3. 3D T1-MPRAGE with voxel-size=1.0×1.0×1.0mm3 was also acquired.
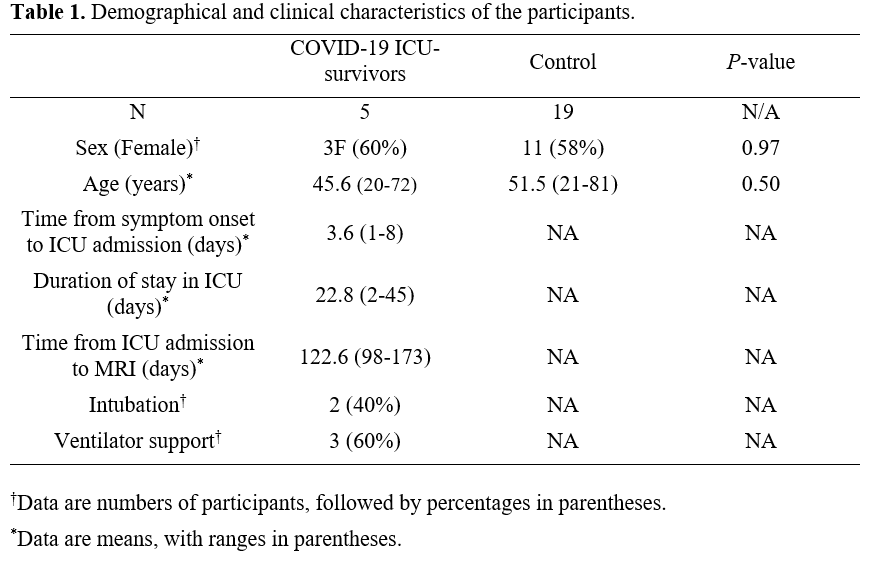
Data Processing: The aTRUPC data were processed to obtain venous oxygenation (Yv) maps in the major cerebral veins, following procedures in the literature.7 OEF maps were then computed by OEF=(Ya−Yv)/Ya×100%, where Ya was assumed to be 98%. For quantitative analyses, OEF values were extracted from six regions-of-interest (ROIs), as illustrated in Figure 1A. ROI#1-3 were placed on the frontal, middle and posterior segments of the superior-sagittal-sinus (SSS). ROI#4-6 were placed on the deep veins: straight-sinus, vein-of-Galen (GV) and internal-cerebral-veins (ICVs).
The pCASL data were processed using the ASL-MRICloud tool to obtain voxel-wise CBF maps.9 To correlate with aTRUPC OEF measurements, we calculated averaged CBF values in selected ROIs obtained from MPRAGE segmentations using the MRICloud platform.10 These CBF ROIs were chosen based on the general venous drainage territories, for example, the SSS mainly drains the neocortices while the ICVs mainly drain the basal-ganglia and thalami (BGT). Figure 1C lists the one-to-one correspondence between the CBF ROIs and the OEF ROIs.
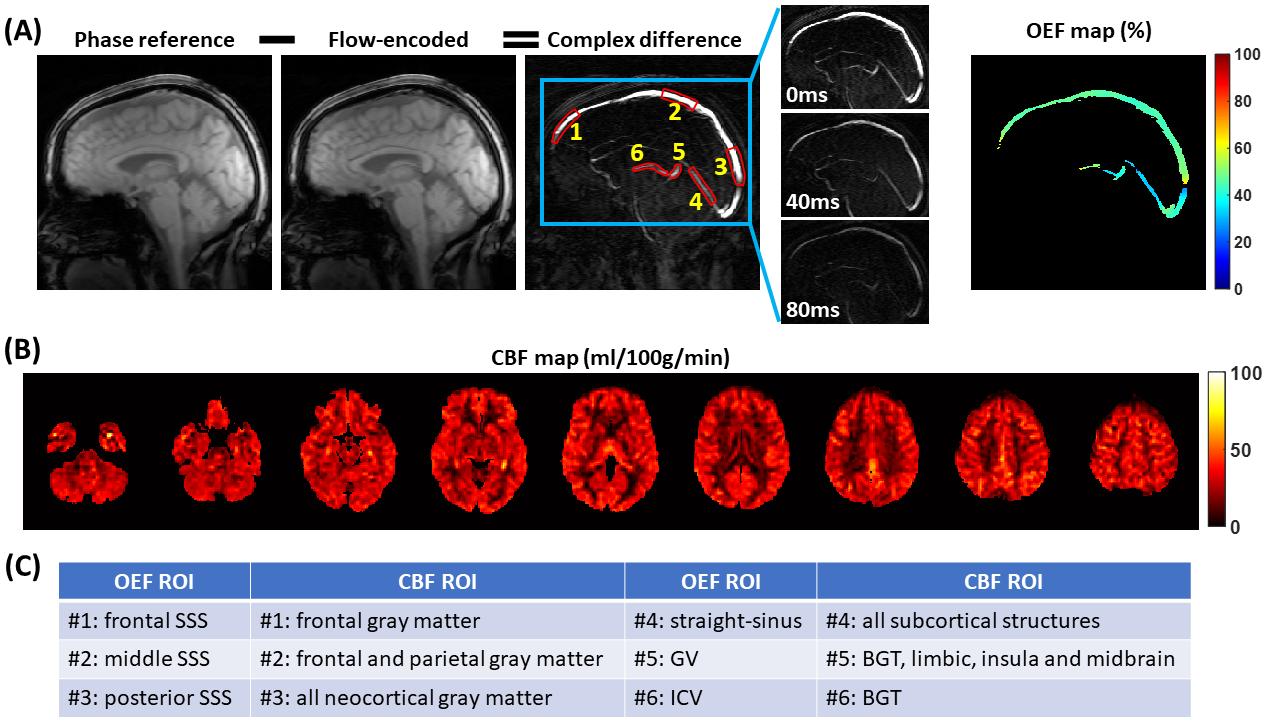
Statistical Analysis: To investigate whether the regional OEF values differ between COVID-19 ICU-survivors and controls, linear regression analyses were conducted using OEF values of each ROI as the dependent variable and group (0=control, 1=ICU-survivors) as the independent variable, with age as a covariate. These analyses were repeated for ROI CBF values to examine CBF alterations.
In addition, we also evaluated the correlations between OEF and CBF values of each pair of ROIs (see Figure 1C).
RESULTS
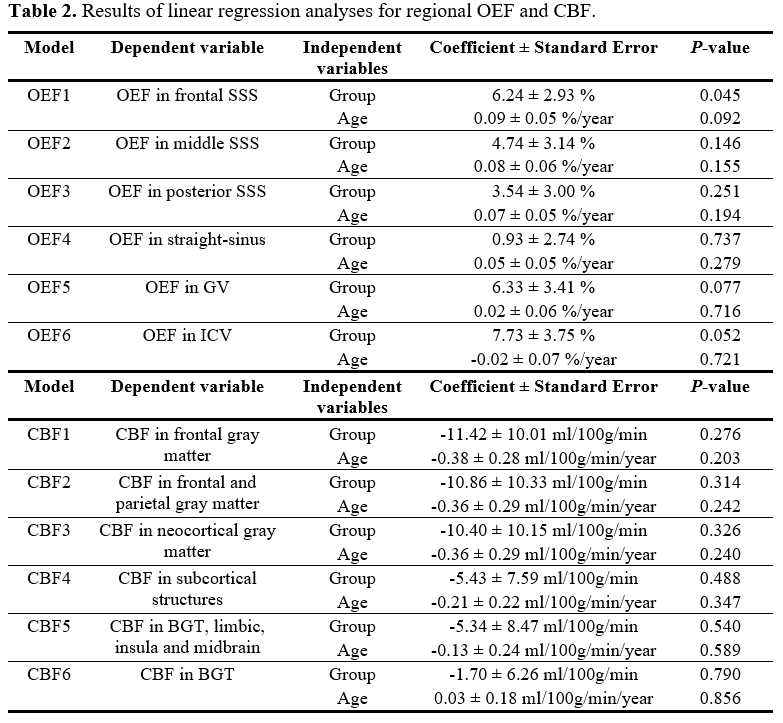
Figure 1 displays aTRUPC and pCASL data of a representative COVID-19 ICU-survivor.Table 2 summarizes the linear regression analyses for regional OEF and CBF. As shown in Figure 2, the COVID-19 ICU-survivors had an elevated OEF in the frontal SSS (P=0.045), which represents the OEF of the frontal lobe. There were trends toward higher OEF in the ICU-survivors in GV (P=0.077) and ICV (P=0.052), both representing OEF of deep brain regions including subcortical nuclei and limbic structures, although they did not reach significance level. We did not find significant differences in regional CBF values between the two groups (P>0.05), although the ICU-survivors in general had lower CBF after adjusting for age (all regions revealed negative coefficient values in Table 2).
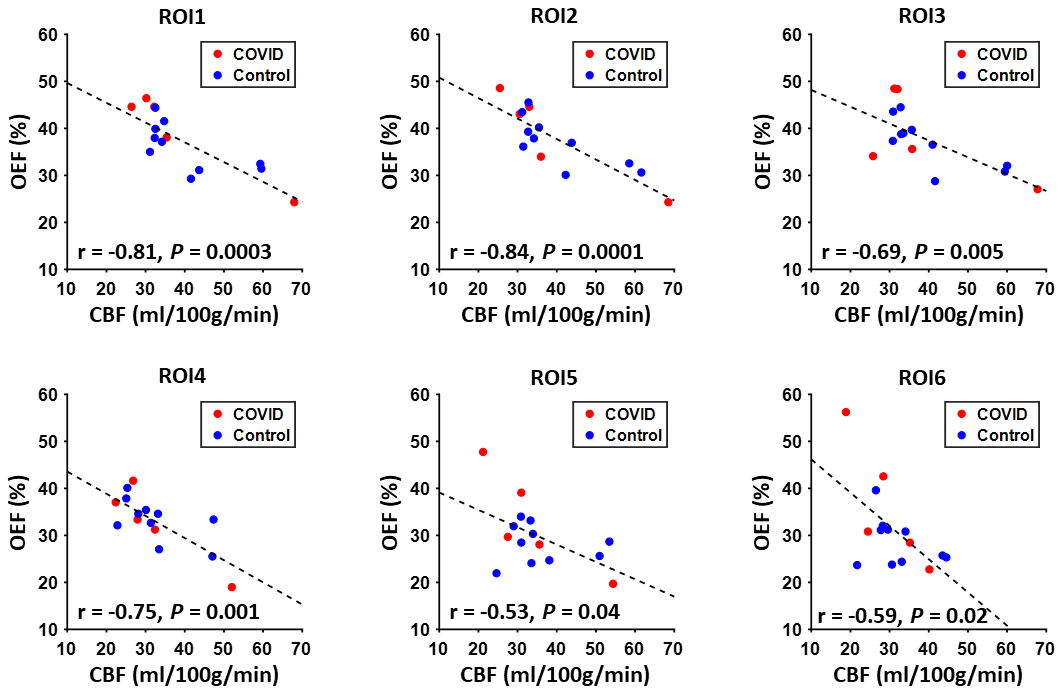
Figure 3 illustrates the associations between regional OEF and CBF values. Significant inverse correlations were observed in each pair of OEF and CBF ROIs (P<0.05).
DISCUSSION AND CONCLUSION
In this pilot study, we observed that compared to controls, COVID-19 ICU-survivors had significantly increased OEF in the frontal lobe. This brain area is critical for high-level cognitive function such as attention and memory, which are known to manifest deficits in PCS such as brain fog and fatigue.1 Elevated OEF could be either caused by hypermetabolism (due to diminished neural computation efficiency) or impaired CBF. Our findings suggest that impaired CBF at least plays a role, because lower CBF correlated with higher OEF in our data. Although we did not find significant changes in regional CBF in ICU-survivors, the frontal region showed the greatest CBF deficit (Table 2). Furthermore, a few studies have reported that CBF in the frontal lobe, subcortical nuclei and limbic structures are reduced in severe COVID-19 patients.11,12In summary, this study suggests that regional OEF measurement may provide a sensitive biomarker in studying long-term alterations of brain physiology and function after severe COVID-19 infection.
Acknowledgements
No acknowledgement found.References
1. Nalbandian A, Sehgal K, Gupta A et al. Post-acute COVID-19 syndrome. Nat Med 2021;27:601-615.
2. Mattioli F, Piva S, Stampatori C et al. Neurologic and cognitive sequelae after SARS-CoV2 infection: Different impairment for ICU patients. J Neurol Sci 2022;432:120061.
3. Lee MH, Perl DP, Steiner J et al. Neurovascular injury with complement activation and inflammation in COVID-19. Brain 2022;145:2555-2568.
4. Grubb RL, Jr., Derdeyn CP, Fritsch SM, Carpenter DA, Yundt KD, Videen TO, Spitznagel EL, Powers WJ. Importance of hemodynamic factors in the prognosis of symptomatic carotid occlusion. JAMA 1998;280:1055-1060.
5. Fan AP, Khalil AA, Fiebach JB, Zaharchuk G, Villringer A, Villringer K, Gauthier CJ. Elevated brain oxygen extraction fraction measured by MRI susceptibility relates to perfusion status in acute ischemic stroke. J Cereb Blood Flow Metab 2020;40:539-551.
6. Watchmaker JM, Juttukonda MR, Davis LT et al. Hemodynamic mechanisms underlying elevated oxygen extraction fraction (OEF) in moyamoya and sickle cell anemia patients. J Cereb Blood Flow Metab 2018;38:1618-1630.
7. Jiang D, Lu H, Parkinson C, Su P, Wei Z, Pan L, Tekes A, Huisman T, Golden WC, Liu P. Vessel-specific quantification of neonatal cerebral venous oxygenation. Magn Reson Med 2019;82:1129-1139.
8. Alsop DC, Detre JA, Golay X et al. Recommended implementation of arterial spin-labeled perfusion MRI for clinical applications: A consensus of the ISMRM perfusion study group and the European consortium for ASL in dementia. Magn Reson Med 2015;73:102-116.
9. Li Y, Liu P, Li Y et al. ASL-MRICloud: An online tool for the processing of ASL MRI data. NMR Biomed 2019;32:e4051.
10. Mori S, Wu D, Ceritoglu C, Li Y, Kolasny A, Vaillant MA, Faria AV, Oishi K, Miller MI. MRICloud: delivering high-throughput MRI neuroinformatics as cloud-based software as a service. Computing in Science & Engineering 2016;18:21-35.
11. Qin Y, Wu J, Chen T et al. Long-term microstructure and cerebral blood flow changes in patients recovered from COVID-19 without neurological manifestations. J Clin Invest 2021;131.
12. Helms J, Kremer S, Merdji H et al. Neurologic Features in Severe SARS-CoV-2 Infection. N Engl J Med 2020;382:2268-2270.
Figures