1903
Application of Pulmonary Perfusion Analysis in Phenotyping COVID-19 Cardiopulmonary Disease with Magnetic Resonance Imaging1School of Medicine, Johns Hopkins University, Baltimore, MD, United States, 2Division of Cardiology, Department of Medicine, Johns Hopkins University School of Medicine, Baltimore, MD, United States, 3Canon Medical Systems Corporation, Otawara, Japan, 4Department of Radiology and Radiological Sciences, Johns Hopkins University School of Medicine, Baltimore, MD, United States
Synopsis
Keywords: Vessels, COVID-19, Perfusion
Pulmonary perfusion analysis of cardiac magnetic resonance imaging in patients with previous COVID-19 may help phenotype patients with advanced cardiopulmonary disease. Lung perfusion analysis was performed and results were correlated with clinical data in patients who were treated for COVID-19 at Johns Hopkins institutions. Older age and hospitalization for COVID-19 were found to be related to worse pulmonary perfusion, as measured by the perfusion parameter 50% max intensity, suggesting that one long-term sequela of severe COVID-19 that requires hospitalization, particularly in older patients, is a global bilateral decrease in the speed at which the lungs are perfused.Introduction
Viral SARS-CoV-2, which causes COVID-19, has been implicated in multiple cardiopulmonary diseases1-6. Much remains to be learned regarding the long-term sequelae in patients who recover from COVID-19. Cardiac magnetic resonance imaging (MRI) studies have proven useful in the evaluation of patients with several cardiopulmonary diseases7-14, including COVID-19. Methods for assessing lung perfusion via MRI may aid in phenotyping patients with advanced disease15-21.In a similar effort to that by Hueper et al.22, we sought to derive robust methodology for assessing quantitative pulmonary perfusion parameters from dynamic contrast-enhanced (DCE) MRI and to use this methodology to characterize sequelae of COVID-19 in individuals who receive similar care related to disease severity and duration in a single health care system. A history of pulmonary diseases affecting lung perfusion, such as COPD23, has been reported as a risk factor for hospitalization and poor prognosis/outcomes in COVID-19. Therefore, we sought to investigate the association between pulmonary perfusion parameters and clinical data, hypothesizing that patients who are hospitalized for COVID-19 illness, who are presumably sicker than patients who don’t require hospitalization, will have impaired lung perfusion post-COVID.
Methods
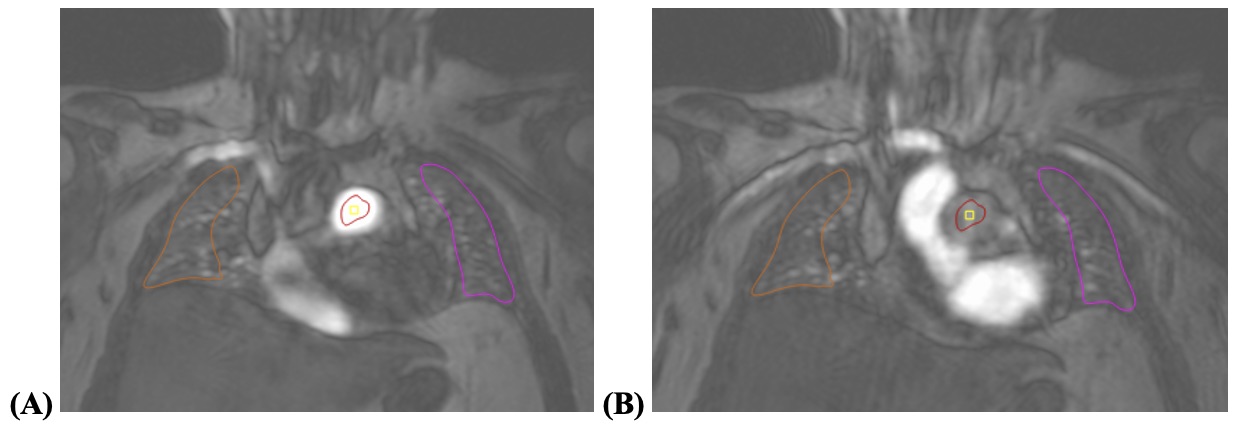
In a single-center analysis, patients who were diagnosed with COVID-19 after March 2020, who were 3-6 months post-discharge for confirmed COVID-19 illness at a Johns Hopkins institution, and who were 18 years of age or older were screened. Included patients underwent comprehensive cardiopulmonary imaging evaluation and phenotyping, including a cardiac MR imaging study (Canon Galan 3T scanner) with 4D lung perfusion images obtained after 0.04 mmol/kg Dotarem contrast at 5 mL/sec was administered.Using QMass 8.1 (Medis Medical Imaging Systems, Leiden, Netherlands), pulmonary perfusion was assessed. A representative coronal image of the lungs around the anterior 1/3 of the chest was selected, such that the pulmonary artery trunk proximal to its bifurcation and the trachea could be visualized. Using QMass 8.1’s Time Signal Intensity analysis, the arterial input function (AIF) was assessed by creating a circular region of interest (ROI) around the middle of the pulmonary artery trunk blood pool, sparing adjacent areas of the vessel wall such that measurements would be robust against motion during the cardiac cycle and to avoid bias from the turbulence of blood flow. Pulmonary parenchymal ROIs were drawn on the lung peripheries to ensure they excluded the larger pulmonary arterial vasculature and allowed for positioning throughout the image acquisition phases. Right lung was consistently labeled as ROI1 and left lung as ROI2. ROIs were propagated to each phase in image acquisition. See figures 1A and 1B.
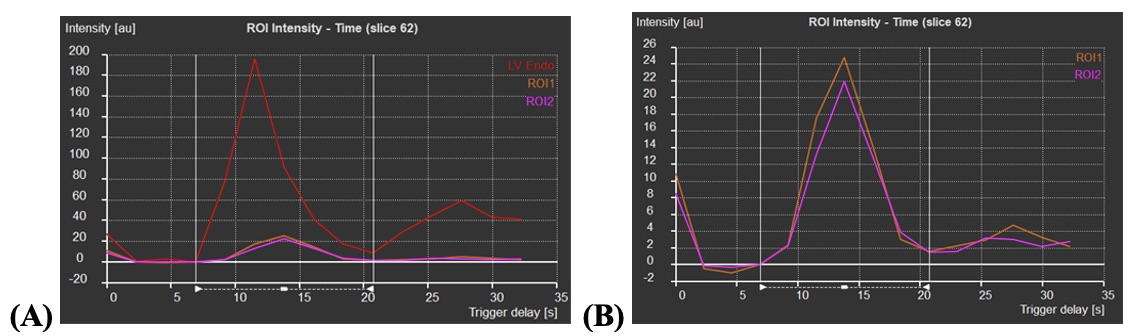
Perfusion data was automatically collected, and the time-signal intensity (SI) curves of each ROI were investigated (see figures 2A and 2B). The initial timing of the SI upslope was set as T0 and the timing of the end of the first-pass was set as TEnd. For each of the three ROIs, amplitude (au), max upslope (au/s), time max upslope (s), mean intensity (au), time 50% max (s), T0 intensity (au), baseline intensity (au), and relative upslope (%) were collected, where “au” stands for arbitrary unit.
Statistical regression analysis was performed to assess relationships between perfusion parameters (particularly, time to max upslope [s], time to 50% max intensity [s], and relative upslope [%]) and clinical characteristics – age, sex, BMI, whether hospitalized for COVID, whether reported any post-COVID symptoms, whether had a history of pulmonary disease prior to COVID diagnosis, and whether was a past smoker. T-tests were performed between the right and left lung perfusion parameters to assess for consistency in measurement.
Results
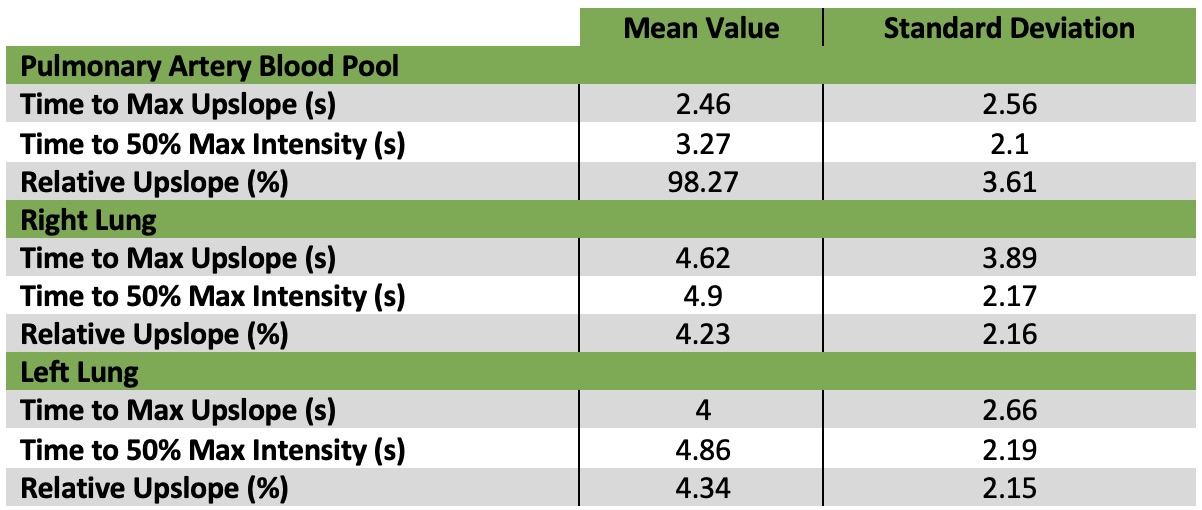
54 patients met inclusion criteria. Average age was 55.2 ± 12.4 years. Average BMI was 29.4 ± 6.0 kg/m2. 8 patients (15%) had a history of pulmonary disease, including COPD, asthma, or obstructive sleep apnea. For pulmonary artery blood pool, right lung, and left lung perfusion data, see Table 1.There were no statistically significant differences between the lungs in terms of perfusion parameters: right relative upslope vs left relative upslope (t-test, p = 0.80); right time 50% max vs left time 50% max (t-test, p = 0.92); right time max upslope vs left time max upslope (t-test, p = 0.34). Regression analysis performed between perfusion parameters vs aforementioned clinical characteristics. Analysis revealed direct relationships between time to 50% max intensity and hospitalization [blood pool time 50% max and hospitalization, p = 0.000; right lung time 50% max and hospitalization, p = 0.000; and left lung time 50% max to hospitalization, p = 0.000] and between time to 50% max intensity and age [right lung time 50% max to age, p = 0.02; left lung time 50% max to age, p = 0.016].
Discussion/Conclusion
Older patients and those who required hospitalization for COVID-19 illness may have worse pulmonary perfusion, as measured by time to 50% max intensity on MRI, following their illness. This suggests that one long-term sequela of severe COVID-19 that requires hospitalization, particularly in older patients, is a global bilateral decrease in the speed at which the lungs are perfused. A limitation of our study is that we cannot definitively conclude whether the worse pulmonary perfusion is a consequence of COVID-19 or the reason for severe COVID-19 and/or hospitalization.Acknowledgements
No acknowledgement found.References
1. Chung MK, Zidar DA, Bristow MR, Cameron SJ, Chan T, Harding CV 3rd, Kwon DH, Singh T, Tilton JC, Tsai EJ, Tucker NR, Barnard J, Loscalzo J. COVID-19 and Cardiovascular Disease: From Bench to Bedside. Circ Res. 2021 Apr 16;128(8):1214-1236. doi: 10.1161/CIRCRESAHA.121.317997. Epub 2021 Apr 15. PMID: 33856918; PMCID: PMC8048382.
2. Clerkin KJ, Fried JA, Raikhelkar J, Sayer G, Griffin JM, Masoumi A, Jain SS, Burkhoff D, Kumaraiah D, Rabbani L, Schwartz A, Uriel N. COVID-19 and Cardiovascular Disease. Circulation. 2020 May 19;141(20):1648-1655. doi: 10.1161/CIRCULATIONAHA.120.046941. Epub 2020 Mar 21. PMID: 32200663.
3. Cenko E, Badimon L, Bugiardini R, Claeys MJ, De Luca G, de Wit C, Derumeaux G, Dorobantu M, Duncker DJ, Eringa EC, Gorog DA, Hassager C, Heinzel FR, Huber K, Manfrini O, Milicic D, Oikonomou E, Padro T, Trifunovic-Zamaklar D, Vasiljevic-Pokrajcic Z, Vavlukis M, Vilahur G, Tousoulis D. Cardiovascular disease and COVID-19: a consensus paper from the ESC Working Group on Coronary Pathophysiology & Microcirculation, ESC Working Group on Thrombosis and the Association for Acute CardioVascular Care (ACVC), in collaboration with the European Heart Rhythm Association (EHRA). Cardiovasc Res. 2021 Dec 17;117(14):2705-2729. doi: 10.1093/cvr/cvab298. PMID: 34528075; PMCID: PMC8500019.
4. Doerschug KC, Schmidt GA. Pulmonary Aspects of COVID-19. Annu Rev Med. 2022 Jan 27;73:81-93. doi: 10.1146/annurev-med-042220-014817. PMID: 35084996.
5. Çakır Edis E. Chronic Pulmonary Diseases and COVID-19. Turk Thorac J. 2020 Sep;21(5):345-349. doi: 10.5152/TurkThoracJ.2020.20091. Epub 2020 Sep 1. PMID: 33031727; PMCID: PMC7544403.
6. Guan WJ, Ni ZY, Hu Y, Liang WH, Ou CQ, He JX, Liu L, Shan H, Lei CL, Hui DSC, Du B, Li LJ, Zeng G, Yuen KY, Chen RC, Tang CL, Wang T, Chen PY, Xiang J, Li SY, Wang JL, Liang ZJ, Peng YX, Wei L, Liu Y, Hu YH, Peng P, Wang JM, Liu JY, Chen Z, Li G, Zheng ZJ, Qiu SQ, Luo J, Ye CJ, Zhu SY, Zhong NS; China Medical Treatment Expert Group for Covid-19. Clinical Characteristics of Coronavirus Disease 2019 in China. N Engl J Med. 2020 Apr 30;382(18):1708-1720. doi: 10.1056/NEJMoa2002032. Epub 2020 Feb 28. PMID: 32109013; PMCID: PMC7092819.
7. Busse A, Rajagopal R, Yücel S, Beller E, Öner A, Streckenbach F, Cantré D, Ince H, Weber MA, Meinel FG. Cardiac MRI-Update 2020. Radiologe. 2020 Nov;60(Suppl 1):33-40. English. doi: 10.1007/s00117-020-00687-1. PMID: 32385547.
8. Bauer WR. Was kann die kardiale MR-Bildgebung heute leisten? [Cardiac MRI today]. Dtsch Med Wochenschr. 2021 Mar;146(5):344-350. German. doi: 10.1055/a-1239-5068. Epub 2021 Mar 1. PMID: 33648004.
9. Vitrella G, Faganello G, Morea G, Pagnan L, Belgrano M, Cova MA. Role of Cardiac Imaging: Cardiac Magnetic Resonance and Cardiac Computed Tomography. 2019 May 18. In: Sinagra G, Merlo M, Pinamonti B, editors. Dilated Cardiomyopathy: From Genetics to Clinical Management [Internet]. Cham (CH): Springer; 2019. Chapter 8. PMID: 32091727.
10. Lima JA, Desai MY. Cardiovascular magnetic resonance imaging: current and emerging applications. J Am Coll Cardiol. 2004 Sep 15;44(6):1164-71. doi: 10.1016/j.jacc.2004.06.033. PMID: 15364314.
11. Kato S, Azuma M, Fukui K, Kodama S, Nakayama N, Kitamura H, Hagiwara E, Ogura T, Horita N, Namkoong H, Kimura K, Tamura K, Utsunomiya D. Cardiac involvement in coronavirus disease 2019 assessed by cardiac magnetic resonance imaging: a meta-analysis. Heart Vessels. 2022 Mar 16:1–13. doi: 10.1007/s00380-022-02055-6. Epub ahead of print. PMID: 35294611; PMCID: PMC8925980.
12. Ojha V, Verma M, Pandey NN, Mani A, Malhi AS, Kumar S, Jagia P, Roy A, Sharma S. Cardiac Magnetic Resonance Imaging in Coronavirus Disease 2019 (COVID-19): A Systematic Review of Cardiac Magnetic Resonance Imaging Findings in 199 Patients. J Thorac Imaging. 2021 Mar 1;36(2):73-83. doi: 10.1097/RTI.0000000000000574. PMID: 33306666.
13. Puntmann VO, Carerj ML, Wieters I, Fahim M, Arendt C, Hoffmann J, Shchendrygina A, Escher F, Vasa-Nicotera M, Zeiher AM, Vehreschild M, Nagel E. Outcomes of Cardiovascular Magnetic Resonance Imaging in Patients Recently Recovered From Coronavirus Disease 2019 (COVID-19). JAMA Cardiol. 2020 Nov 1;5(11):1265-1273. doi: 10.1001/jamacardio.2020.3557. Erratum in: JAMA Cardiol. 2020 Nov 1;5(11):1308. PMID: 32730619; PMCID: PMC7385689.
14. Atri L, Morgan M, Harrell S, AlJaroudi W, Berman AE. Role of cardiac magnetic resonance imaging in the diagnosis and management of COVID-19 related myocarditis: Clinical and imaging considerations. World J Radiol. 2021 Sep 28;13(9):283-293. doi: 10.4329/wjr.v13.i9.283. PMID: 34630914; PMCID: PMC8473436.
15. Ohno Y, Hatabu H, Murase K, Higashino T, Kawamitsu H, Watanabe H, Takenaka D, Fujii M, Sugimura K. Quantitative assessment of regional pulmonary perfusion in the entire lung using three-dimensional ultrafast dynamic contrast-enhanced magnetic resonance imaging: Preliminary experience in 40 subjects. J Magn Reson Imaging. 2004 Sep;20(3):353-65. doi: 10.1002/jmri.20137. PMID: 15332240.
16. Risse, F & Fink, Christian & Ley, S & Kauczor, Hans-Ulrich & Schad, Lothar. (2004). Perfusion quantification of the whole lung using singular value decomposition with optimized threshold.
17. Ley S, Ley-Zaporozhan J. Pulmonary perfusion imaging using MRI: clinical application. Insights Imaging. 2012 Feb;3(1):61-71. doi: 10.1007/s13244-011-0140-1. Epub 2011 Dec 29. PMID: 22695999; PMCID: PMC3292645.
18. Hatabu H, Ohno Y, Gefter WB, Parraga G, Madore B, Lee KS, Altes TA, Lynch DA, Mayo JR, Seo JB, Wild JM, van Beek EJR, Schiebler ML, Kauczor HU; Fleischner Society. Expanding Applications of Pulmonary MRI in the Clinical Evaluation of Lung Disorders: Fleischner Society Position Paper. Radiology. 2020 Nov;297(2):286-301. doi: 10.1148/radiol.2020201138. Epub 2020 Sep 1. PMID: 32870136.
19. Schiwek M, Triphan SMF, Biederer J, Weinheimer O, Eichinger M, Vogelmeier CF, Jörres RA, Kauczor HU, Heußel CP, Konietzke P, von Stackelberg O, Risse F, Jobst BJ, Wielpütz MO; COSYCONET study group. Quantification of pulmonary perfusion abnormalities using DCE-MRI in COPD: comparison with quantitative CT and pulmonary function. Eur Radiol. 2021 Sep 22. doi: 10.1007/s00330-021-08229-6. Epub ahead of print. PMID: 34553255.
20. Ingrisch M, Maxien D, Schwab F, Reiser MF, Nikolaou K, Dietrich O. Assessment of pulmonary perfusion with breath-hold and free-breathing dynamic contrast-enhanced magnetic resonance imaging: quantification and reproducibility. Invest Radiol. 2014 Jun;49(6):382-9. doi: 10.1097/RLI.0000000000000020. PMID: 24473368.
21. Hatabu, Hiroto, et al. "Quantitative assessment of pulmonary perfusion with dynamic contrast‐enhanced MRI." Magnetic Resonance in Medicine: An Official Journal of the International Society for Magnetic Resonance in Medicine 42.6 (1999): 1033-1038.
22. Hueper K, Parikh MA, Prince MR, Schoenfeld C, Liu C, Bluemke DA, Dashnaw SM, Goldstein TA, Hoffman EA, Lima JA, Skrok J, Zheng J, Barr RG, Vogel-Claussen J. Quantitative and semiquantitative measures of regional pulmonary microvascular perfusion by magnetic resonance imaging and their relationships to global lung perfusion and lung diffusing capacity: the multiethnic study of atherosclerosis chronic obstructive pulmonary disease study. Invest Radiol. 2013 Apr;48(4):223-30. doi: 10.1097/RLI.0b013e318281057d. PMID: 23385398; PMCID: PMC3952075.
23. Halpin DMG, Rabe AP, Loke WJ, Grieve S, Daniele P, Hwang S, Forsythe A. Epidemiology, Healthcare Resource Utilization, and Mortality of Asthma and COPD in COVID-19: A Systematic Literature Review and Meta-Analyses. J Asthma Allergy. 2022 Jun 17;15:811-825. doi: 10.2147/JAA.S360985. PMID: 35747745; PMCID: PMC9211747.
Figures