1900
Persistent Abnormalities in Lung Water Density Observed After COVID-19 Recovery1Department of Biomedical Engineering, University of Alberta, Edmonton, AB, Canada, 2Libin Cardiovascular Institute, University of Calgary, Calgary, AB, Canada, 3Division of Cardiology, University of Alberta, Edmonton, AB, Canada
Synopsis
Keywords: Lung, COVID-19
The long term effects of COVID-19, including those affecting the lung, represent a new global health burden. Lung water density (LWD) MRI is an emerging quantitative technique that can be used to measure relative LWD (rLWD) in 3D. 187 patients were imaged 5 months after COVID-19 recovery using LWD MRI and were compared to 91 healthy controls. The COVID-recovered group displayed significantly higher mean rLWD values as compared to healthy controls. Additionally, local and global patterns of abnormally increased and decreased rLWD were observed in the COVID-recovered group.
Introduction
Persistent symptoms experienced after COVID-19 recovery, including those related to damage to the lungs, represent a new global health burden.1 Previous MRI studies focusing on the lungs have noted perfusion and ventilation abnormalities2,3 as well as significantly impaired gas transfer and potential changes in pulmonary microstructure4–6, measured in small cohorts.Lung water density (LWD) measurement is an emerging technique that uses ultrashort echo-time (UTE) proton MRI for visualization of structure and quantification of water content, with clinical utility previously illustrated in heart failure.7 The aim of this study was to characterize the underlying LWD patterns associated with COVID-19 recovery in a large cohort of survivors in order to provide new insight into the long term pathophysiology of the condition.
Methods
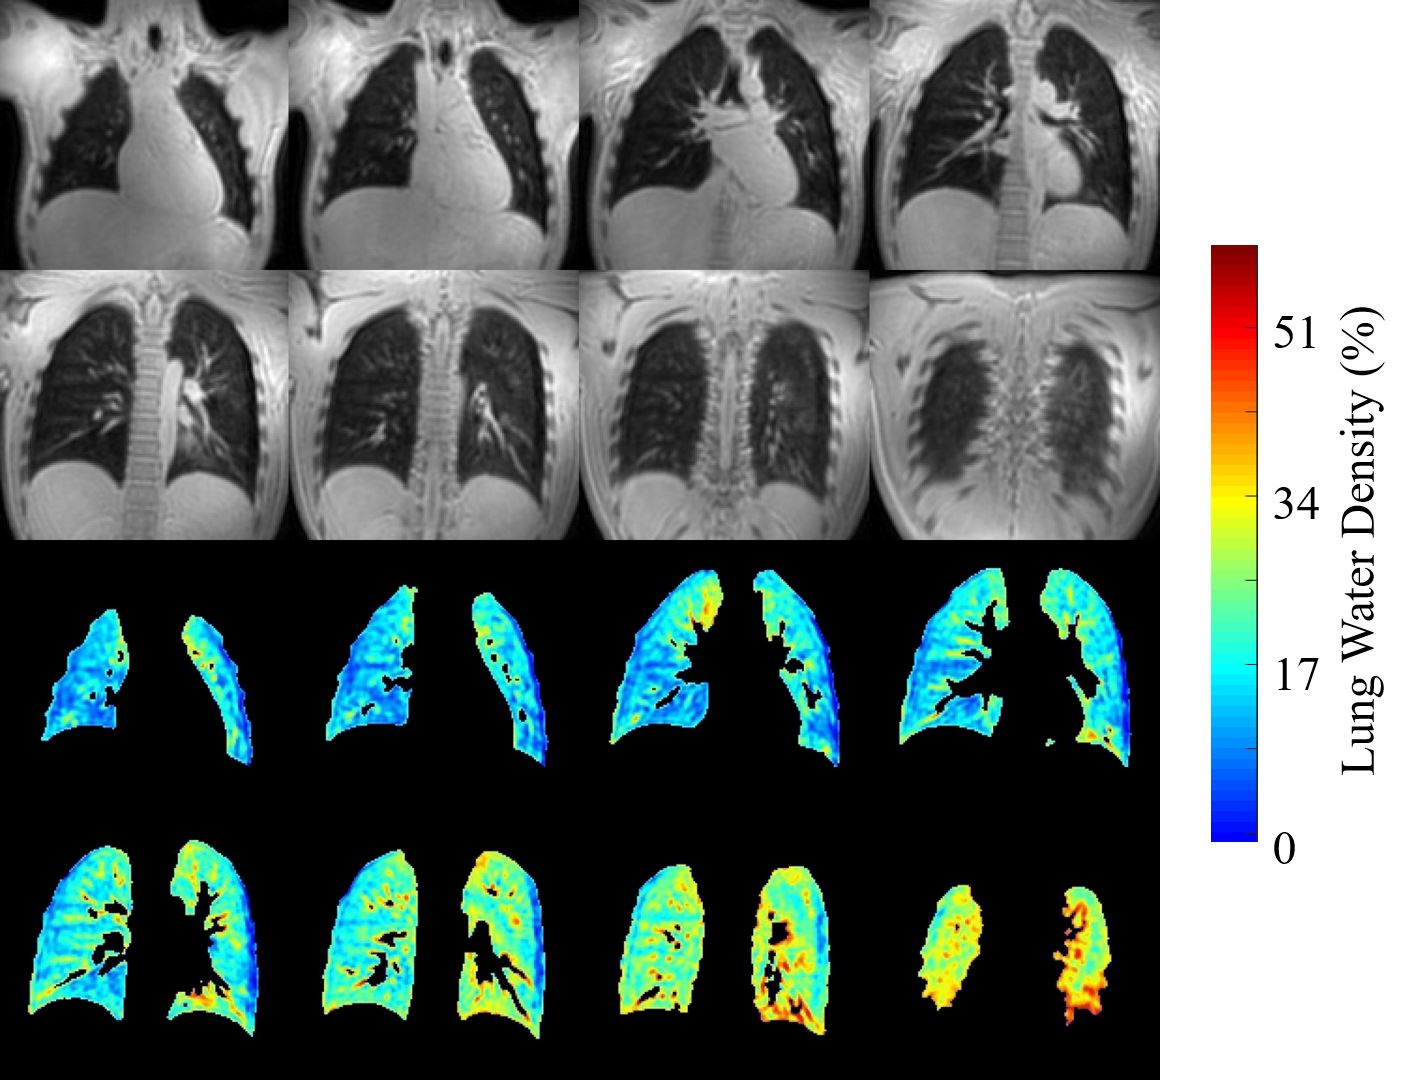
Study Participants – 187 subjects (mean 51.0 years, 64 male) were imaged ~5.4 months after COVID-19 recovery along with 91 healthy controls (mean 44.6 years, 30 male, no history of pulmonary, cardiovascular or neurological disease or COVID-19 infection).Image Acquisition/Processing – Three-dimension (3D) water-density weighted images were acquired using a custom Yarnball UTE pulse sequence8,9: 2738 arms, 350 mm FOV, 2.0mm isotropic reconstructed, TE=100ms, TR = 2.7ms, 2° flip, 82 seconds acquisition time (free-breathing, with reconstruction at functional residual capacity). Reconstructed 3D images were processed as previously described, using spatial normalization and signal referencing to convert intensity values to units of relative LWD (rLWD).9 Additionally, a convolutional neural network was used to segment parenchyma prior to quantification (Fig.1). Mean rLWD was calculated separately for each lung. rLWD images were assessed visually to identify regional patterns of elevated or reduced rLWD and global elevation of rLWD was identified by comparison to healthy control data (mean+1.96*std), separately for right and left lungs and with sex-specific analysis (Students t-test).
Results
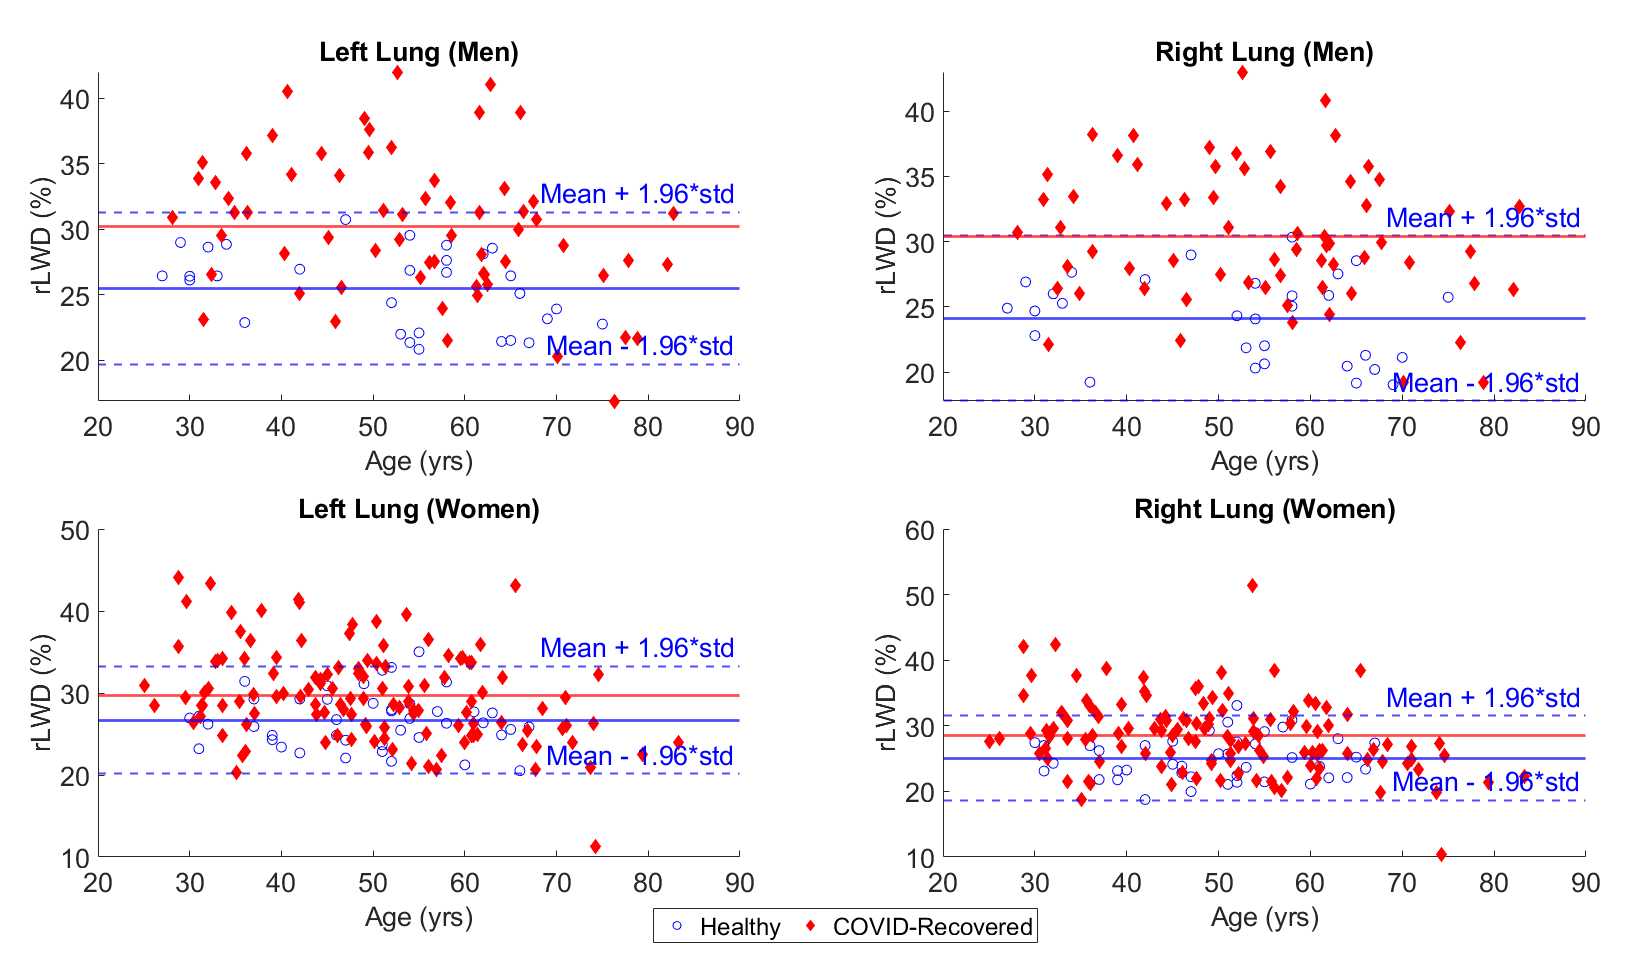
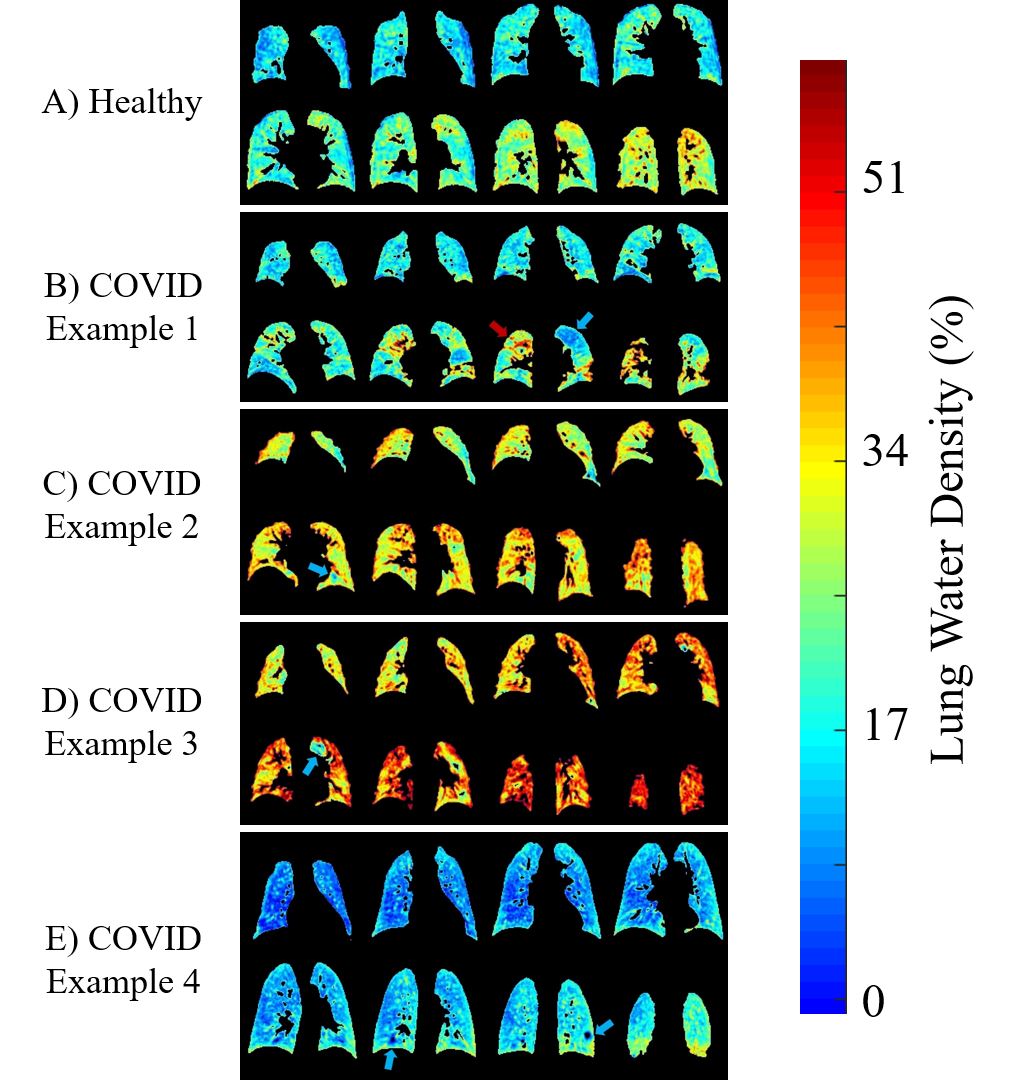
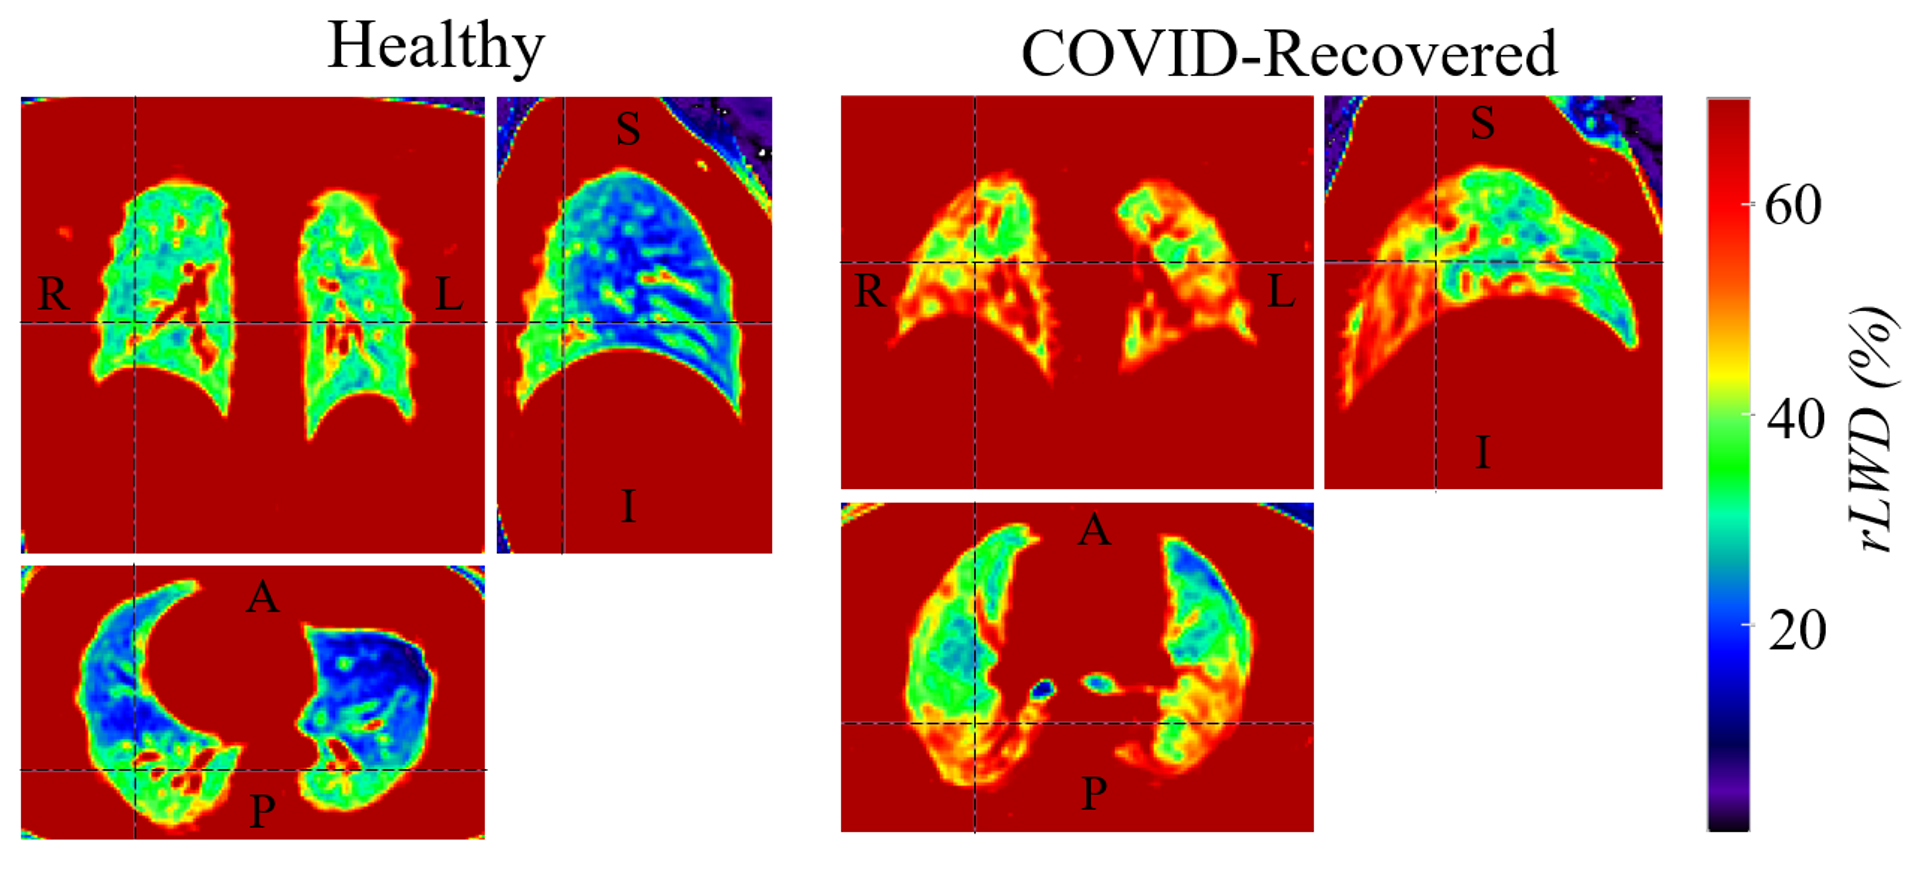
Fig. 1 and Fig. 3A show a typical rLWD image dataset (8 of ~ 100 slices shown) from healthy individuals, with values ranging from ~20% at the chest to ~40% at the back, and uniform signal within coronal planes. No significant differences were observed in rLWD between male and female controls in each lung (p>0.05) and presented as 25.5 ± 2.9% and 24.1 ± 3.2% (men) and 26.7 ± 3.4% and 25.6 ± 3.3% (women) for the left and right lungs, respectively (mean ± std). rLWD was significantly higher in the COVID-recovered group (p<0.05 for both men and women in both lungs), with 53 individuals (28.5%) and 60 individuals (32.3%) with elevated values in the left and right lungs, respectively (Fig. 2). Moreover, a greater proportion of male COVID-recovered group were observed to have elevated rLWD in both the left (39.1% of males) and right (45.3% of males) lungs than female participants (26.2% and 24.6% for left and right, respectively).Several distinct patterns of rLWD were observed in the COVID group, including: i) normal global water density but with patchy regions of signal elevation and reduction (Fig. 3B), ii) globally elevated rLWD with uniform signal from chest to back (Fig. 3C), iii) retention of the chest to back gradient but overall increased rLWD, often with patchy regions in the back (Fig. 3D) and in some cases, iv) globally reduced rLWD (Fig. 3E). A multiplane comparison of a healthy control and COVID-recovered individual can be found in Fig. 4.
Discussion
The mean rLWD of COVID-recovered patients was found to be significantly higher than that of a healthy control population with several distinct patterns of rLWD that distinguish this population from controls.The COVID-recovered group was observed to have a significantly higher mean rLWD than the healthy control group, however, the clinical significance of these findings is currently unknown. A small subset of patients do have the characteristic pattern of uniformly elevated rLWD seen in heart failure and thus may have underlying cardiogenic pulmonary edema7, in particular given the potential for cardiac pathology after COVID-19 recovery.1 The patchy regions of abnormally low rLWD seen in the COVID-recovered group potentially correspond to areas of low perfusion, which would be inline with previous hyperpolarized gas studies of COVID-19 recovered patients that have shown evidence of vascular remodelling, shunting, and pulmonary microembolism.5,6 Regions of patchy elevated rLWD may correspond to the commonly observed ground-glass opacities and consolidations from computed tomography images in this population.1
This study has shown that rLWD imaging with MRI (<90 seconds total acquisition time, 1H imaging, free-breathing) is sensitive to COVID-19 related lung damage, with the potential to combine relevant information of cardiac involvement from the same imaging session.
A limitation of the current study is the potential for pre-existing lung pathology prior to COVID infection.
Conclusions
This study demonstrates the feasibility of using MRI-derived rLWD imaging to detect post COVID-19 abnormalities in the lungs as well as the frequency of these abnormalities when compared to a healthy control population.Acknowledgements
No acknowledgement found.References
1. Nalbandian A, Sehgal K, Gupta A, et al. Post-acute COVID-19 syndrome. Nat Med. 2021;27(4):601-615.
2. Wang C, Li H, Xiao S, et al. Abnormal dynamic ventilation function of COVID-19 survivors detected by pulmonary free-breathing proton MRI. Eur Radiol. 2022;32(8):5297-5307.
3. Lévy S, Heiss R, Grimm R, et al. Free-Breathing Low-Field MRI of the Lungs Detects Functional Alterations Associated With Persistent Symptoms After COVID-19 Infection. Invest Radiol. 2022;57(11):742-751.
4. Li H, Zhao X, Wang Y, et al. Damaged lung gas exchange function of discharged COVID-19 patients detected by hyperpolarized 129Xe MRI. Sci Adv. 2021;7(1)
5. Grist JT, Collier GJ, Walters H, et al. Lung Abnormalities Depicted with Hyperpolarized Xenon MRI in Patients with Long COVID. Radiology. 2022:220069.
6. Matheson AM, McIntosh MJ, Kooner HK, et al. Persistent 129Xe MRI Pulmonary and CT Vascular Abnormalities in Symptomatic Individuals with Post-Acute COVID-19 Syndrome. Radiology. 2022;305(2):466-476.
7. Thompson RB, Chow K, Pagano JJ, et al. Quantification of lung water in heart failure using cardiovascular magnetic resonance imaging. J Cardiovasc Magn Reson. 2019;21(1):58.
8. Stobbe RW, Beaulieu C. Three-dimensional Yarnball k-space acquisition for accelerated MRI. Magnetic Resonance in Medicine. 2021;85(4):1840-1854.
9. Meadus WQ, Stobbe RW, Grenier JG, Beaulieu C, Thompson RB. Quantification of lung water density with UTE Yarnball MRI. Magnetic Resonance in Med. 2021;86(3):1330-1344.
Figures