1898
Free Breathing δUTE Sequence for T2* Mapping of Lung in Healthy and Post-COVID Adults
Vadim Malis1, Yoshimori Kassai2, Won Bae1,3, Diana Vucevic1, Yoshiharu Ohno4, and Mitsue Miyazaki1
1Radiology, UC San Diego, San Diego, CA, United States, 2Canon Medical, Ōtawara-shi, Japan, 3VA San Diego Healthcare System, San Diego, CA, United States, 4Fujita Health University, Toyoake, Japan
1Radiology, UC San Diego, San Diego, CA, United States, 2Canon Medical, Ōtawara-shi, Japan, 3VA San Diego Healthcare System, San Diego, CA, United States, 4Fujita Health University, Toyoake, Japan
Synopsis
Keywords: Pulse Sequence Design, Lung, UTE, Ultra-Short TE
δUTE sequence collects multiple closely spaced short TE (<2ms) echoes resulting in a more accurate T2* mapping of anatomies with short T2 time. Application to lungs reveals inhomogeneities in T2* maps in post-COVID-19 adults.Introduction
Unlike conventional MRI sequences, Ultra-short TE (UTE) imaging with an echo time of less than 0.1ms allows capturing signals from the anatomies with short $$$T_{2}^{*}$$$ in lungs. Multi-echo UTE sequence produces a set of images with different echo times required for $$$T_{2}^{*}$$$ mapping. However, shorter echo intervals in the multi-echo UTE are restricted due to the $$$dB/dt$$$ hardware limitations. To acquire these shorter TEs by shifting the first echo multiple times requires multiple separate acquisitions and takes a long scan time. To overcome this constraint, we’ve implemented δUTE sequence which allows for closely spaced short TE (<2ms) echoes. The sequence was validated on a phantom with the known $$$T_{2}^{*}$$$ values and applied to study the impact of COVID-19 on adults’ lungs.Methods
The δUTE sequence was implemented on a clinical 3T scanner (Vantage Galan, version 7, Canon Medical, Japan). The sequence varies the position of the first echo in short increments for the consecutive segments. A phantom study was carried out on a $$$T_{2}^{*}$$$ phantom (Calimetrix, Model 450, USA) with five short (4.44/3.62/2.27/1.89/1.05ms<5ms) inserts. The scanning protocol for the phantom study included: (i) a multi-echo UTE with six TEs=0.096/2.3/4.5/6.7/8.9/11.1ms, TR=14.7ms, NEX=1, FA=4°, FOV=25×25cm in the axial orientation and matrix size 256×256; additional echoes were acquired with (ii) δUTE with four TEs=0.34/0.74/1.14/1.54ms (δTE=0.4ms.). For both series, about eight thousand UTE lines were acquired, and the total scan time was 9 minutes. Two time-dependent signal curves (6 echoes from (i) only and 10 echoes from (i) and (ii)) were fitted into equation [Eq. 1] using the least squares method:$$S(t)=S(0)\cdot {\exp{(-t/\mathrm{T_2^*)}}} + S' \quad \quad \quad \quad \quad \quad \quad \quad \quad \quad \quad [Eq. 1]$$
The human study included two healthy (25 ± 3 years) and two post-COVID (31 ± 4 years) volunteers, scanned with informed consent. The scanning protocol was similar to the one used for the phantom with the addition of fat-suppression (five SPectral Adiabatic Inversion Recovery (SPAIR) pulses per 48 segments, ~1 pulse per 34 UTE lines). An extra series of 3D UTE without fat suppression (TE/TR=0.096/3.7ms, NEX=1, FA=5°) for an automated lung segmentation was acquired [1]. All series were collected using respiratory gating during expiration with a FOV=50×50cm in the coronal orientation. A time-dependent signal curve of 10 echoes was fitted using a mono-exponential model [Eq. 1] and a bi-exponential model [Eq. 2]:
$$S(t)=S_{s}(0)\cdot {\exp{(-t/\mathrm{T_{2s}^*)}}} +S_{l}(0)\cdot {\exp{(-t/\mathrm{T_{2l}^*)}}} + S' \quad \quad \quad [Eq. 2]$$
which provides more information on the fractions of tightly bound and unbounded water molecules by separating the signal into short $$$T_{2s}^{*}$$$ and long $$$T_{2l}^{*}$$$ components [2].
Results
Schematic pulse sequence diagrams of multi-echo UTE and δUTE are shown in Figures 1a and 1b, respectively. The position of the first echo in the δUTE sequence can be varied for the different segments within a single acquisition. In the diagram, the first echo is shown shifted by TE and possible nth shift $$$n·δTE$$$ is shown with dashed gradients and thinner line echo. Axial image of $$$T_{2}^{*}$$$ phantom with overlayed colored ROIs corresponding to the five short $$$T_{2}^{*}$$$ inserts is shown in Figure 2a. Figures 2b-k demonstrate all 10 echoes collected with multi-echo UTE (b, g-k) and δUTE (c-f). Note significant drops in signal intensities for ROIs 3 – 5 between TE=0.096 (b) and TE=2.3ms (g). These are consecutive first and second echoes of multi-echo UTE. δUTE echoes (c-f) in contrast provide a more gradual decrease in signal intensities allowing to estimate relaxation times with higher precision. Comparisons between six-echo and ten-echo fits for five phantom inserts are shown in Figure 3a-e. Six-echo fits are given in blue while ten-echo fits are given in red with δUTE echoes denoted with red squares. Discrepancies in the fits are best noticeable for inserts with $$$T_{2}^{*}$$$ of 2.27 and 1.89 ms. Figure 3f shows the plot of residuals between true and estimated $$$T_{2}^{*}$$$ values. Results of the human study are shown in Figure 4 colormaps: the top row for healthy and the bottom row for post covid subjects. The first column shows a single slice $$$T_{2}^{*}$$$ colormap for mono-exponential fit, bi-exponential fit colormaps with short and long $$$T_{2s,l}^{*}$$$ are shown in the second and third columns while the last column shows the fraction of $$$T_{2s}^{*}$$$. All the colormaps of healthy volunteers were more homogeneous compared to those of post-COVIDs.Discussion
Additional echoes close to the shortest of the UTE echoes result in a more accurate estimation of $$$T_{2}^{*}$$$ maps for tissues with short $$$T_{2}^{*}$$$. UTE images with high temporal echo time resolution were previously collected ex-vivo for various specimens and cadaveric tissues in tendon and knee [3] as well as in rodent lungs under anesthesia [4]. The current study shows the feasibility of $$$T_{2}^{*}$$$ mapping using δUTE imaging with high temporal echo time resolution on in-vivo human lungs.Conclusion
The δUTE sequence was implemented and tested on the short $$$T_{2}^{*}$$$ phantom. The sequence was successfully applied for lung imaging; the bi-exponential signal model fit may provide valuable insides into the COVID impact on human lungs in future studies.Acknowledgements
This work was supported by Canon Medical Systems, Japan (grant 35938).References
[1] Malis V., et al., in ISMRM (2021).[2] Biswas R., et al., Bone. 50(3), 749-55. (2012).
[3] Carl M, et al., Magn Reson Med. 76(2), 577-82 (2016).
[4] Takahashi M, et al., J Magn Reson Imaging. 32(2), 326-33 (2010).
Figures
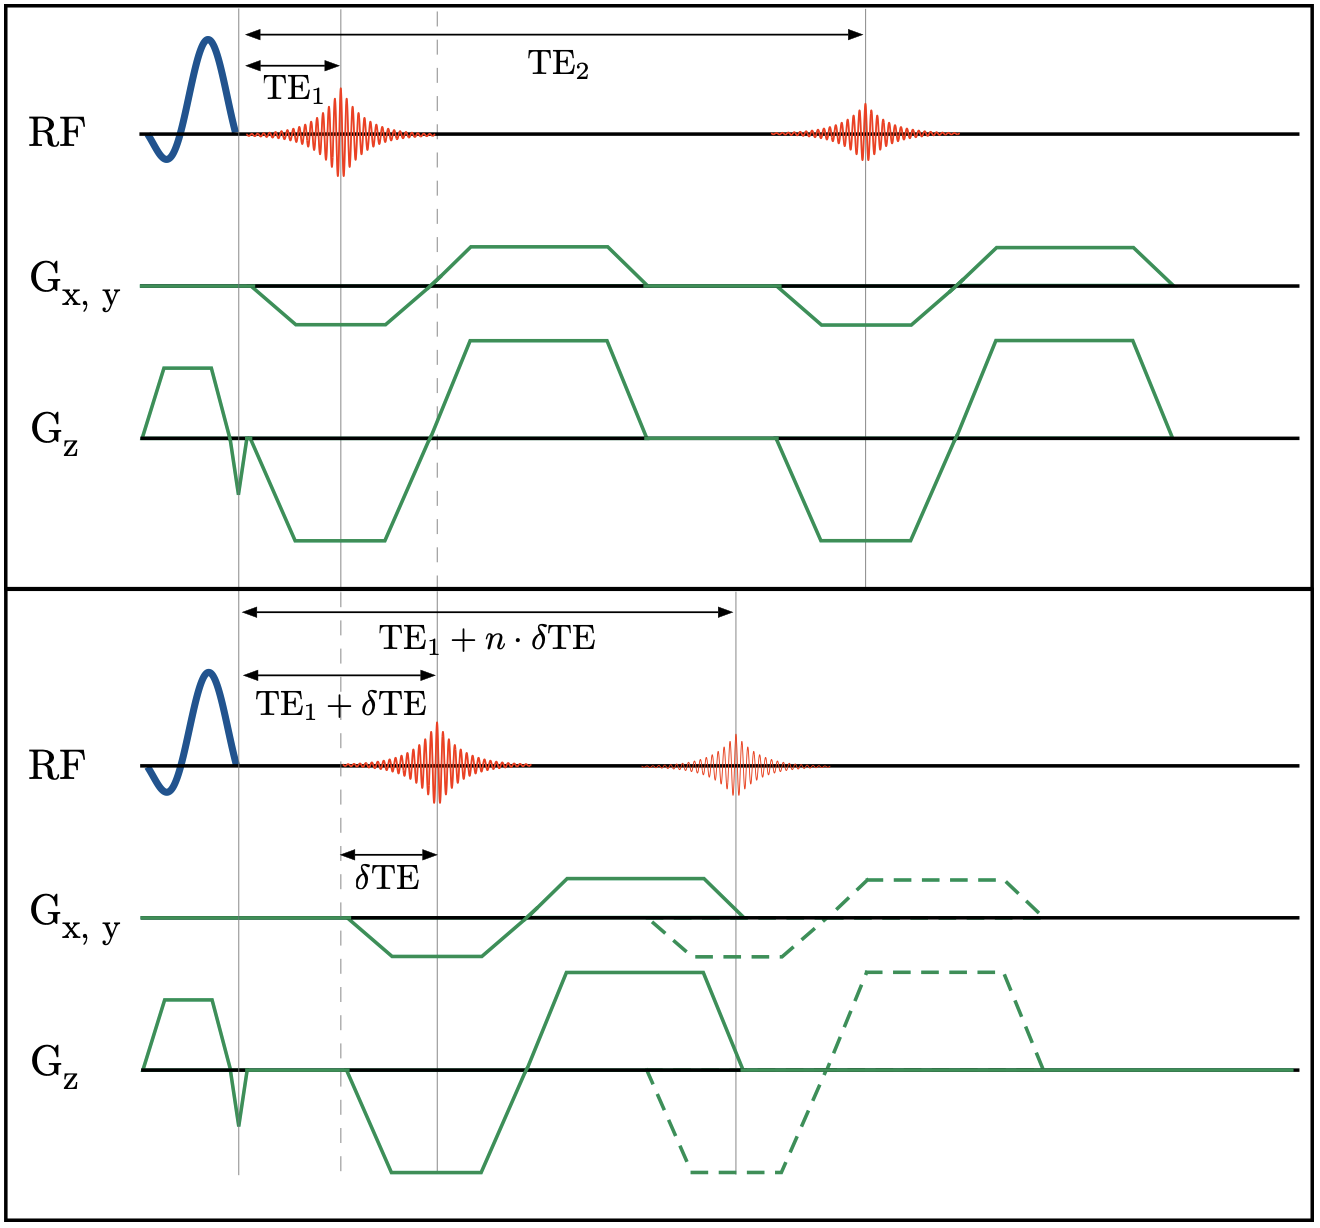
Figure 1: Schematic pulse sequence diagrams of multi-echo UTE and δUTE are shown in (a) and (b), respectively. The position of the first echo in the δUTE sequence can be varied for the different segments within a single acquisition. In the diagram, the first echo is shown shifted by $$$δ TE$$$ and a possible nth shift $$$n\cdot δ TE$$$ is shown with dashed gradients and thinner line echo.
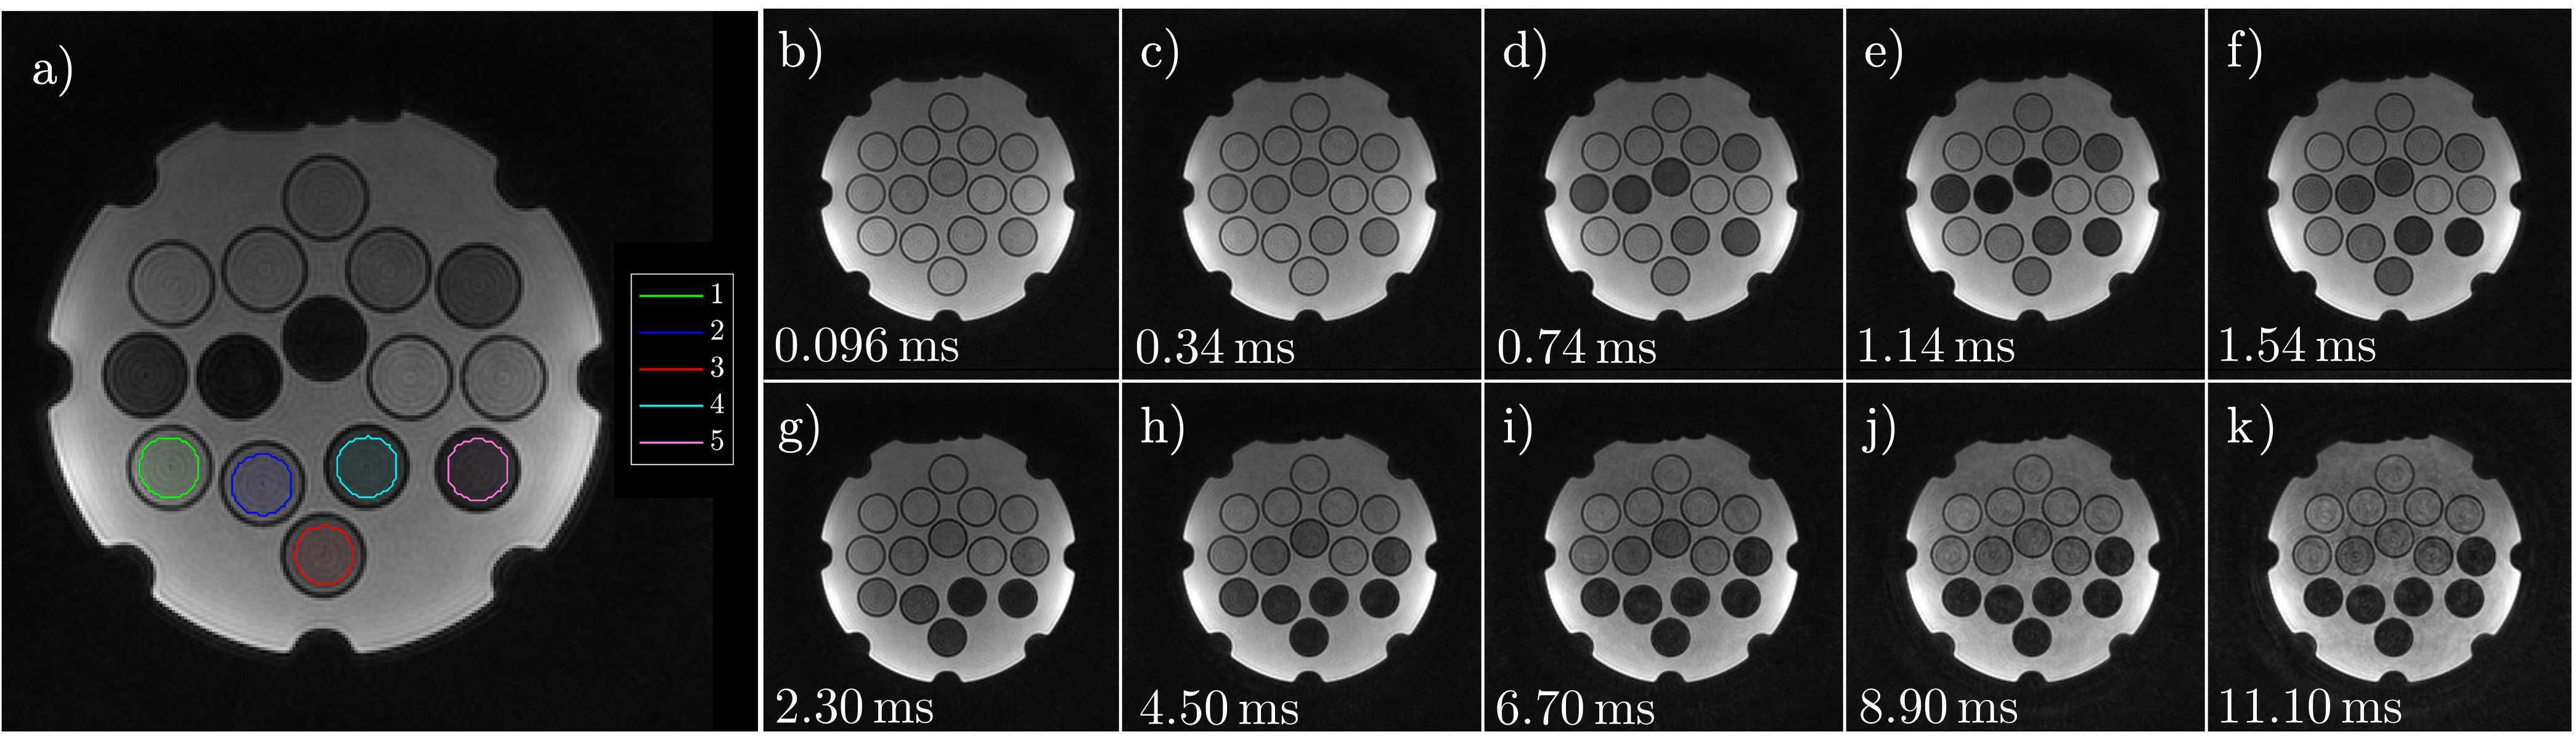
Figure 2: Axial image of $$$T_{2}^{*}$$$ phantom with overlayed colored ROIs corresponding to the five short $$$T_{2}^{*}$$$ inserts is shown in (a). Figures 2b-k demonstrate all 10 echoes collected with multi-echo UTE (b, g-k) and δUTE (c-f ). Note significant drops in signal intensities for ROIs 3 – 5 between TE=0.096 (b) and TE=2.3ms (g).
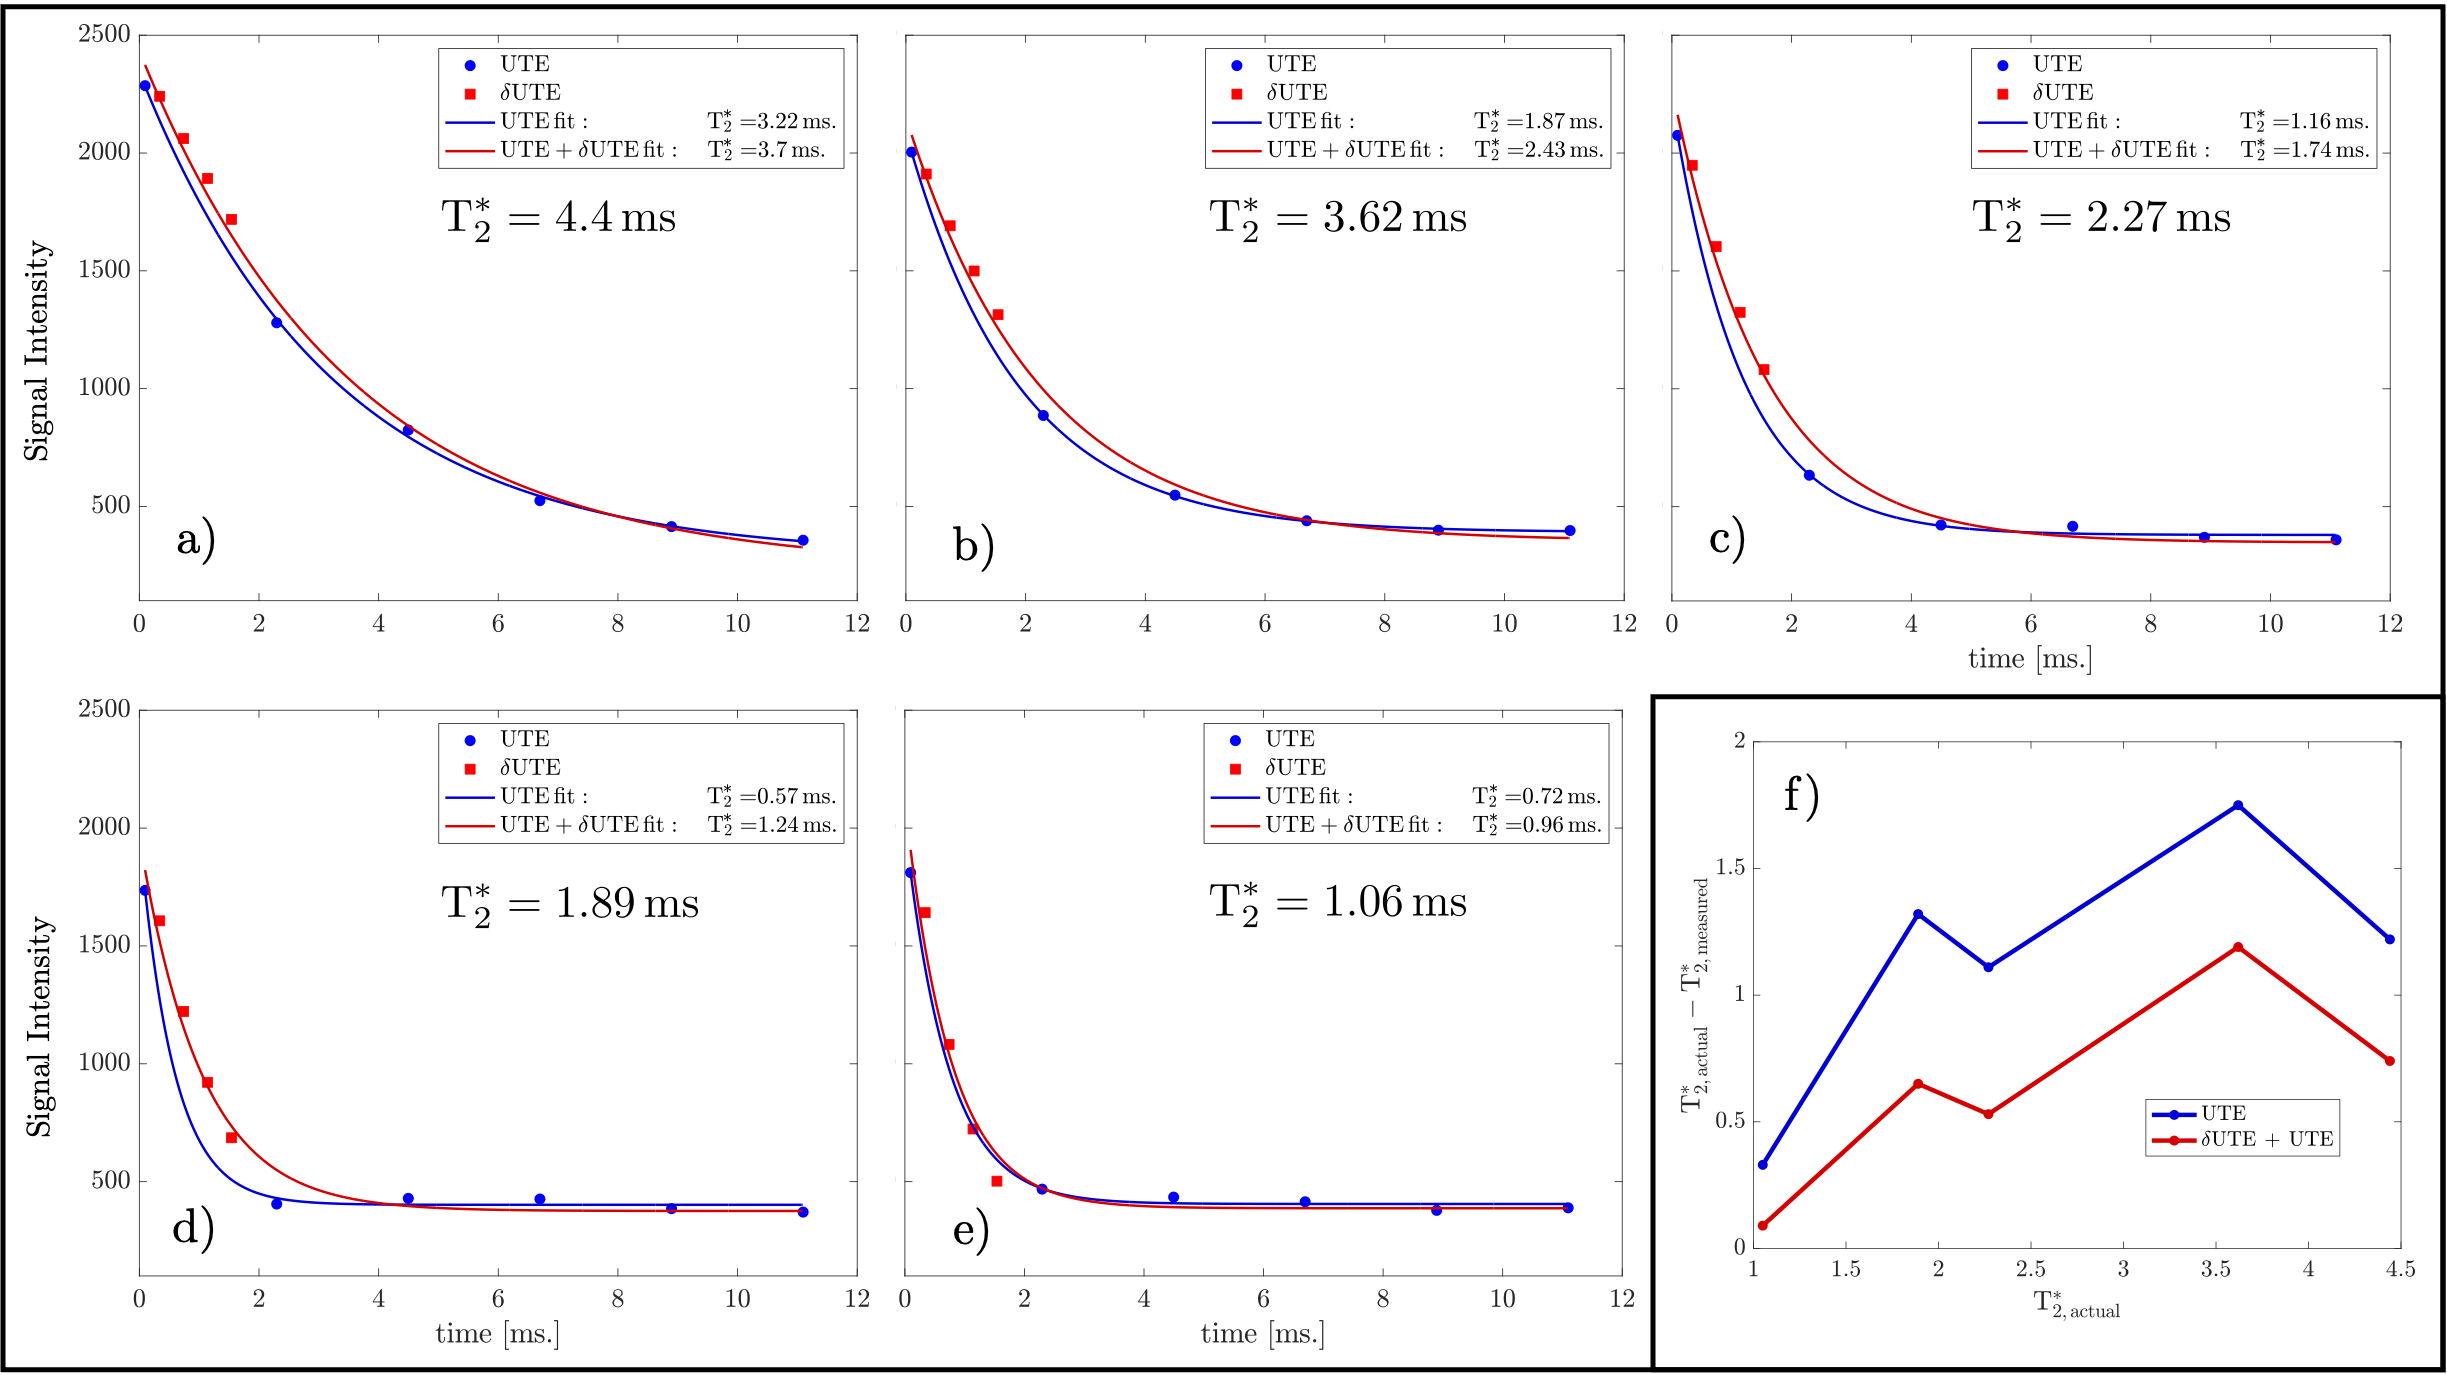
Figure 3: Comparisons between six echo and ten echo fits for five phantom inserts (a-e). Six-echo fits are given in blue while ten-echo fits are given in red with δUTE echoes denoted with red squares. Discrepancies in the fits are best noticeable for inserts with $$$T_{2}^{*}$$$ of 2.27 and 1.89ms. The plot of residuals between true and estimated $$$T_{2}^{*}$$$ values (e).
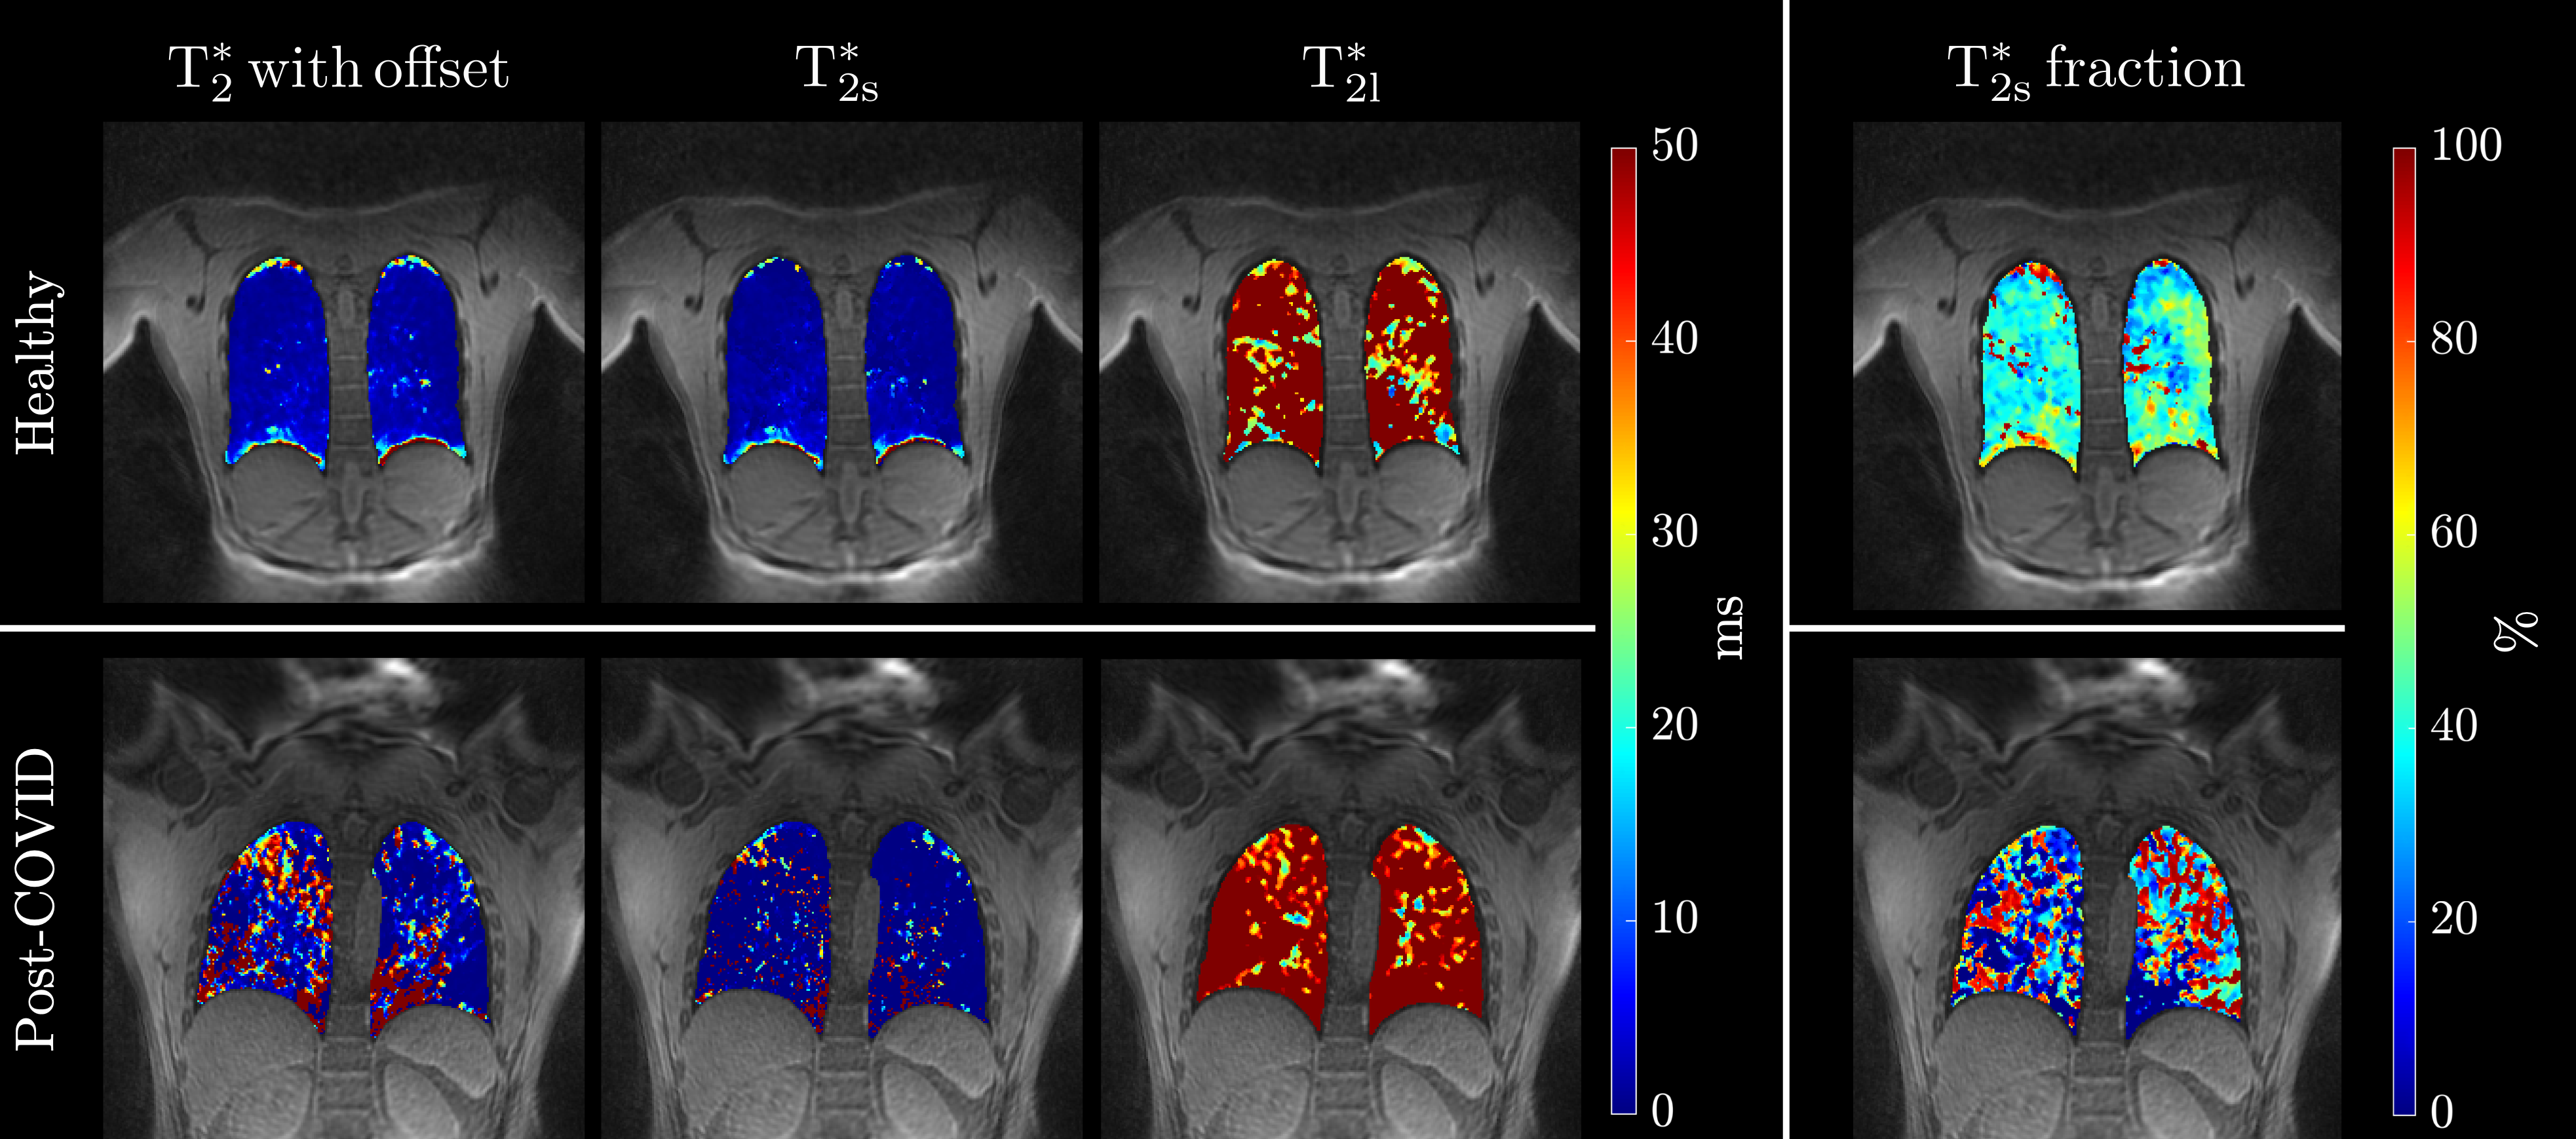
Figure 4: Estimated $$$T_{2}^{*}$$$ lung colormaps for healthy (top row) and post-COVID (bottom row) adults. The first column shows a single slice $$$T_{2}^{*}$$$ colormap for mono-exponential fit, bi-exponential fit colormaps with short and long $$$T_{2}^{*}$$$ are shown in the second and third columns while the last column shows the fraction of $$$T_{2s}^{*}$$$.
DOI: https://doi.org/10.58530/2023/1898