1897
Towards an optimal breast lesions predictive model by assessing different MRI protocols’ combinations: Radiomics analysis1Quantitative MR Imaging and Spectroscopy Group, Tehran University of Medical Sciences, Tehran, Iran (Islamic Republic of), 2Shiraz University, Shiraz, Iran (Islamic Republic of), 3Shahed University, Tehran, Iran (Islamic Republic of), 4Tehran university, Tehran, Iran (Islamic Republic of), 5Department of Medical Physics and Biomedical Engineering, Tehran University of Medical Sciences, Tehran, Iran (Islamic Republic of)
Synopsis
Keywords: Multimodal, Breast
This study aimed to assess added value of various combinations of different MRI protocols and artificial intelligence techniques in differentiation capability between malignant and benign breast lesions. 61 benign and 69 malignant lesions were recruited. Radiomics features were extracted from three proposed scenarios, including original images of ADC and T2W (scenario-I), original images of ADC, T2W, and DCE (scenario-II), and the joint of original and the pre-filtered images (using wavelet) from ADC, T2W and DCE (scenario-III). Ten most relevant features were utilized for training 11 machine learning algorithms. Finally, decision tree achieved the highest results of accuracy using scenario-III.Introduction:
Discriminating between benign and malignant breast lesions has an important role in the management of breast cancer to decrease invasive procedures and unnecessary biopsies1. Currently, BI-RADS provides standard evaluations for reporting MRI detections using the typical MRI protocol, i.e., dynamic contrast-enhanced (DCE) and T2-weighted (T2W) 2. It has been shown that due to the similarities in the benign and malignant lesions’ descriptors using the standard protocol, the specificity decreases. Previous research has shown the effectiveness of adding apparent diffusion coefficient (ADC) extracted from diffusion-weighted imaging (DWI) in increasing the specificity 3. Radiomic features extracted from multiparametric-MRI (mp-MRI) make the possibility to capture the lesions’ properties, such as kinetic, texture, shape, etc. to encode some patterns which are not detectable by the human eye 4. The integration of radiomics features with supervised machine learning models provides the possibility of automatic diagnosis with lower false positive rates 5,6. Developing a robust classification model needs an appropriate feature vector as input, which is meaningful for the machine and precisely represents the differentiation between malignant and benign tumors’ patterns. In the current study, we explored the diagnostic performance of radiomics analysis using eleven machine learning algorithms and three different mp-MRI scenarios to reveal the influence of each scenario in discriminative efficiency and subsequently improve the diagnosis performance.Materials and Methods:
Study population: In this study, the dataset involved mp-MR images of 130 histopathology-confirmed breast lesions from 130 females including 61 benign and 69 malignant with mean ages of 40.41 ± 9.05 and 47.97 ± 9.07 years, respectively. The mp-MR images consisted of T2W sequence, DCE, and ADC measured from DWI sequence. The imaging was performed at Athari medical imaging center (Tehran, Iran) using a 1.5 T GE MRI scanner through the years 2020 and April 2022.Methodology: Two expert radiologists defined the tumor mask over the lesions on images of all modalities of each patient in a slice that has covered the greatest area of the tumor using 3D Slicer software 7. Before extracting radiomic features, we excluded the outliers from pixel values, as specified by the indicator µ±3σ. N4 bias field correction was implemented on all T2W images to compensate for the intensity non-heterogeneity 8. Then, radiomics features were extracted using Pyradiomics package version 3.0 9. From the original images of each modality, 9 2D shape, 18 first-order, 24 GLCM, 16 GLRLM, 16 GLSZM, 14 GLDM, and 5 NGTDM features were extracted. Notably, since the computation of shape features is based on the shape and margin of lesions, shape features’ extraction was only applied to T2W images to avoid producing redundant features and subsequently misleading information. We explored the effectiveness of different combinations of adopted images, including T2W, ADC map, and quantitative pharmacokinetic parameter maps DCE (DCE-PKPM) i.e., Ktrans, Kep, and Ve in the differentiation of benign and malignant lesions by specifying three scenarios. Scenario-I contains original images of sequences ADC and T2W, scenario-II includes original images of ADC, T2W, and DCE, and scenario-III is the joint of original and the pre-filtered images (using wavelet) from ADC, T2W, and DCE. After feature extraction and concatenating, the ten most relevant features were nominated using recursive feature elimination (RFE) algorithm. The nominated features feed into eleven classifiers to assess their discriminative performance.
Results:
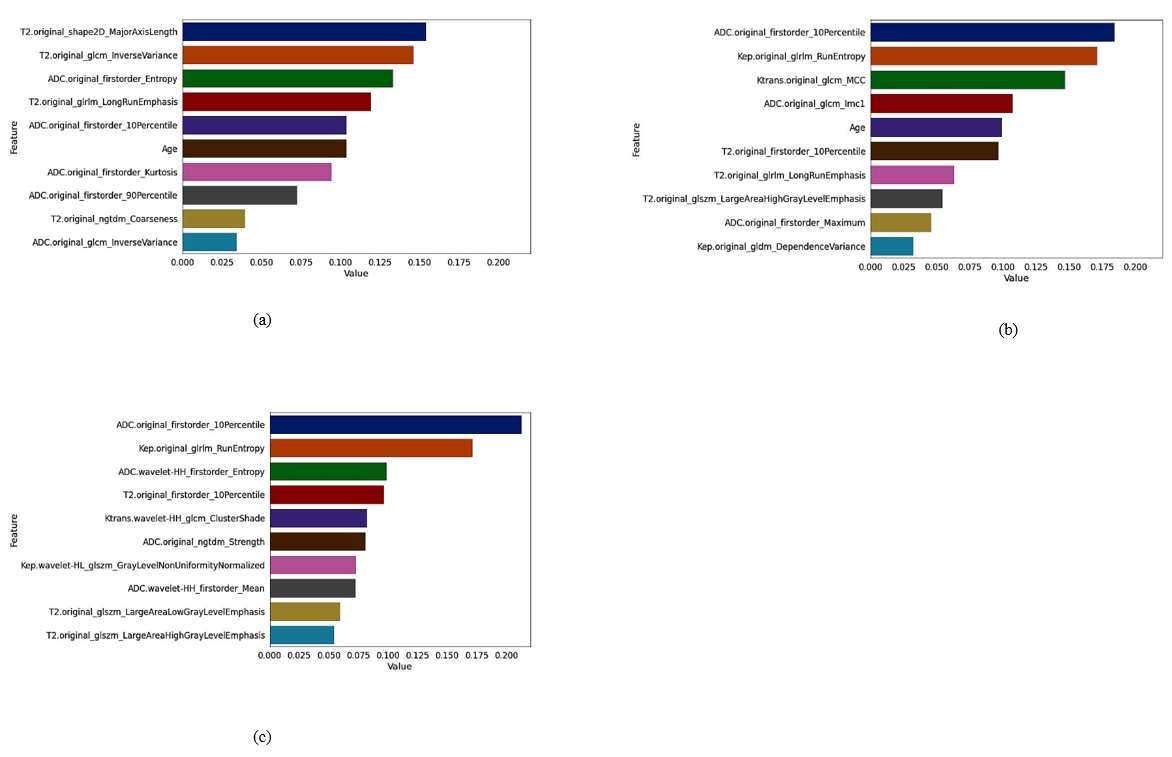
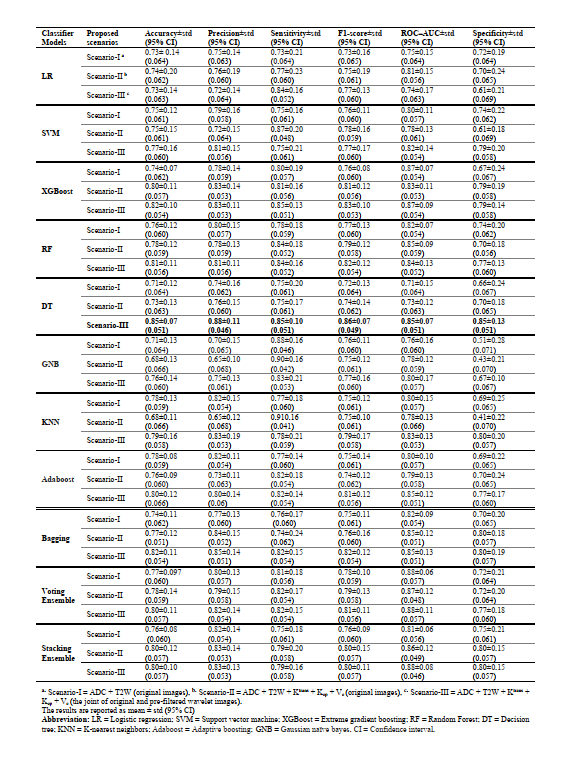
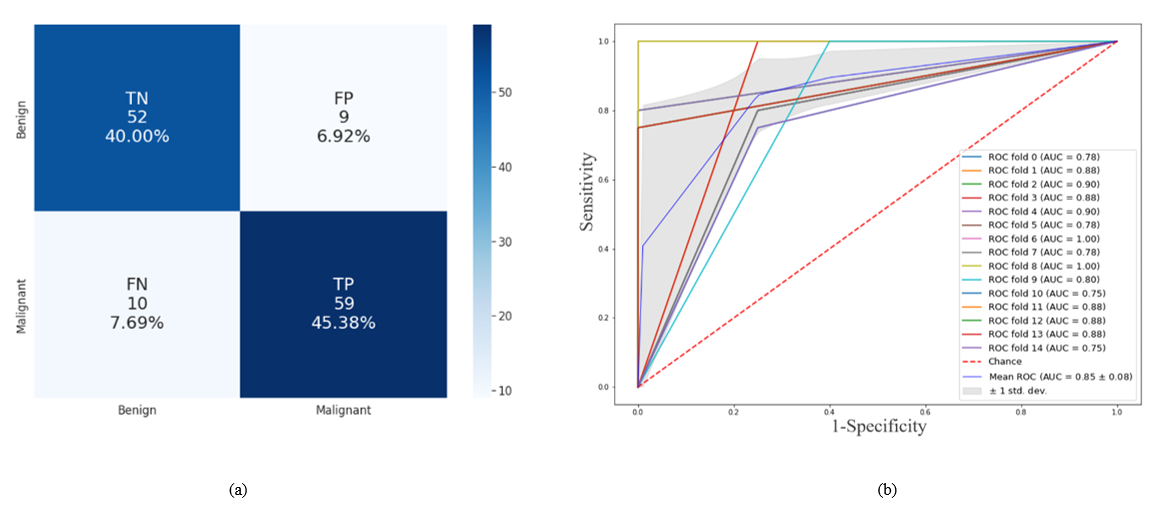
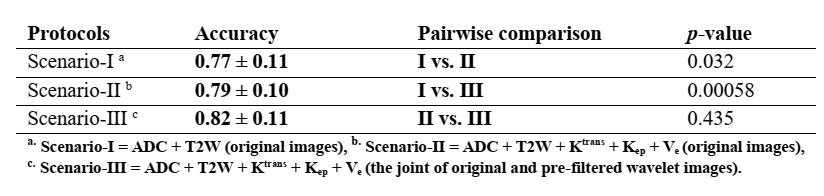
The importance of ten most relevant features nominated by RFE for scenario-I, scenario-II, and scenario-III are illustrated in Figures 1a, 1b, and 1c, respectively. The results of mean evaluation metrics along with their standard deviation over a 15-fold cross-validation scheme are listed in Table 1. The confusion matrix and the ROC curve of the optimal model (i.e., scenario-III using DT classifier) are illustrated in Figures 2a and 2b, respectively. The RF accuracies resulted using features extracted from three defined scenarios through 600 iterations and also the p-values of the pairwise statistical comparisons between the accuracy achieved by RF classifier are listed in Table 2.Discussion:
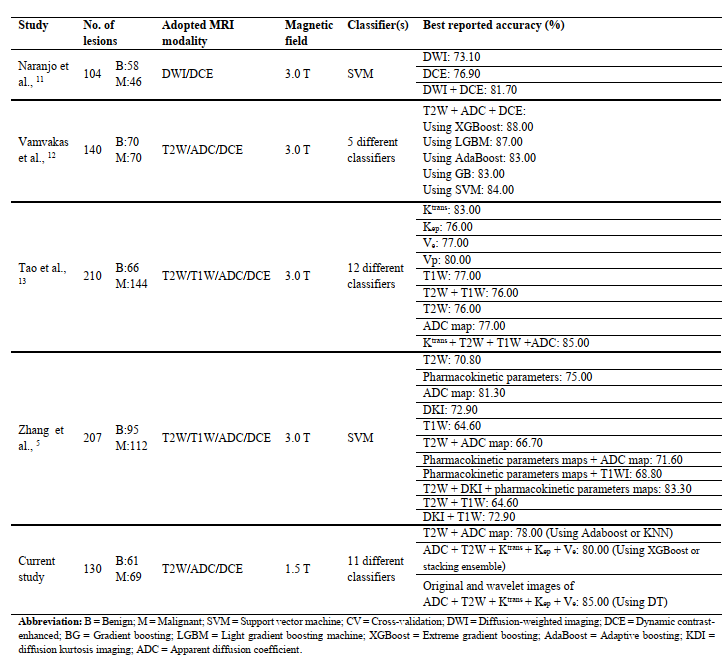
Novel evidence was provided in the current study regarding the positive impact of combining original and wavelet-based filtered images of T2W, ADC map, Ktrans, Kep, and Ve in improving breast cancer diagnosis performance. The obtained finding proves the increasing differentiation capability of the ML algorithms using quantitative DCE-PKPM, compared with utilizing the combination of T2W and ADC images. We found this obtained result in line with previous research 5, where it has been demonstrated that the features of DCE-PKPM had a major contribution to the proposed optimal radiomics model. In addition, incorporating the wavelet images with the original ones significantly enhanced the discriminative efficiency, by providing different spatial frequencies of the lesion texture pattern and valuable descriptive information about benign and malignant breast lesions that are informative and meaningful for artificial intelligence-based classifiers to encode the lesions’ patterns 10. Finally, we listed the comparison results of our study with some previously published works in Table 3.Conclusion:
This study evaluated the impact of radiomics features extracted by three different strategies of MRI sequences combination using eleven classifiers and six performance metrics on the diagnosis performance of breast lesions. The obtained results prove the important role of quantitative DCE-PKPM and the positive influence of the wavelet filter in improving the differentiation results.Acknowledgements
No acknowledgement found.References
1. Sheth D, Giger ML. Artificial intelligence in the interpretation of breast cancer on MRI. Journal of Magnetic Resonance Imaging. 2020;51(5):1310-1324.
2. Zhang M, Horvat JV, Bernard‐Davila B, et al. Multiparametric MRI model with dynamic contrast‐enhanced and diffusion‐weighted imaging enables breast cancer diagnosis with high accuracy. Journal of Magnetic Resonance Imaging. 2019;49(3):864-874.
3. Zhu C-R, Chen K-Y, Li P, Xia Z-Y, Wang B. Accuracy of multiparametric MRI in distinguishing the breast malignant lesions from benign lesions: a meta-analysis. Acta Radiologica. 2021;62(10):1290-1297.
4. Gullo RL, Eskreis-Winkler S, Morris EA, Pinker K. Machine learning with multiparametric magnetic resonance imaging of the breast for early prediction of response to neoadjuvant chemotherapy. The Breast. 2020;49:115-122.
5. Zhang Q, Peng Y, Liu W, et al. Radiomics based on multimodal MRI for the differential diagnosis of benign and malignant breast lesions. Journal of Magnetic Resonance Imaging. 2020;52(2):596-607.
6. Meyer‐Base A, Morra L, Tahmassebi A, Lobbes M, Meyer‐Base U, Pinker K. AI‐Enhanced Diagnosis of Challenging Lesions in Breast MRI: A Methodology and Application Primer. Journal of Magnetic Resonance Imaging. 2021;54(3):686-702.
7. Fedorov A, Beichel R, Kalpathy-Cramer J, et al. 3D Slicer as an image computing platform for the Quantitative Imaging Network. Magnetic resonance imaging. 2012;30(9):1323-1341.
8. Tustison NJ, Avants BB, Cook PA, et al. N4ITK: improved N3 bias correction. IEEE transactions on medical imaging. 2010;29(6):1310-1320.
9. Van Griethuysen JJ, Fedorov A, Parmar C, et al. Computational radiomics system to decode the radiographic phenotype. Cancer research. 2017;77(21):e104-e107.
10. Chitalia RD, Kontos D. Role of texture analysis in breast MRI as a cancer biomarker: a review. Journal of Magnetic Resonance Imaging. 2019;49(4):927-938.
11. Daimiel Naranjo I, Gibbs P, Reiner JS, et al. Radiomics and machine learning with multiparametric breast MRI for improved diagnostic accuracy in breast cancer diagnosis. Diagnostics. 2021;11(6):919.
12. Vamvakas A, Tsivaka D, Logothetis A, Vassiou K, Tsougos I. Breast Cancer Classification on Multiparametric MRI–Increased Performance of Boosting Ensemble Methods. Technology in Cancer Research & Treatment. 2022;21:15330338221087828.
13. Tao W, Lu M, Zhou X, et al. Machine learning based on multi-parametric MRI to predict risk of breast cancer. Frontiers in oncology. 2021;11:570747.
Figures