1896
Pre-Clinical MRI radiomics and machine learning to predict survival after immunotherapy treatment
Vlora Riberdy1, Alessandro Guida2,3, James Rioux1,2,3, and Kimberly Brewer1,2,3,4,5
1Physics and Atmospheric Science, Dalhousie University, Halifax, NS, Canada, 2Diagnostic Radiology, Dalhousie University, Halifax, NS, Canada, 3Biomedical MRI Research Laboratory, Nova Scotia Health Authority, Halifax, NS, Canada, 4School of Biomedical Engineering, Dalhousie University, Halifax, NS, Canada, 5Microbiology & Immunology, Dalhousie University, Halifax, NS, Canada
1Physics and Atmospheric Science, Dalhousie University, Halifax, NS, Canada, 2Diagnostic Radiology, Dalhousie University, Halifax, NS, Canada, 3Biomedical MRI Research Laboratory, Nova Scotia Health Authority, Halifax, NS, Canada, 4School of Biomedical Engineering, Dalhousie University, Halifax, NS, Canada, 5Microbiology & Immunology, Dalhousie University, Halifax, NS, Canada
Synopsis
Keywords: Molecular Imaging, Radiomics
Molecular MRI allows for immunotherapy treatment monitoring of glioblastoma, but analysis of multi-parametric data is complex. Machine learning algorithms can be applied to quantitative maps, to identify correlations between radiomic features and treatment outcomes. Feature selection is key when dealing with longitudinal preclinical data with multiple contrasts and small group numbers. We evaluated three feature selection methods in terms of their ability to produce predictive models of survival. The best performance was seen using recursive feature elimination applied to features from iron concentration maps of the tumor, which yielded an ROC AUC of 0.78 and an accuracy of 0.72.Introduction
Glioblastoma is an aggressive form of brain cancer. Even after treatment with surgical resection followed by radiation and/or chemotherapy, survival is typically less than a year after diagnosis1, with a two-year survival rate of 26-33%2. The use of novel immunotherapies in combination with temozolomide (TMZ) chemotherapy has shown promise for glioblastoma1,2, but more study is needed. Molecular magnetic resonance imaging (MRI) allows for treatment monitoring via longitudinal characterization of the tumour micro-environment. Magnetic Resonance Fingerprinting (MRF) is a specialized MR sequence capable of simultaneous T1, T2, and T2* relaxation measurements3. With these parameter maps we can simultaneously quantify the concentration of gadolinium (Gad) and superparamagnetic iron-oxide (SPIO) based agents (figure 1).With such a large amount of quantitative imaging data, analysis becomes more complex. A radiomics approach can simplify the task by representing a large multi-dimensional set of images with a much smaller set of engineered features4,5. Machine learning algorithms can then be applied to build a predictive model for treatment outcomes. We can apply binary classifiers to the data based on survival metrics to determine if any features can be used as early markers of treatment success. However, the longitudinal nature of preclinical data combined with a small sample size and multiple contrasts means that feature selection and model generation must be approached carefully.
Methods
Fifteen female mice C57BL/6 mice (5 mice/treatment group) were intracranially implanted with 5x10⁴ gl261 glioma cells. Treatment groups were as follows: 1) untreated/control, 2) treated with anti-PD-1 (200 μg/kg/mouse/dose every 3 days for up to 8 doses) or 3) treated with anti-PD-1 and TMZ (25 μg/kg/mouse/day for 10 days). Mice received MRI brain scans twice weekly (pre- and post-contrast) for up to 6 weeks using a 3T preclinical Agilent MRI (MenloPark, CA, USA). Scans included an anatomical T2-weighted fast-spin echo (FSE) (TE = 60 ms, ETL = 16) and MRF (which generated T1, T2, T2*, gadolinium and iron concentration maps) (TE = 5-10 ms, TR = 16-20 ms, FA = 20-60°, 0.6 mm slice thickness, resolution = 150 µm x 150 µm x 150 µm). Mice received an injection of 100 μL SPIO Rhodamine B (Biopal) 24 hours before the post-contrast scan and injections of MultiHance (gadobentate dimeglumine, Bracco) during the post-contrast scan prior to MRF imaging. Iron concentration maps were converted to cellular density maps of SPIO-labeled macrophages (cell/mm3) using a standardized curve based on in vitro data. Regions of interest (ROIs) were drawn outlining the whole brain (whole brain ROI) and tumour (tumour ROI) contours for each mouse using VivoQuantTM. at each time point.The PyRadiomics python package was used to extract 107 features per image volume. Three different feature selection methods were tested with the model: a univariate ANOVA f-test, feature importance by Random Forest (RF) and Recursive Feature Elimination (RFE) with a decision tree core. The top 15 features from each approach were input into the model separately. We also input all features into the model for comparison. These features were then passed into a logistic regression model with a binary classifier related to the survival endpoint. This classifier stated whether a subject survived to the study endpoint or not (class 1 = survived, class 0 = did not survive). A leave-one-mouse-out cross-validation method was used to evaluate the model. With cross-validation, the ANOVA and RFE methods choose a different set of features at each iteration for each training set. Performance metrics included accuracy and area under the receiver operating characteristic curve (ROC AUC). We compared performance of each of the 6 scan types (FSE, T1, T2, T2*, iron map, Gd map) separately, with all imaging time points pooled. We also compared results between the 2 ROIs.
Results
Figure 2 shows a heatmap of the feature rank using Random Forest; features with lower rank are more important. Feature importance varies between scan type and ROI, and while shape features (i.e. tumor size) are commonly correlated with outcome, some texture-based features are also important. The set of selected features varies depending on the selection method; with ANOVA and RFE, there were some differences in the chosen features for each cross-validation iteration. Figure 3 shows heat maps of ROC AUC and accuracy for the different scan types, feature selection methods and ROIs. The best performance was seen with the iron concentration/macrophage density map of the tumour ROI using RFE (ROC AUC = 0.78, accuracy = 0.72).Discussion and Conclusion
In this preliminary study, we examined the use of radiomics and machine learning on preclinical MRI data to predict survival outcomes in female mice treated for glioblastoma. This is still an exploratory process to probe the complex data. The multiparametric and longitudinal nature of the preclinical data poses challenges in organizing the data for model input. Further exploration needs to be done to determine the optimal number of features to use in the model, as well as hyperparameter optimization. We will also study subsets of longitudinal data to look at changes in features over time and expanding this methodology to studies done with male mice to explore potential sex-based differences.Acknowledgements
Vlora Riberdy is a trainee in the Cancer Research Training Program of the Beatrice Hunter Cancer Research Institute, with funds generously provided by the Canadian Cancer Society’s JD Irving, Limited – Excellence in Cancer Research Fund. Dr. Brewer would also like to acknowledge funds received from NSERC’s Discovery Grant program, and the INOVAIT program.References
1. Walid M et al. Prognostic Factors for long-term survival after glioblastoma. Perm J. 2008;12(4).
2. Fernandes C et al. Current standards of care in glioblastoma. In: Glioblastoma. Codon Publications. 2017;197-241.
3. Marriott A, et al. Simultaneous quantification of SPIO and gadolinium contrast agents using MR fingerprinting. MRI. 2021;79:121-129.
4. Gillies RJ, Kinahan PE, Hricak H. Radiomics: Images are more than pictures, they are data. Radiology. 2016:278:563-577.
5. Kniep HC, Madesta F, Schneider T, Hanning U, Schonfeld MH, Schon G, Fiehler J, Gauer T, Werner R, Gellissen S. Radiomics of brain MRI: utility in prediction of metastatic tumor type. Radiology. 2019;290:479-487.
Figures
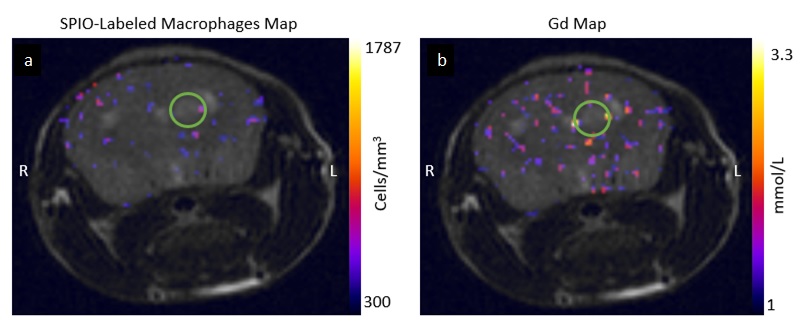
Examples of an (a) SPIO-labeled
macrophage map (measured as cells/mm3) and (b) gadolinium
concentration map (measured in mmol/L) generated from MRF scans overlayed on
the corresponding FSE image of a single mouse. The green circles indicate approximate
tumour location.
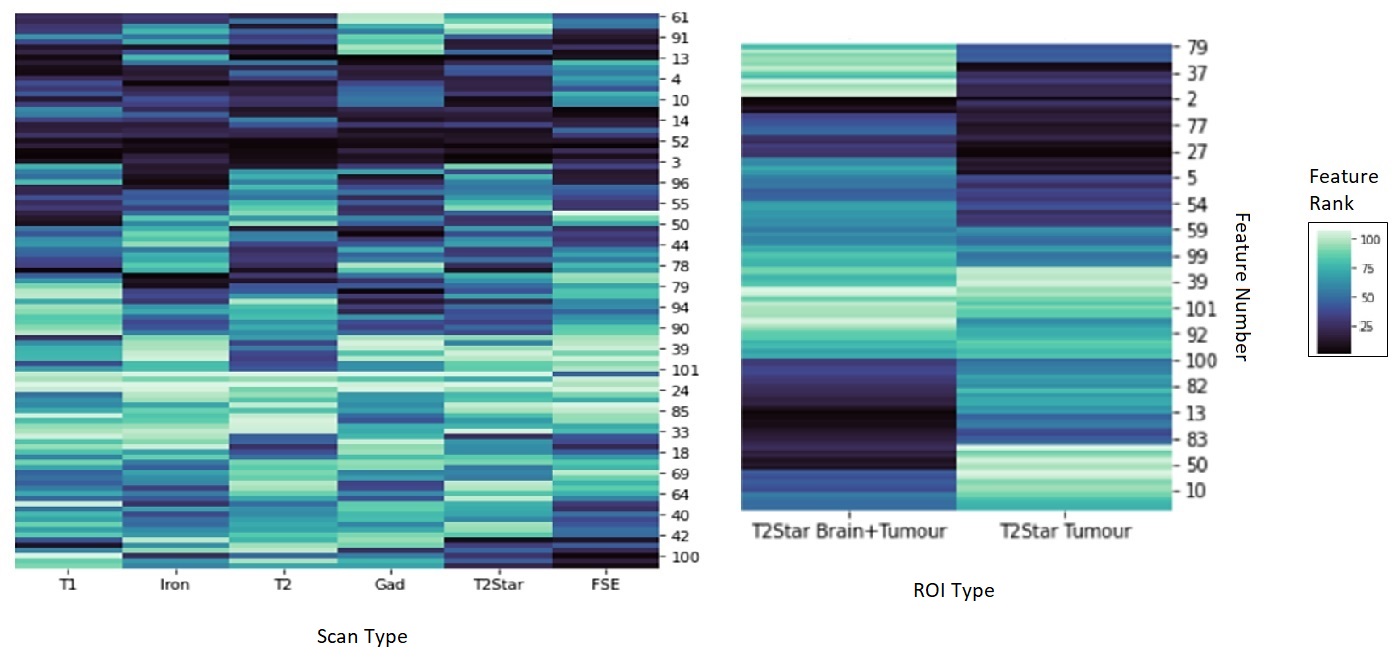
Ranked features from the Random Forest feature selection model for each
scan type (left) and each ROI for the T2* scan type
(right). Smaller ranks mean higher feature importance (darker colour). The
y-axis is feature number in no particular order.
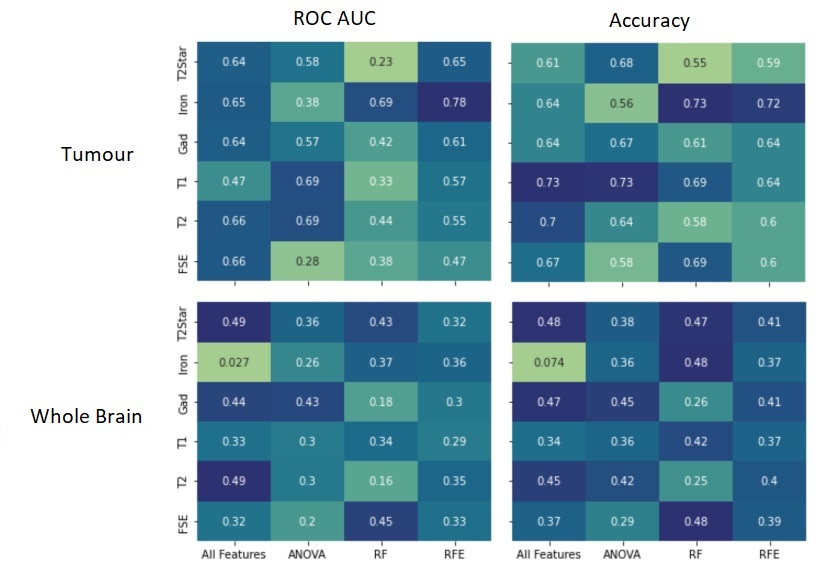
Heat maps of ROC AUC (left
column) and accuracy (right column) for the different scan types and feature
selection methods for the tumour ROI (top row) and whole brain ROI (bottom
row).
DOI: https://doi.org/10.58530/2023/1896