1893
Multi-Modal Detection and Localization of Intracranial Aneurysms using 3D nnDetection Deep Learning Model1University of Washington, SEATTLE, WA, United States, 2Peking University Cancer Hospitals & Institution, Beijing, China, 3Department of Radiology, University of Washington, Seattle, WA, United States
Synopsis
Keywords: Machine Learning/Artificial Intelligence, Machine Learning/Artificial Intelligence, Aneurysm detection, nnDetection, Aneurysm Localization
Intracranial aneurysms are relatively common life-threatening diseases with a prevalence of 3.2% in the general population. Therefore, detection is a vital task in aneurysm management. Lesion detection refers to simultaneously localizing and categorizing the lesions in medical images. In this study, we employed nnDetection framework, a self-configuring framework for 3D medical object detection, to detect and localize the 3D coordination of aneurysms. To capture and extract diverse features of aneurysms, two modalities including TOF-MRA, and structural MRI from ADAM dataset have been used. The performance of the proposed deep learning model was evaluated by free-response receiver operative characteristicsIntroduction
Intracranial aneurysms are causative for about 80%–90% of nontraumatic subarachnoid hemorrhages, with a mortality rate of 23%–51% and a 10%–20% risk of permanent disability. Since size, shape, and location of aneurysm are the most important factors in rupture risk of aneurysm, the aneurysm detection and localization tasks are critical for management guidance [1]. Deep neural networks as modern end-to-end learning models which can automatically extract the features of high dimensional images, have been greatly used in the field of medical images analysis such as segmentation and detection task. Recently, nnU-Net [2] combines the 3D U-Net architecture with an automatic tool for adjusting the model hyperparameters in medical images segmentation. Following nnU-Net, nnDetection [3] has been introduced to automatically tune the process and configuration of medical images detection. In this study, we employ nnDetection deep learning model for detection and localization of intracranial aneurysm. The proposed model tries to automatically generate a bounding box to localize the aneurysms. The main advantage of using this model compared to previous methods is to simultaneously localize and categorize the aneurysms in each slice without any manual intervention. In addition, it automatically predicts the bounding box and shows the estimated 3D coordination of aneurysm at the same time.Methods
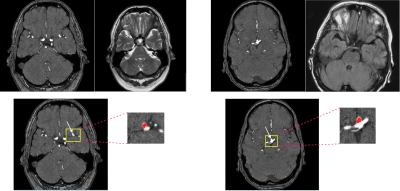
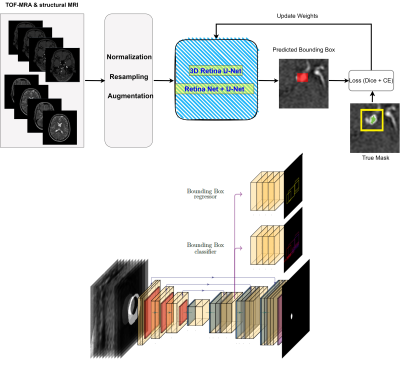
We used the ADAM dataset composed of 113 TOF-MRA and structural MRI (93 patients with unruptured intracranial aneurysm [UIAs]) [4]. The total number of UIAs was 125 and the voxel-wise annotations were drawn in the axial plane by two radiologists. All MRIs were performed at the UMC Utrecht, the Netherlands, on a variety of Philips scanners with field strength of either 1.5 or 3T. The TOF-MRAs had an in-plane resolution of 0.2 to 1 mm and slice thickness range of (0.4–0.7) mm, without a set acquisition protocol. Two cases of ADAM are shown in Figure 1. To automatically detect and localize the intracranial aneurysms in ADAM dataset, a 3D full resolution of nnDetection deep learning model was employed. The nnDetection framework uses the Retina U-net [5] architecture that combines the Retina Net detector with the popular U-Net segmentation model. In Retina Net as a one-shot detector, classification and bounding box regression tasks are directly performed using the intermediate activation maps from the output of each decoder block in the Feature Pyramid Network (FPN) [5]. Figure 2 shows an overview of the detection model and Retina U-net architecture. In addition, while Retina U-Net uses a loss function consisting of pixel-wise cross entropy loss [6] and soft Dice loss [5] for segmentation, binary cross entropy (BCE) and generalized intersection over union (GIoU) [7] were used for classification and box regression respectively. Like nnU-Net, the nnDetection runs some preprocessing techniques including cropping, Z-Score normalization, and scaling. The patch size is decreased while adapting the network architecture and the batch size is fixed to four. Retina U-Net with an encoder which consists of plain convolutions, ReLU and instance normalization blocks. We ran the model for 100 epochs with 2500 mini batches per epoch and applied five-fold cross validation. To update the network’s weights, SGD with Nesterov momentum 0.9 is used. We trained all the models 3* RTX 3090 GPU with patch size of 256 × 224 × 56.Results
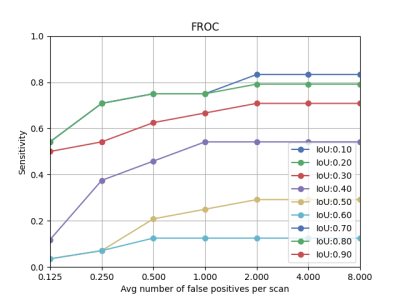
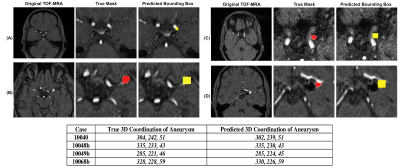
To evaluate the performance of deep learning model in aneurysm detection task, free-response operating characteristic (FROC) measure was plotted. The FROC calculates the lesion-level sensitivity versus false positive per scan (FPPS). The FROC curve is like ROC analysis, except that the false positive rate on the x-axis is replaced by the average number of false positives per image. As an example, using the threshold of IoU as 0.3, at FPPS = 0.25, 0.5, 1, 2, the sensitivity was 55%, 62%, 68%, and 72%. In addition to the bounding box, which was generated to show the location of aneurysm, the 3D coordination of aneurysms (center) was calculated to indicate the exact location of aneurysm in each case. Figure 4 (A) showed the comparison of bounding box predicted by our model with true segmentation mask four test cases. The estimated values of the center of aneurysm as a 3D coordination are also compared with the exact values provided by ADAM dataset in figure 4(B).Conclusion
This study proposed a deep learning-based detection and localization of intracranial aneurysms with TOF-MRA and structural MRI. We used nnDetection framework which employs Retina U-Net to detect and determine the location of an aneurysm. The model also drawn a 2D bounding box around the aneurysms in each slice. The FROC measure was used to evaluate the performance of deep learning model. Moreover, the estimated coordination of aneurysms also was compared with the true mask.Acknowledgements
This study was supported by US National Institute of Health (NIH) grantsR01HL162743 and R00HL136883.References
1. Yang, J., Xie, M., et.al, Deep learning for detecting cerebral aneurysms with CT angiography. Radiology. 2021; 298(1), 155-163.
2. Isensee, F., Jaeger, PF., et al. nnU-Net: a self-configuring method for deep learning-based biomedical
image segmentation. Nat Methods. 2021; 18:203–211
3. Baumgartner, M., Jäger, et.al., nndetection: A self-configuring method for medical object detection. In International Conference on Medical Image Computing and Computer-Assisted Intervention. 2021; 530-539.
4. Timmins, K., et al, comparing methods of detecting and segmenting unruptured intracranial aneurysms on TOF-MRAS: The ADAM challenge. NeuroImage. 2021; 238.
5. Jaeger, P. F., Kohl, S. A., et.al. Retina U-Net: Embarrassingly simple exploitation of segmentation supervision for medical object detection. In Machine Learning for Health Workshop. 2020: 171-183.
6. Ronneberger, O., Fischer, P., Brox. T., U-Net: convolutional networks for biomedical image
segmentation. Proc. International Conference on Medical Image Computing and Computer-Assisted
Intervention (MICCAI). 2015; 234–241.
7. Rezatofighi, H., Tsoi, N., Gwak, et.al., Generalized intersection over union: A metric and a loss for bounding box regression. In Proceedings of the IEEE/CVF conference on computer vision and pattern recognition. 2019; 658-666.
8. Pellicer-Valero, O. J., Marenco Jiménez, et.al., Deep Learning for fully automatic detection, segmentation, and Gleason Grade estimation of prostate cancer in multiparametric Magnetic Resonance Images. Sci Rep. 2022; 12(1). 1-13.
Figures


