1892
Neural Shape Models Predict Knee Pain Better than Conventional Statistical Shape Models: Data from the Osteoarthritis Initiative1Radiology, Stanford University, Stanford, CA, United States, 2Electrical Engineering, Stanford University, Stanford, CA, United States, 3Bioengineering, Stanford University, Stanford, CA, United States
Synopsis
Keywords: Osteoarthritis, Machine Learning/Artificial Intelligence
MRI-based statistical shape models can predict future disease and distinguish between patient groups. However, these models require thousands of matching points between bones which may introduce biases and their strictly linearly orthogonal features is a limitation. This study built continuous 3D shape representations of the femur using neural implicit representations and used the learned latent space to predict knee pain. The neural shape model can generate arbitrarily high resolution surfaces and predict pain with area under the receiver operating characteristic curve of 0.7 and sensitivity of 0.89, metrics comparable to deep learning methods trained on orders of magnitude more data.
INTRODUCTION
Three-dimensional MRI-based statistical shape models (SSM) can predict radiographic knee osteoarthritis progression1 and distinguish anterior cruciate ligament injury cases and controls2. However, current SSMs require dense corresponding points (matching points continuously over all bones), and may introduce bias based on the reference shape. SSMs learn linearly orthogonal features using principal components analysis, potentially limiting features.Neural implicit representations are a state-of-the-art method for 3D modeling that learn a continuous signed distance function (SDF) corresponding to a shape’s surface (Figure 1). Generative neural implicit representations (neural shape model) extend this methodology to learn the SDF of a large distribution of shapes allowing a single model to encode the variety of shapes found in the training dataset (distribution). While these models have been shown to reconstruct bones from undersampled data3, it is unclear whether they encode clinically important information, and how they compare to SSMs.
The purpose of this work was to determine whether a neural shape model of the femur can predict knee pain, and to compare its predictive ability to conventional SSMs.
METHODS
Data from the 24 and 48-month visit of the right knee of 562 participants enrolled in the Osteoarthritis Initiative were included4. Participants were randomly split evenly into training and testing sets. Sagittal Dual Echo in the Steady State knee MRIs (TE/TR= 5/16ms, flip angle=25o, field-of-view=140×140mm2, in-plane resolution=0.36×0.36mm2, slice thickness=0.7mm) of the right knee of each participant were segmented using a validated convolutional neural network5.The 24-month visit of the training data was used to learn a neural shape model of the femur using the autodecoder framework6.
A multilayer perceptron (MLP) takes as input the xyz position of an arbitrary point and a shape specific latent vector and predicts the SDF of that point and shape. The framework jointly optimizes the weights of the MLP and the latent representation (length 256) using Equation 1:
$$ \min_{\theta, Z}\sum_{k}^{K}\left(\sum_{i}^{X_k}\mathcal{L}\left(f_{\theta}\left(x_i, z_k\right), s_i\right) + \frac{1}{\sigma^2}MSE\left(z_k\right)\right) \tag{1}$$
where K are the 281 training bones, Xk is a set of randomly sampled points for bone k, f is the MLP and θ are the weights optimized to predict SDF values (si) from point (xi) and latent (zk) inputs. $$$\mathcal{L}$$$ is the L1 loss and the second term is the mean squared error (MSE) used to learn an independent covariance structure.
To obtain latent representations for training and testing pain prediction models, the learned neural shape model was fit to the 48-month training and testing data using Equation 2:
$$z_{recon} = \min_{z}\sum_{i}^{X}\mathcal{L}\left(f_{\theta}\left(x_i, z\right), s_i\right) + \frac{1}{\sigma^2} \|z\|_{2}^2\tag{2}$$
where the MLP parameters (θ) are unchanged, and the latent vector is optimized to predict the SDF values of the bone’s vertices.
To test the model’s ability to learn clinically meaningful information, its ability to predict current self-reported pain was tested. The pain group had > 6-months of pain in the past 12-months and the no-pain group had no pain in the past 12-months7. After extracting pain outcomes, there were 111 participants in the pain training dataset and 92 in the pain testing dataset. We trained 4 machine learning classifiers (logistic regression, gradient boosting, random forests, and naïve bayes) to predict pain using the learned 256-dimensional latent representation as input. To compare to prior work, we also used the 90-features of a previously described femur SSM trained with and without cartilage thickness8. To determine the effect of training dataset size, we fit each model using 100%, 75%, 50%, and 25% of the training data. Confidence intervals on predictive ability were generated by bootstrapping each model and dataset size 100 times without replacement. Model performance was assessed by calculating area under the receiver operating characteristic curve (AUROC), sensitivity, and specificity on the testing data.
RESULTS
Demographics for participants divided by split are outlined in Table 1. Examples of the learned representation are included in Figure 1. For each dataset size, neural shape models performed best with AUROC of 0.62, 0.66, 0.68, and 0.70 for the 25, 50, 75, and 100% dataset sizes, respectively (Table 2). The best fitting model used 100% of the labelled data, logistic regression and had an AUROC of 0.70 and sensitivity of 0.89.DISCUSSION
Generative neural shape models of bone learned latent spaces that predict knee pain better than a traditional bone SSM as well as a bone + cartilage SSM. This model required only one step, simultaneously generating correspondence, and encoding clinically relevant features. As expected, increasing training data improved pain predictions. According to AUROC, the neural shape model had comparable performance to the best performing SSMs using 25-50% less training data. The addition of cartilage to the bone only SSM worsened its predictions; this is in-line with a deep learning study where a bone+cartilage model reduced AUROC values by 3% compared to a bone-only model7. It is unclear why cartilage worsens predictions. Nonetheless, the neural shape model achieves comparable predictions to these deep learning models, using 1-2 orders of magnitude less data. Visualization of the pain predictions enabled by the neural shape model (Figure 3) shows that osteophyte formation is correlated with pain.CONCLUSION
Neural shape models learn clinically meaningful bone information. These shape models outperform traditional SSMs for predicting pain, a challenging and clinically important task.Acknowledgements
This work was supported by the National Institutes of Health (R01 AR077604, R01 EB002524, AR079431, P41 EB027060, and K24 AR062068), the Wu Tsai Human Performance Alliance, and a CIHR Postdoctoral Fellowship.References
1. Neogi T, Bowes MA, Niu J, et al. Magnetic Resonance Imaging-Based Three-Dimensional Bone Shape of the Knee Predicts Onset of Knee Osteoarthritis: Data From the Osteoarthritis Initiative: 3-D Bone Shape Predicts Incident Knee OA. Arthritis & Rheumatism. 2013;65(8):2048-2058. doi:10.1002/art.37987
2. Pedoia V, Lansdown DA, Zaid M, et al. Three-dimensional MRI-based statistical shape model and application to a cohort of knees with acute ACL injury. Osteoarthritis and Cartilage. 2015;23(10):1695-1703. doi:10.1016/j.joca.2015.05.027
3. Amiranashvili T, Lüdke D, Li H, Menze B, Zachow S. Learning Shape Reconstruction from Sparse Measurements with Neural Implicit Functions. In: ; 2022. Accessed July 21, 2022. https://openreview.net/forum?id=UuHtdwRXkzw
4. Peterfy CG, Schneider E, Nevitt M. The osteoarthritis initiative: report on the design rationale for the magnetic resonance imaging protocol for the knee. Osteoarthritis and Cartilage. 2008;16(12):1433-1441. doi:10.1016/j.joca.2008.06.016
5. Gatti AA, Maly MR. Automatic knee cartilage and bone segmentation using multi-stage convolutional neural networks: data from the osteoarthritis initiative. Magn Reson Mater Phy. 2021;34(6):859-875. doi:10.1007/s10334-021-00934-z
6. Park JJ, Florence P, Straub J, Newcombe R, Lovegrove S. DeepSDF: Learning Continuous Signed Distance Functions for Shape Representation. In: 2019 IEEE/CVF Conference on Computer Vision and Pattern Recognition (CVPR). IEEE; 2019:165-174. doi:10.1109/CVPR.2019.00025
7. Morales AG, Lee JJ, Caliva F, et al. Uncovering associations between data-driven learned qMRI biomarkers and chronic pain. Sci Rep. 2021;11(1):21989. doi:10.1038/s41598-021-01111-x
8. Gatti AA, Wang K, Gold GE, Delp SL, Chaudhari A. Statistical Shape Models of Bone and Cartilage for Predicting Demographics: Data from the Osteoarthritis Initiative. In: ; 2022.
Figures
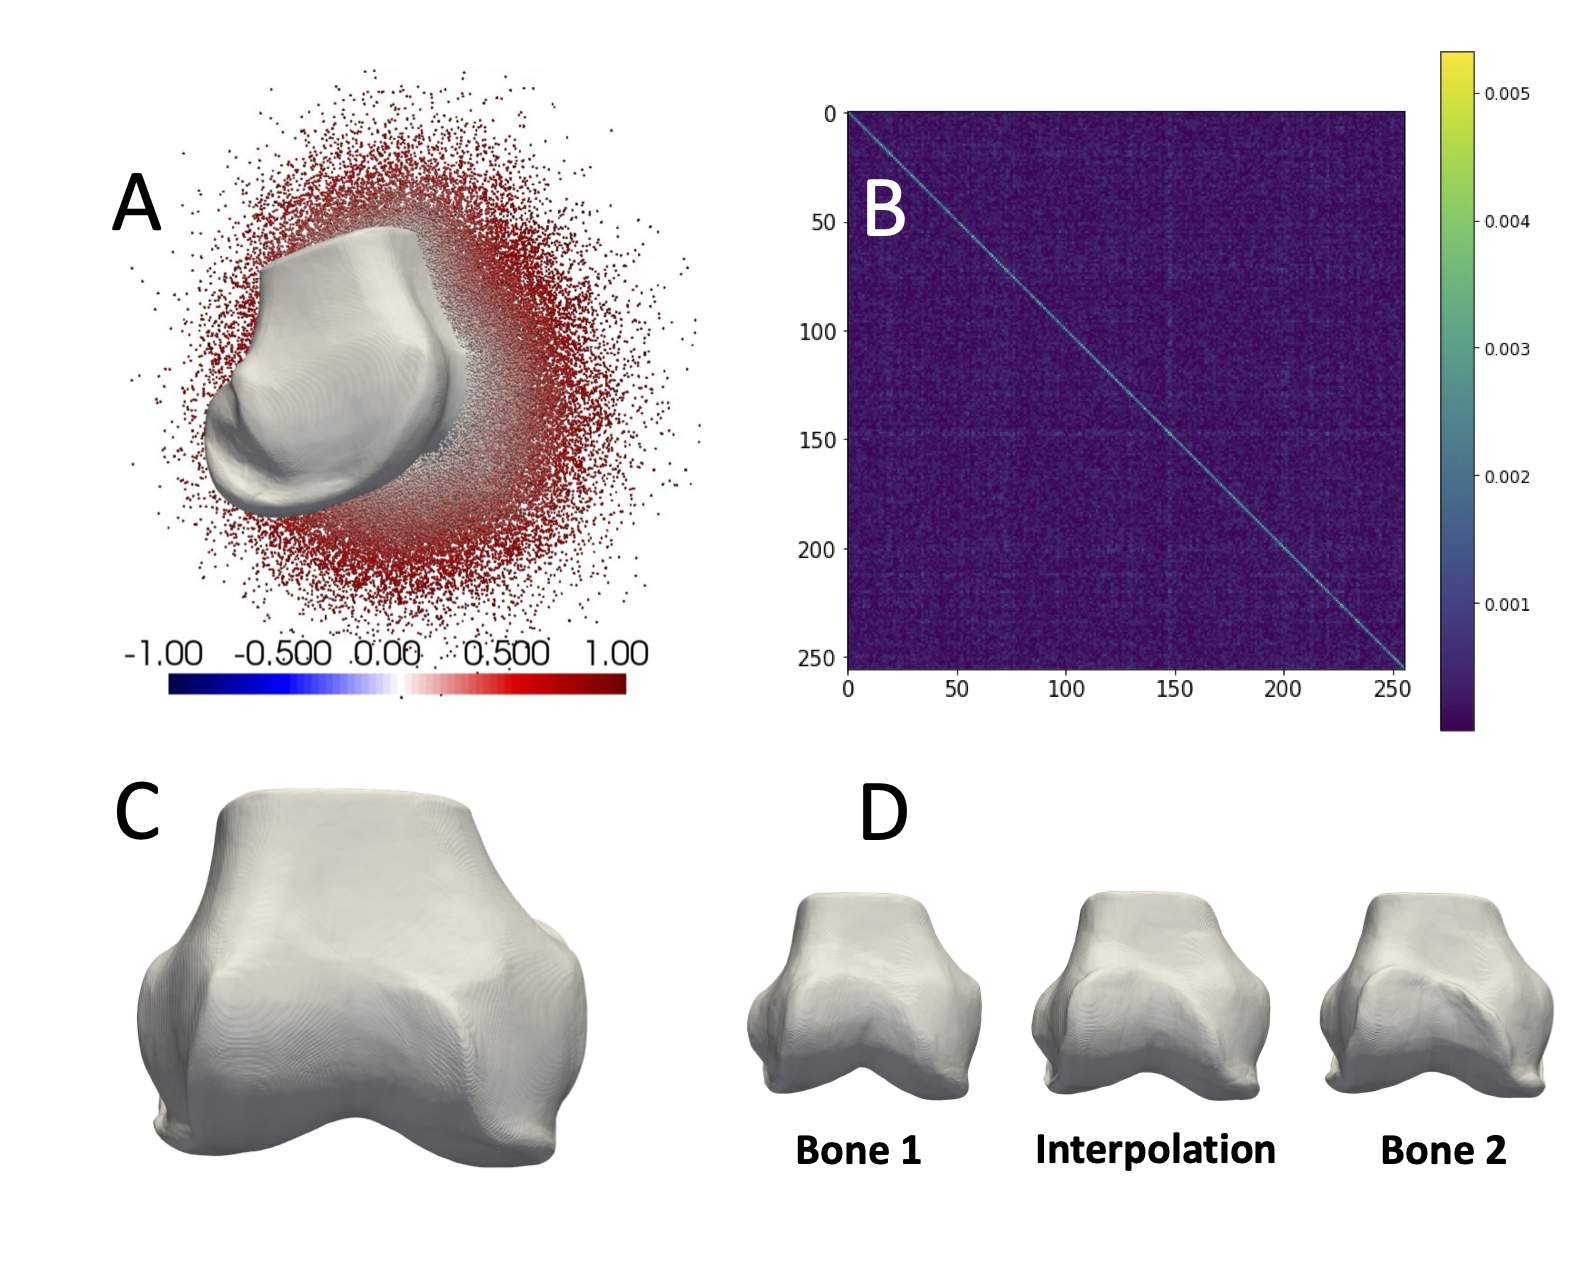
Figure 1. For training, each mesh was scaled to a unit sphere by mean centering and scaling by the max radial distance, then 500,000 points and their SDF values were sampled. (A) Shows a mesh and half its points colored by their signed distance. The network predicts signed distances. Meshes can be reconstructed from SDF = 0 points. The loss optimized learned latent vectors and promoted independent features by learning a diagonal covariance matrix (B). (C) The learned mean shape (0-vector) is representative of the dataset. (D) The learned latent space enables smooth interpolation.
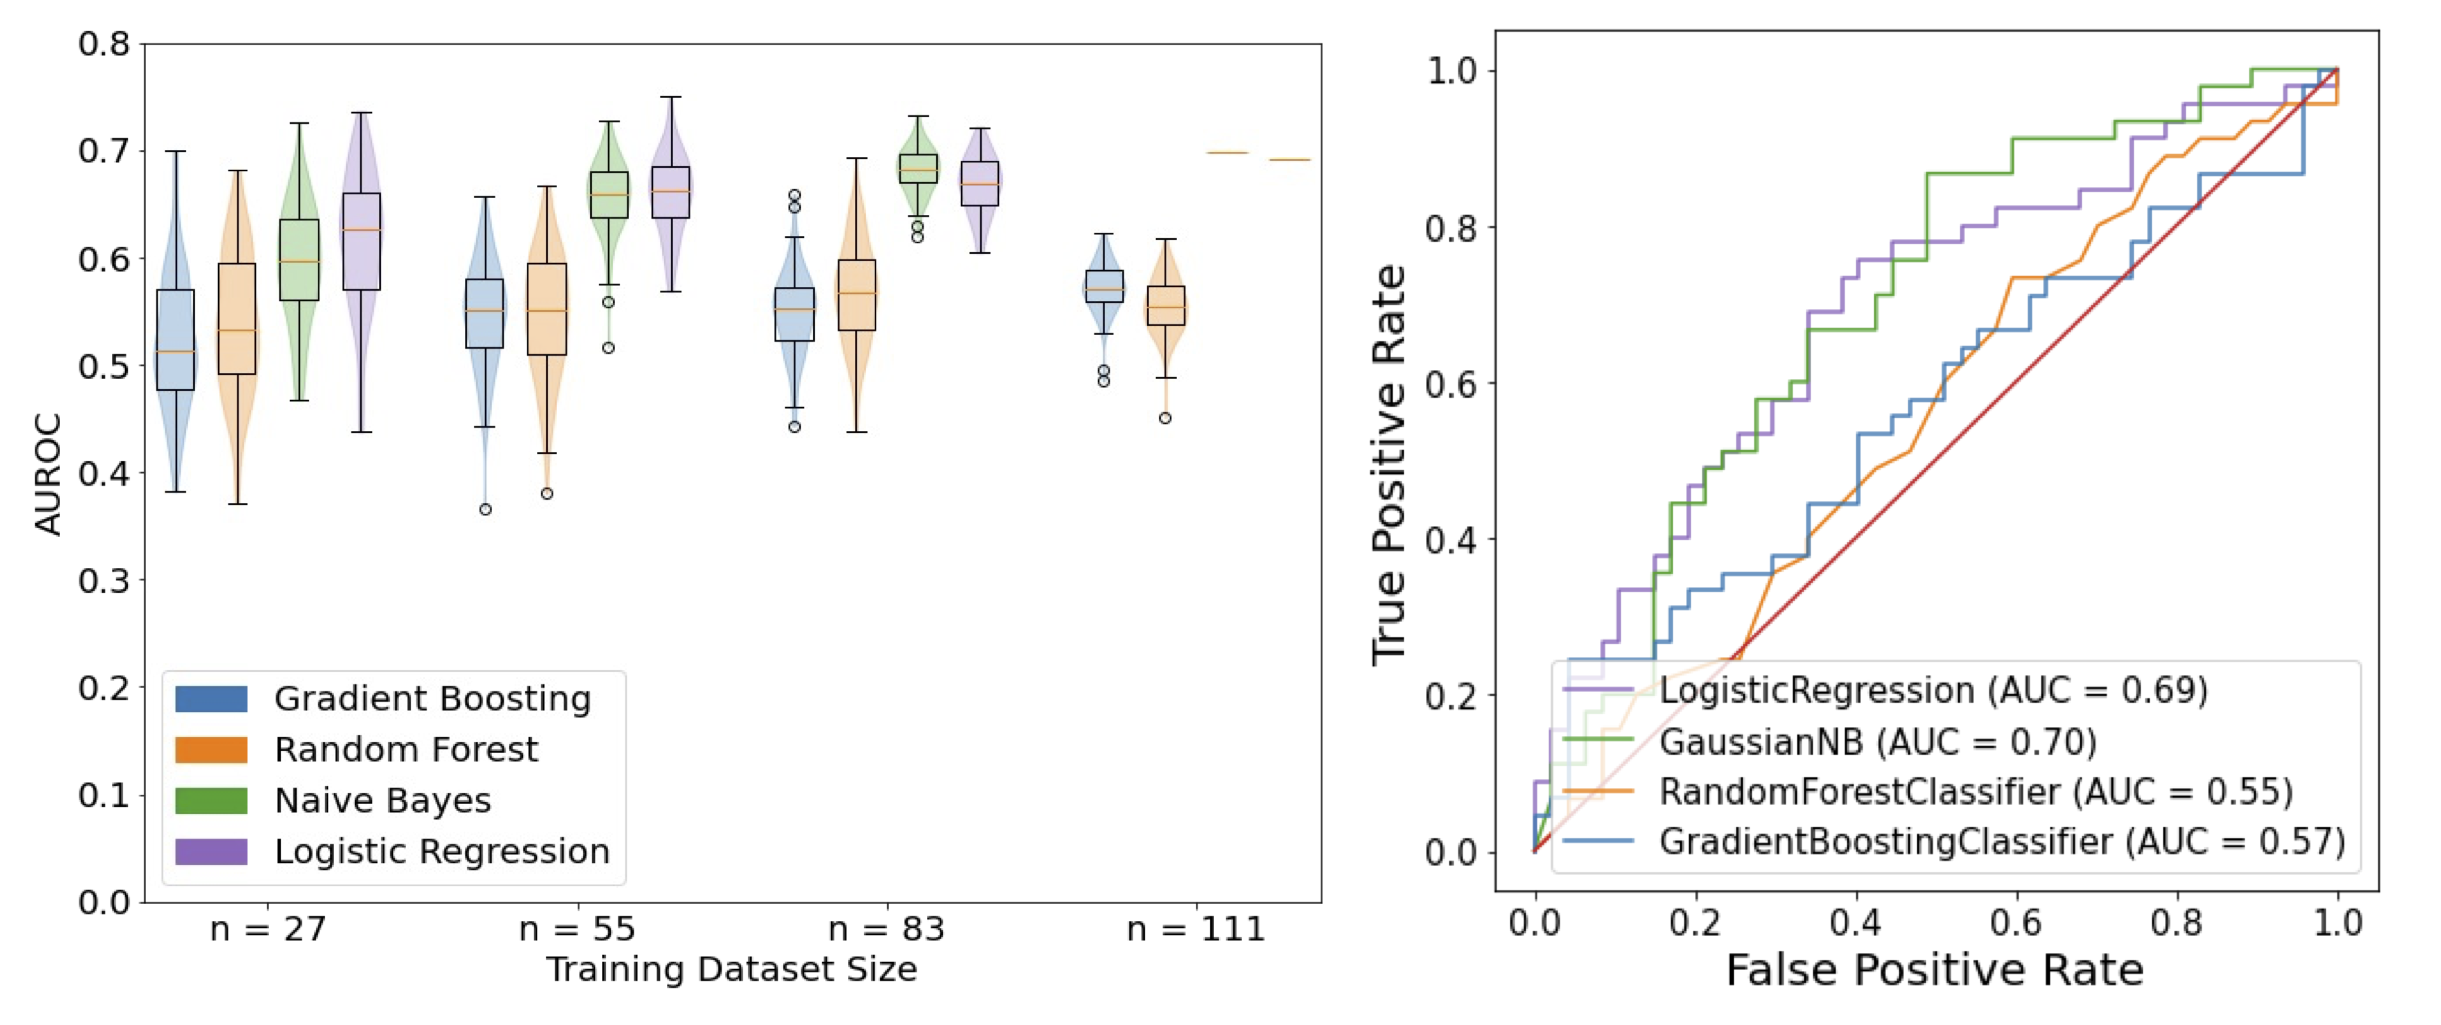
Figure 2. Neural shape model predictions of pain. Left: Testing data violin and boxplots of the distributions of AUROCs for the 100 repeatedly trained prediction models. In the n=111 (100% data) case, the data used to fit the models did not change between the 100 iterations, as a result the fitted naïve bayes and logistic regression predictions are singular flat lines on the graph. Right: The receiver operating characteristic curve for predictions using 100% (n=111) of the training data random forest and gradient boosting models with AUROC equal to the mean performance were selected.
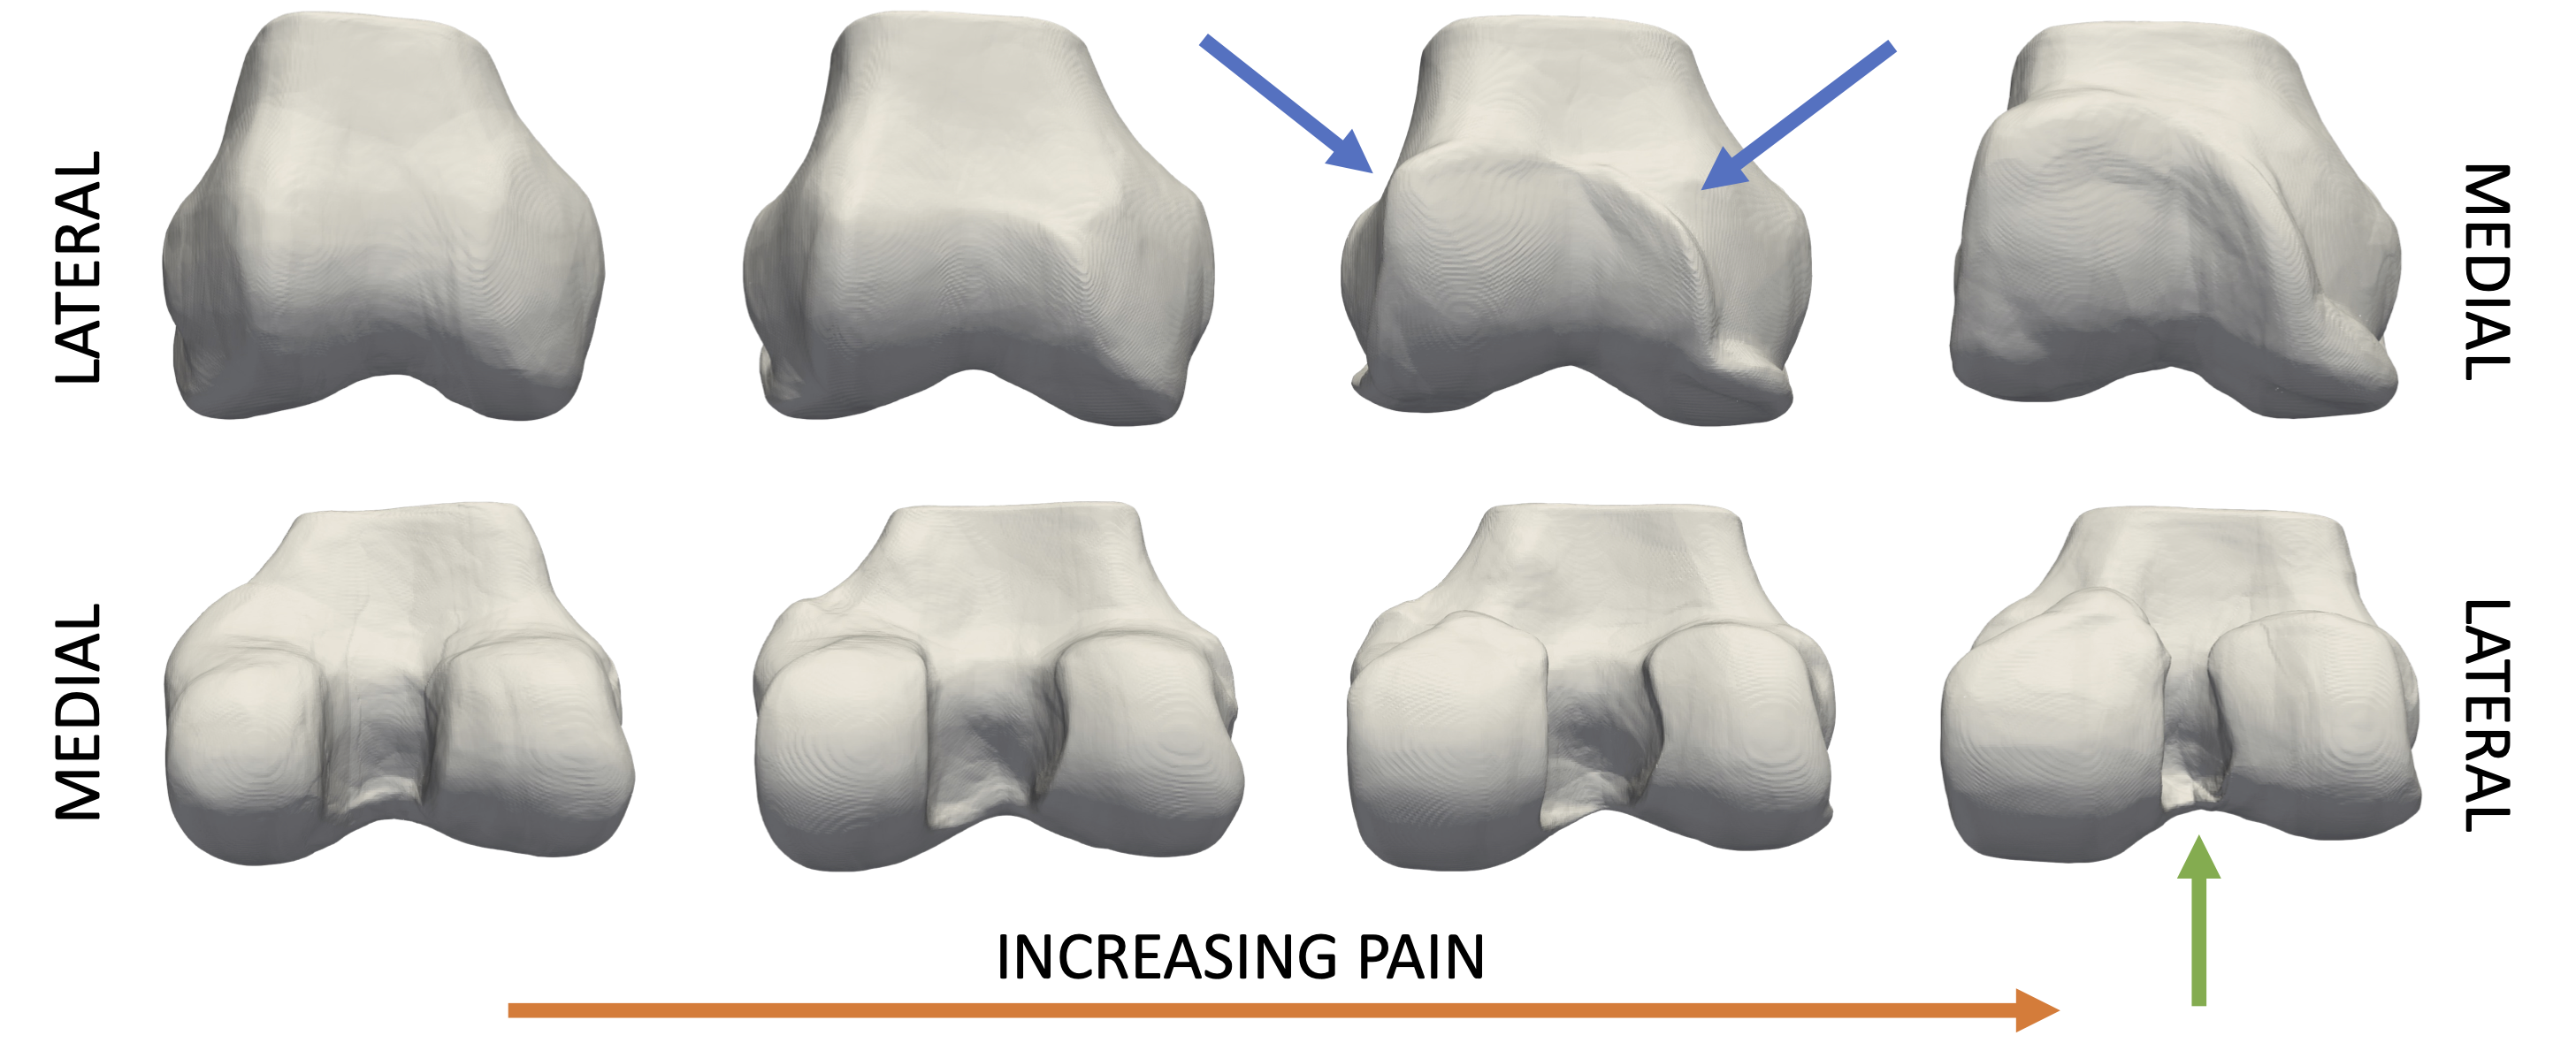
Figure 3. Visualization of the trajectory of increasing pain learned using logistic regression and the neural shape model. From left to right, shape is interpolated along a vector defined by the logistic regression coefficients. The left most bone represents no pain, with increasing probability of being painful as morphing to the right. Notable features learned from the model are broadening of the lateral trochlea and medial femoral condyle, generation of trochlear osteophytes (blue arrows), and narrowing of the intercondylar notch (green arrow).
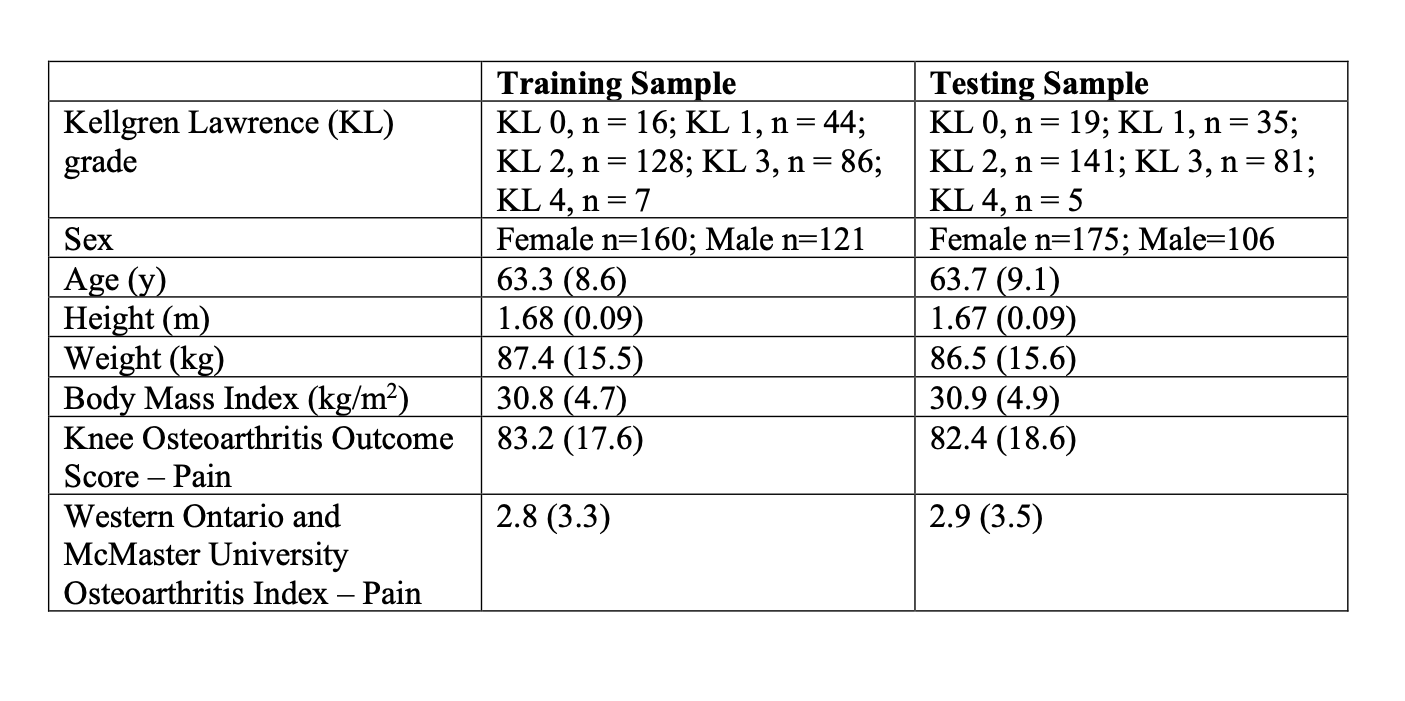
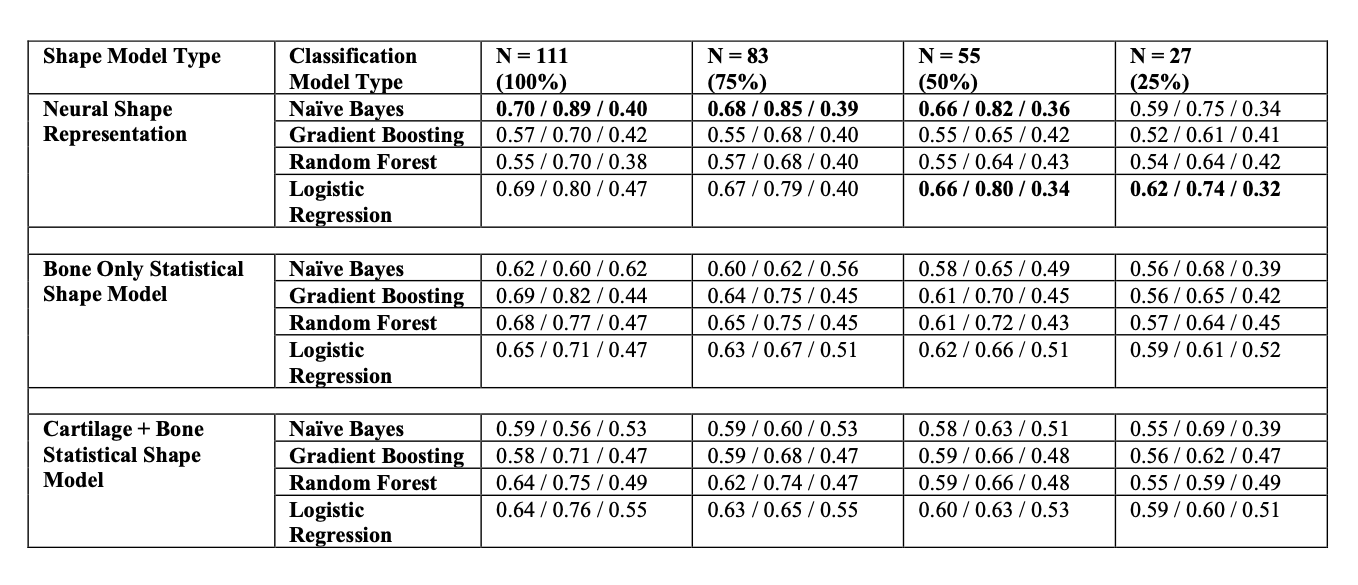
Table 2. Mean AUROC/Sensitivity/Specificity for each model type and training dataset size. The best model for each datatype, assessed using AUROC is bolded; in the case of a tie, all models are bolded.