1887
Development and validation of a deep learning model trained on MRI for the prediction of hepatocellular carcinoma survival1Department of Radiology, Sun Yat-sen University Cancer Center, Guangzhou, China, 2Department of Diagnostic Radiology, Hunan Cancer Hospital, Central South University, Changsha, China, 3Philips Healthcare, Guangzhou, China
Synopsis
Keywords: Machine Learning/Artificial Intelligence, Liver
In this study, we developed a deep learning model based on GD-DTPA-enhanced MRI data to predict the overall survival (OS) of patients with HCC. Our results showed that 3D-CNN model based on GD-DTPA-enhanced MRI can non-invasively predict the OS of patients with HCC. The combined model integrating the deep learning score and clinical factors showed a higher predictive value than the clinical and 3D-CNN models and may be more useful in guiding clinical treatment decisions to improve the prognosis of patients with HCC.Introduction
Liver cancer is the sixth most common malignancy and third leading cause of cancer-related deaths globally[1]. Surgical resection is the recommended curative treatment for patients with resectable hepatocellular carcinoma (HCC) at any stage [2]. However, the 5-year survival rate of patients is still low at approximately 18–20% [3]. Therefore, it is critical to establish an effective prognostic monitoring model to improve the prognosis of patients with HCC after surgery. Non-invasive accurate predictions of patient survival and objective analysis of tumor heterogeneity using preoperative GD-DTPA-enhanced MRI information will be of great significance for guiding clinical decisions and improving the prognosis of patients. Recent developments in deep learning (DL) have provided new potential opportunities for the rapid growth of diagnostic applications [4]. However, few studies have predicted the overall survival (OS) of patients with HCC after surgery using a DL algorithm based on preoperative multi-parameter MRI data. In this study, we aimed to develop a deep learning model based on GD-DTPA-enhanced MRI data to predict the OS of patients with HCC.Methods
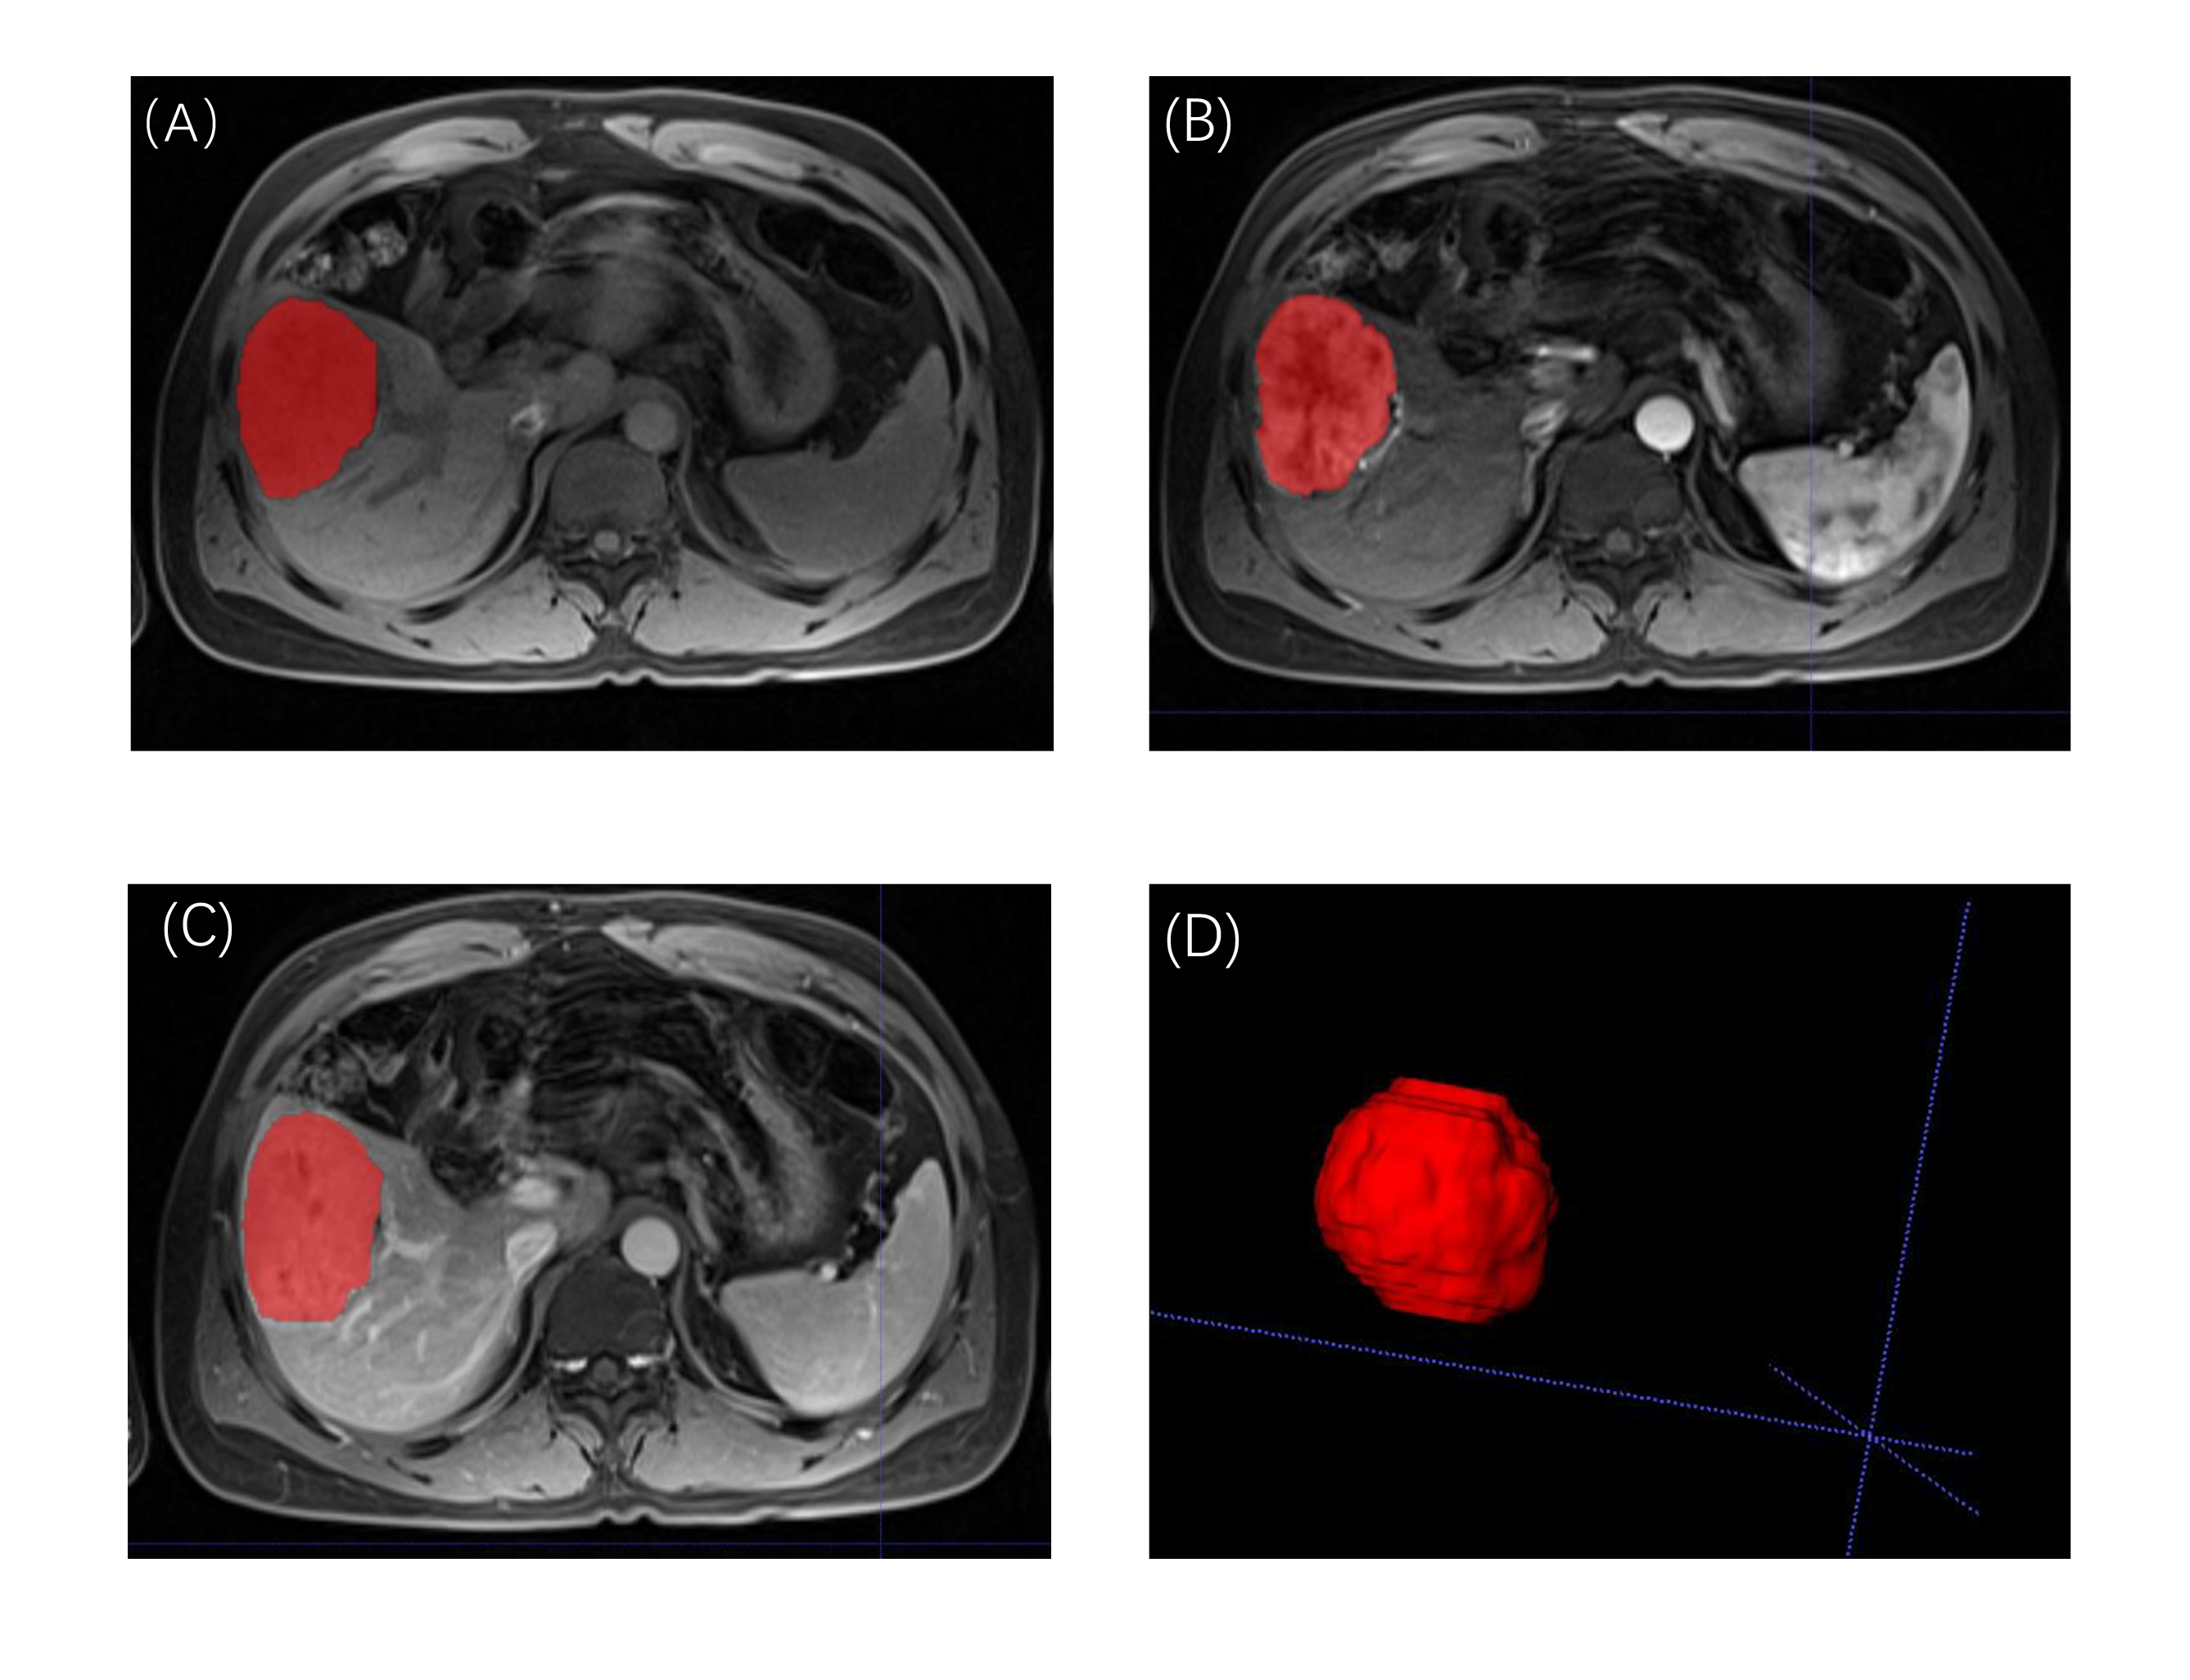
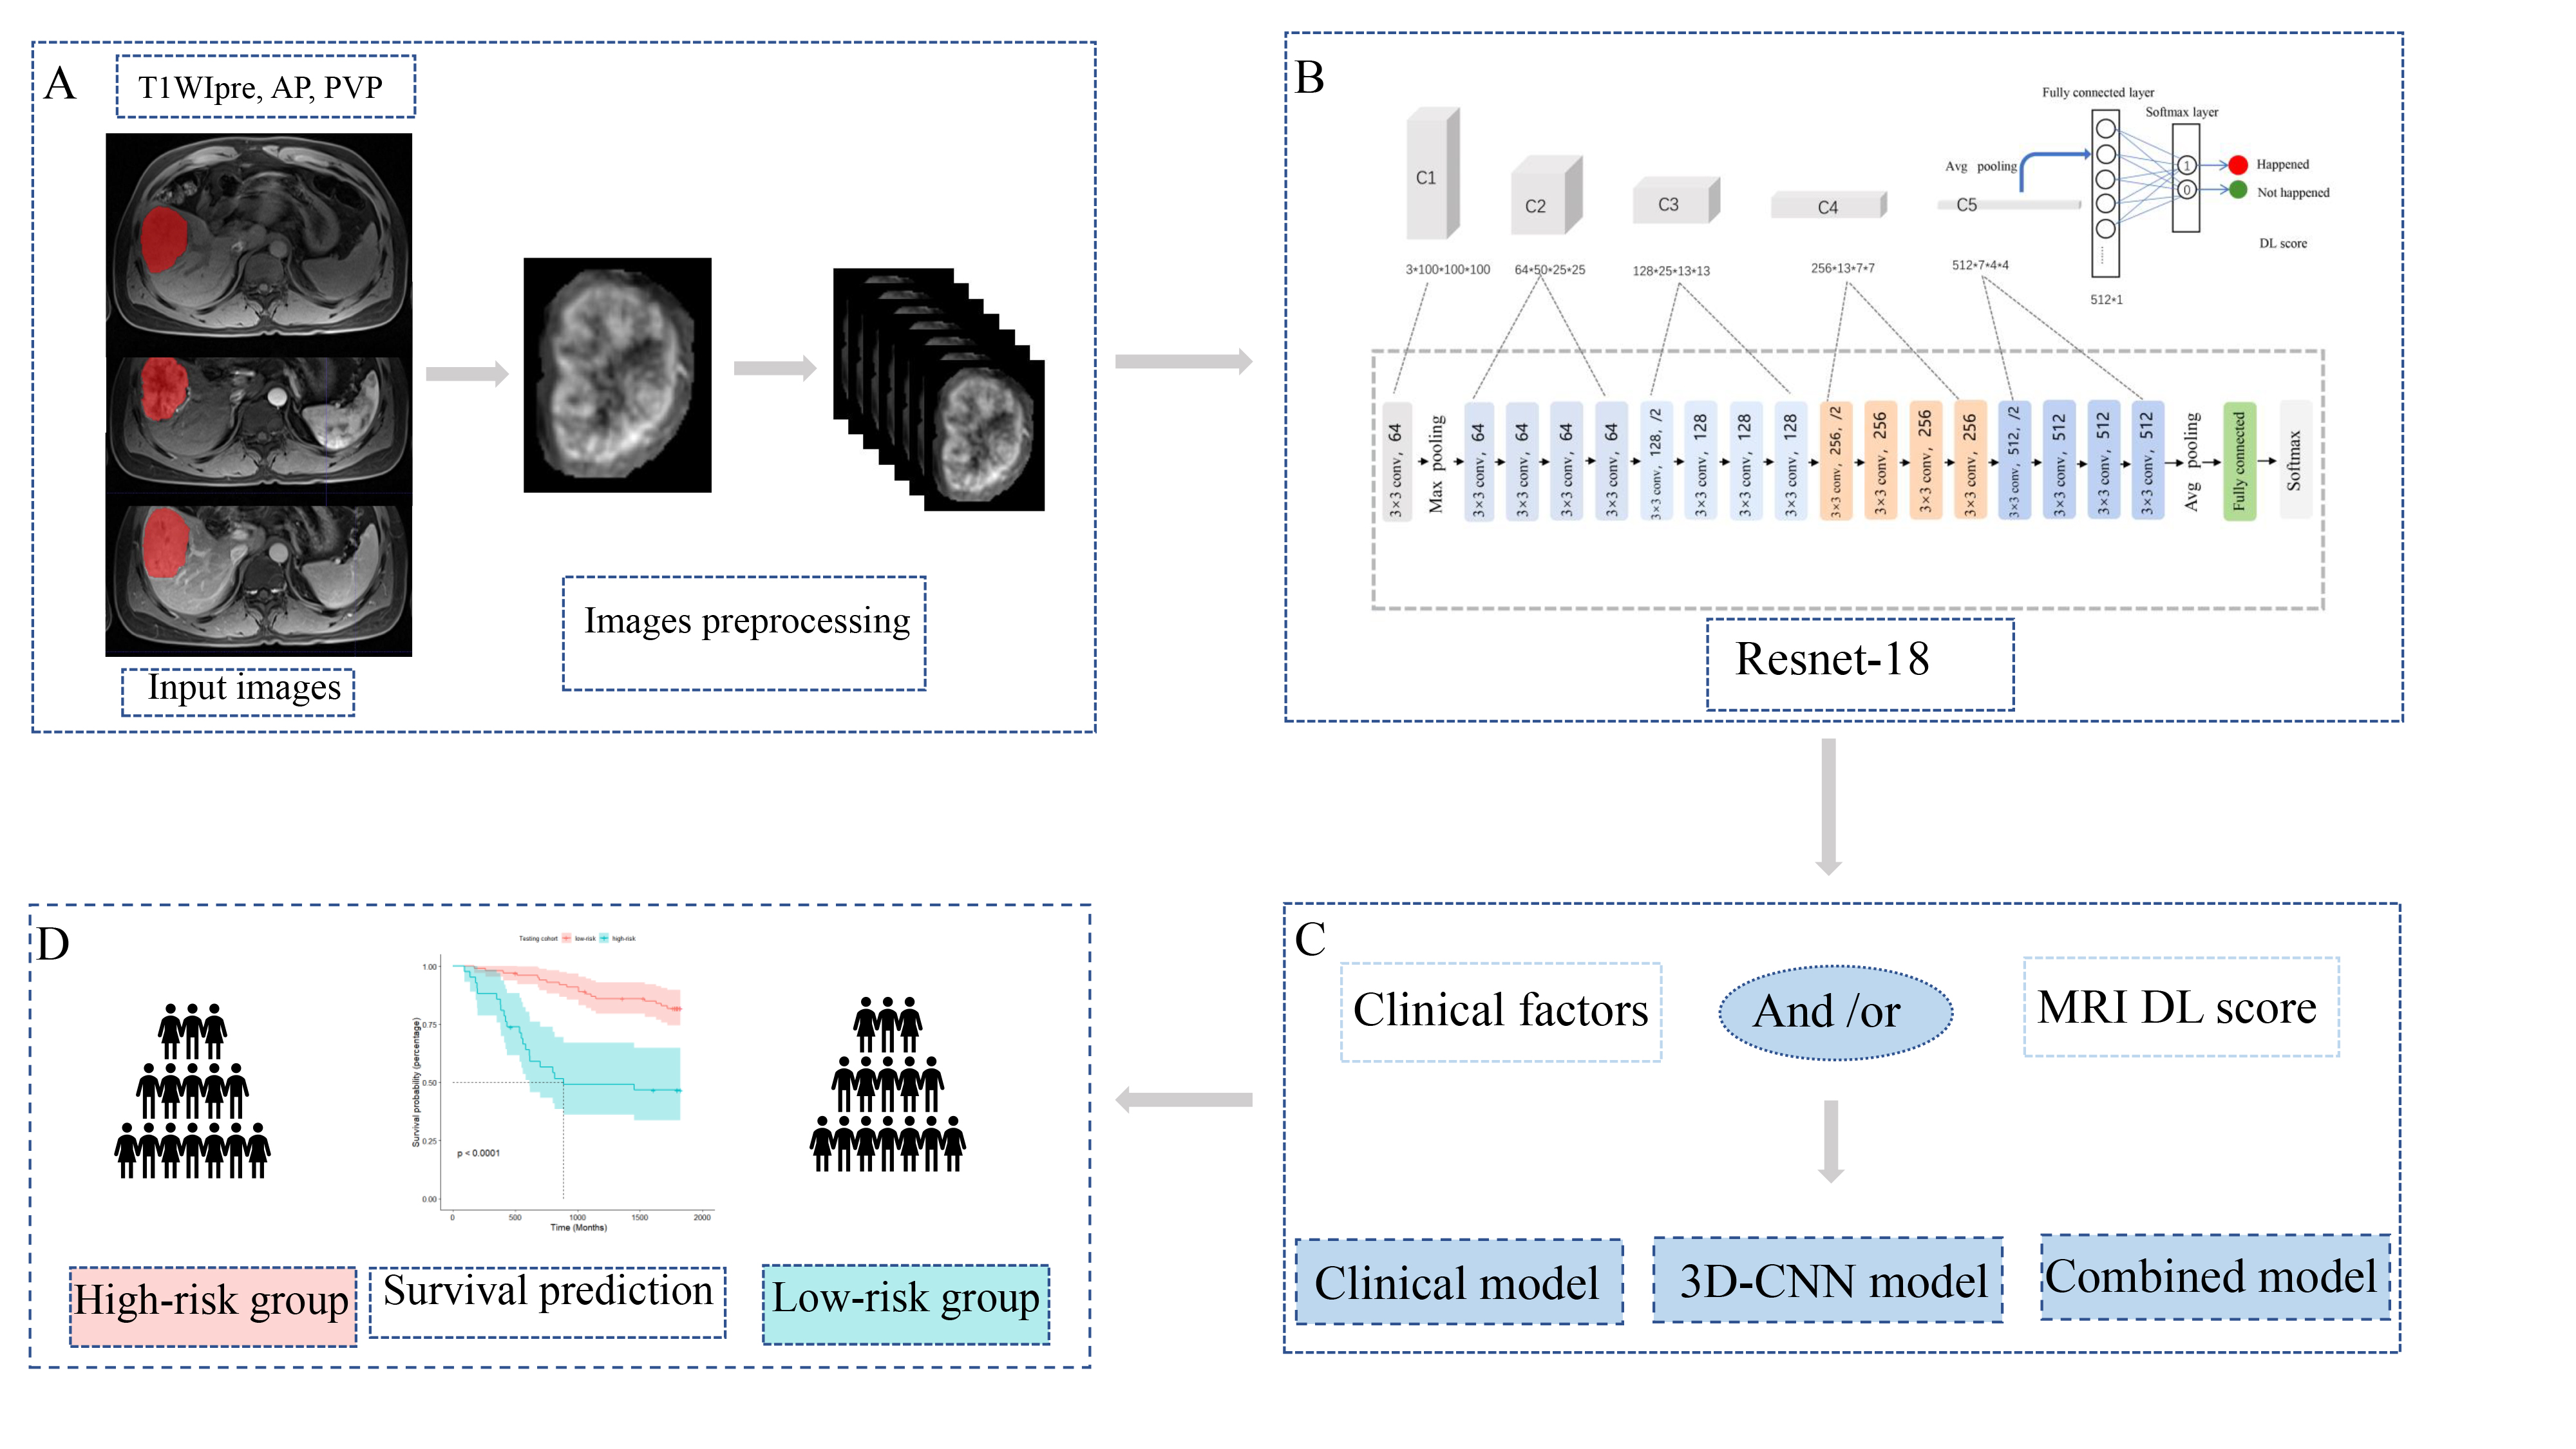
564 patients with HCC confirmed by surgery and pathology at SYSUCC from 2010 to 2015 and Hunan Cancer Hospital from 2014 to 2016 were retrospectively collected. Multi-parameter liver MRI sequences including T1WI, T2WI, DWI, ADC, and GD-DTPA-enhanced MRI (precontrast T1WI,T1WIpre; late arterial phase, AP; portal venous phase, PVP; delayed phase, DP) was performed using a 3.0-T MRI system (Philips Medical Systems; Siemens Medical Solutions; GE Medical Systems ) within 1 month before surgery. They were divided into training (326), internal validation (143), and external validation (95) cohorts, and a 3D-Resnet CNN was used to learn features from their pretreatment MR images (T1WIpre, AP, and PVP) manually delineating the volume of interest for lesions using the ITK-SNAP software (Figure 1). A clinical multivariate Cox regression model based on the Barcelona Clinic Liver Cancer (BCLC) staging system was developed. Concordance indices (C-indices) were used to evaluate model performance. We calculated the optimal cutoff for the deep learning score to distinguish patients with high and low mortality risks. The research layout was shown in Figure 2.Results
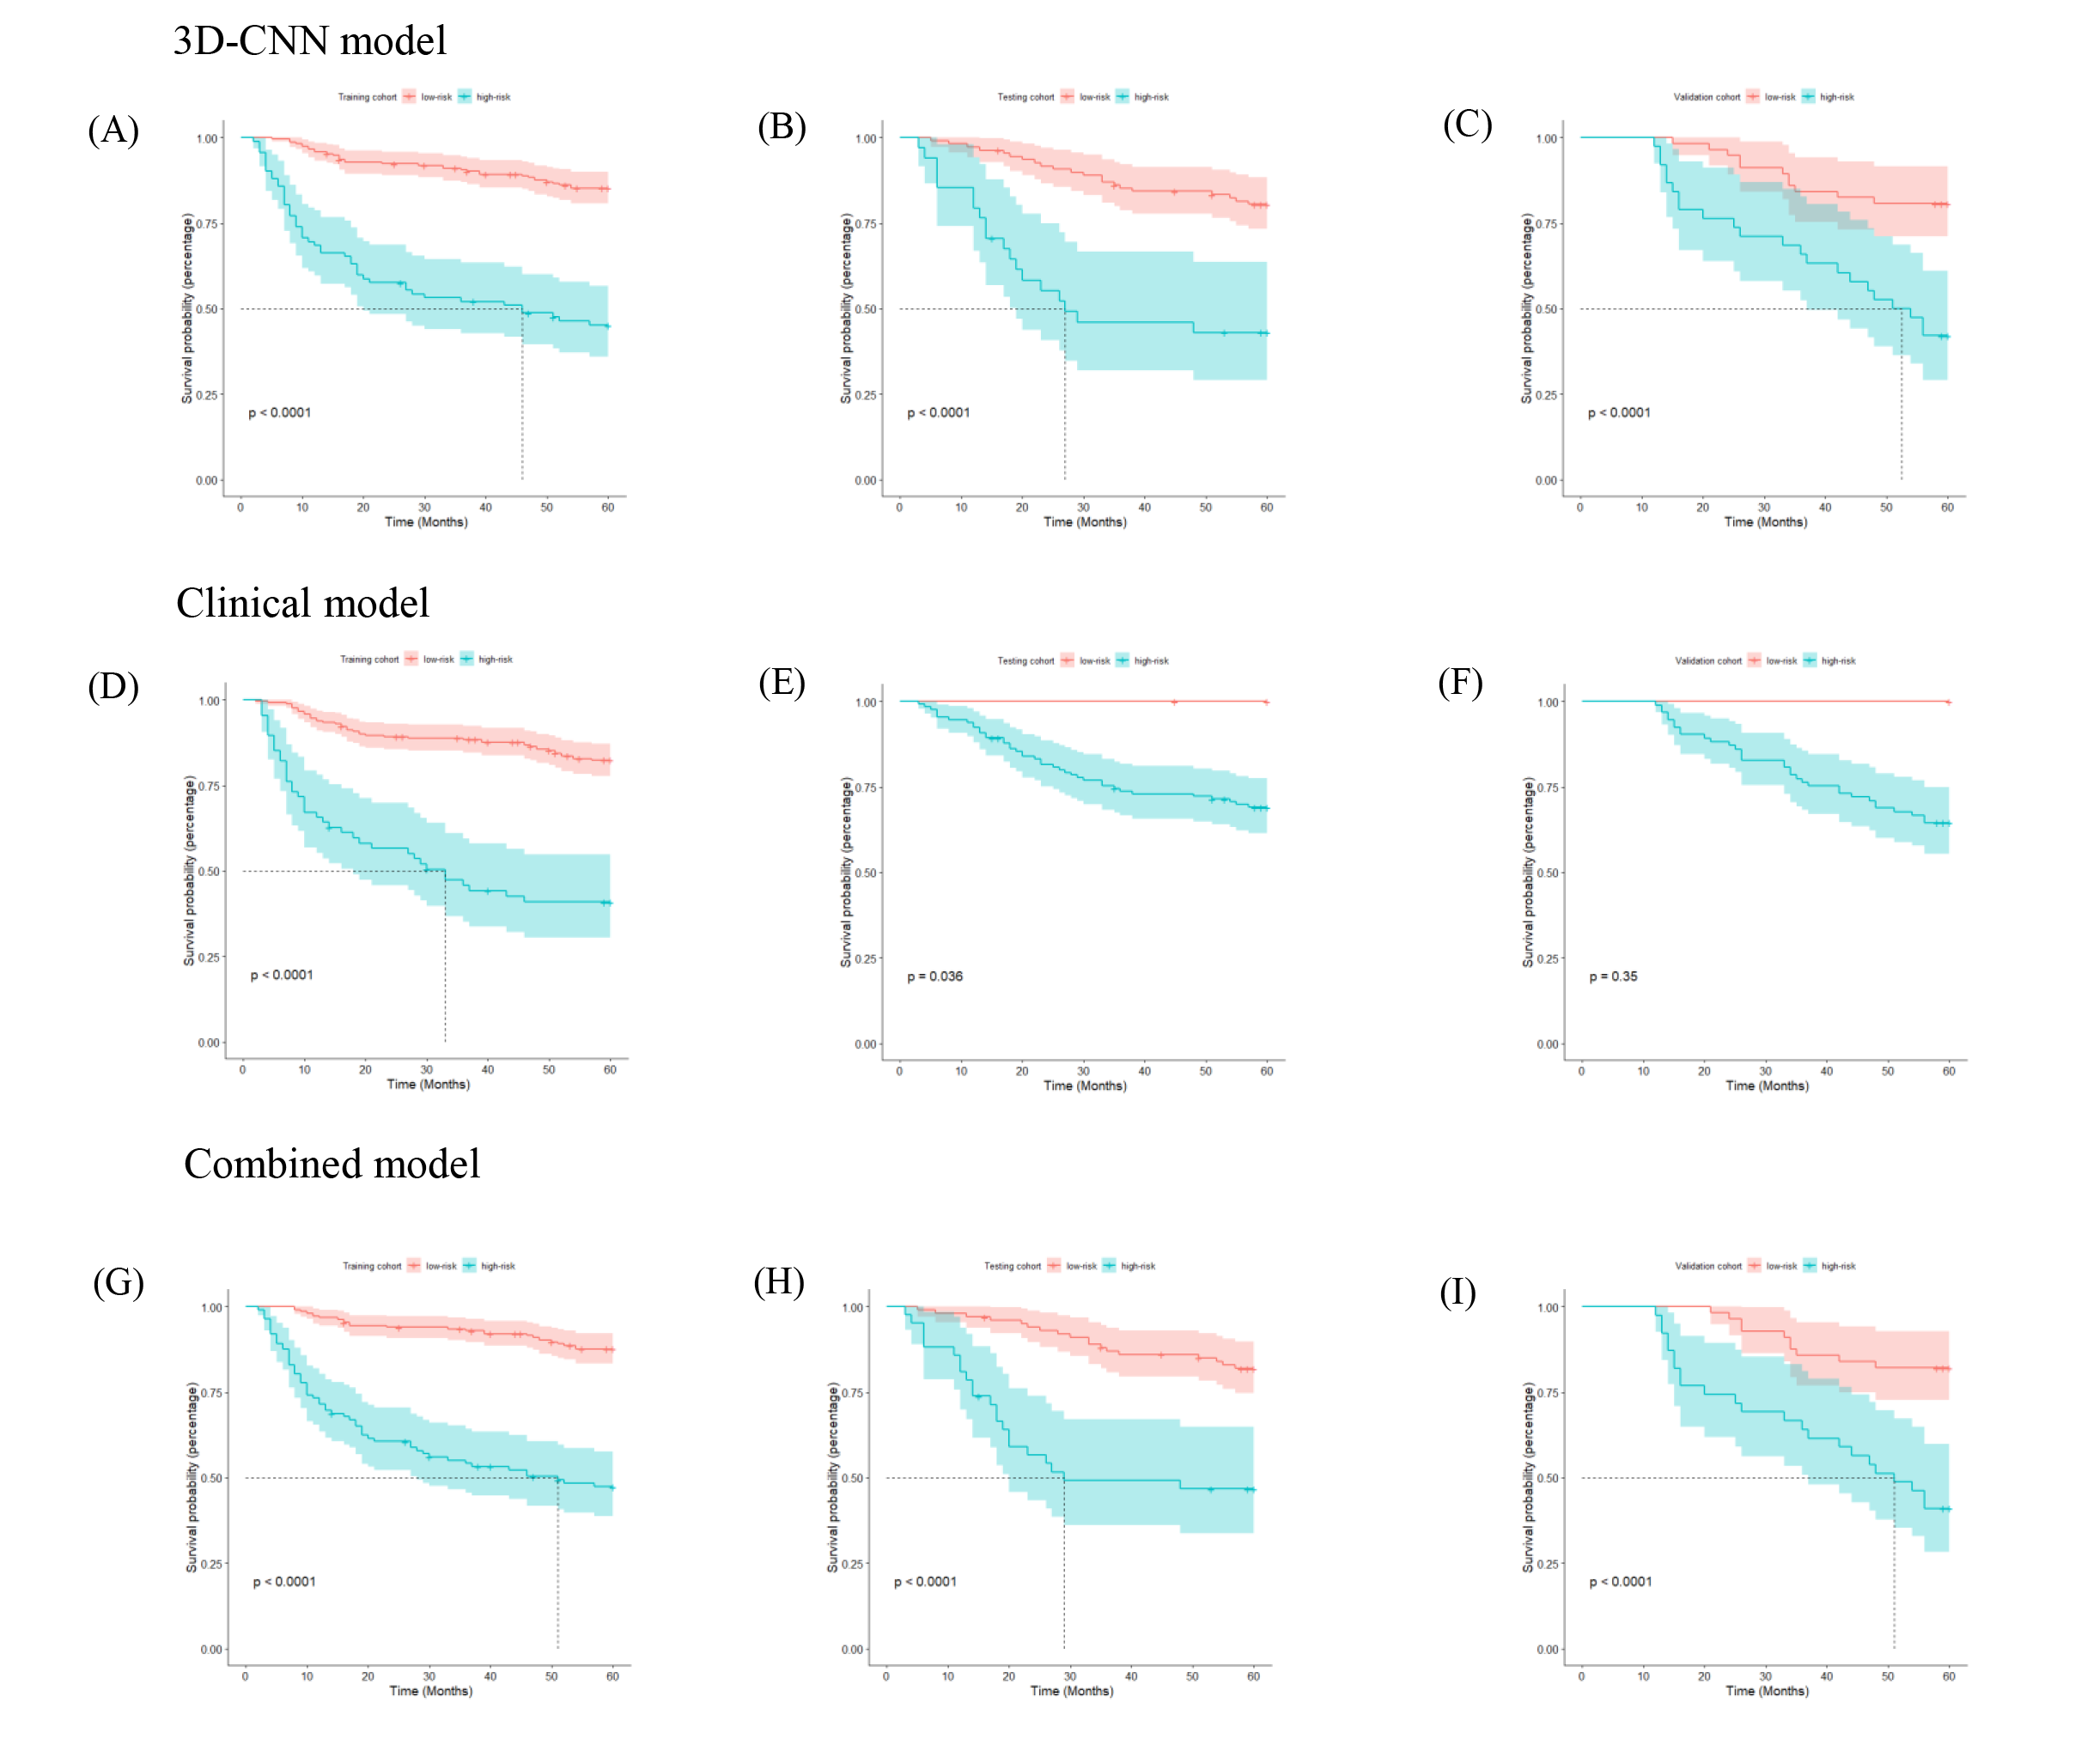
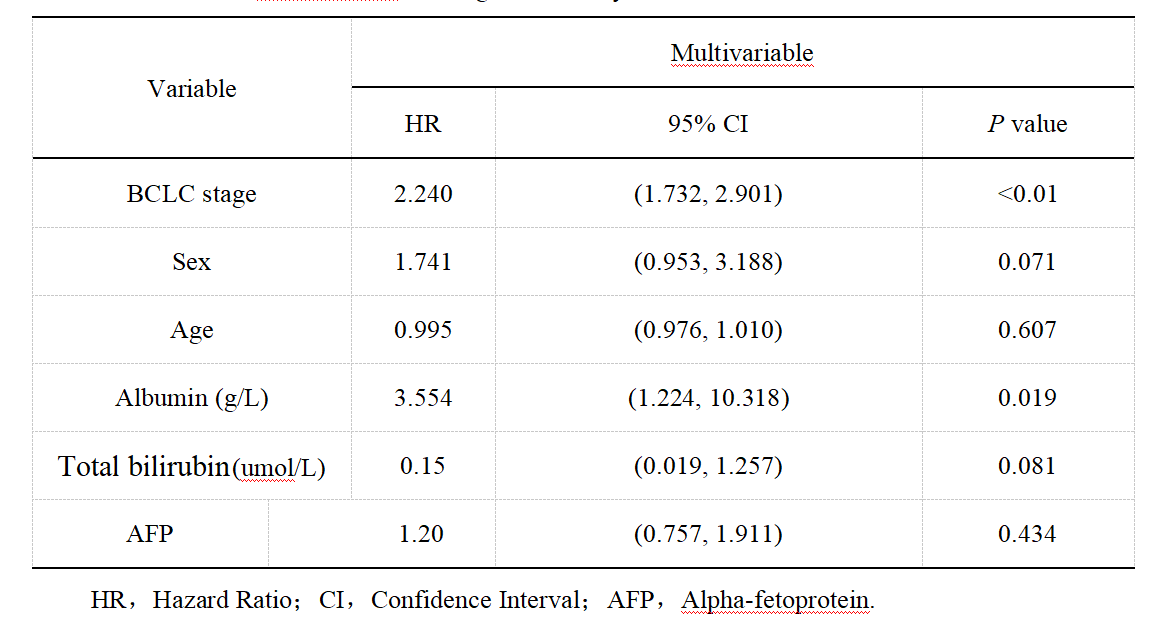
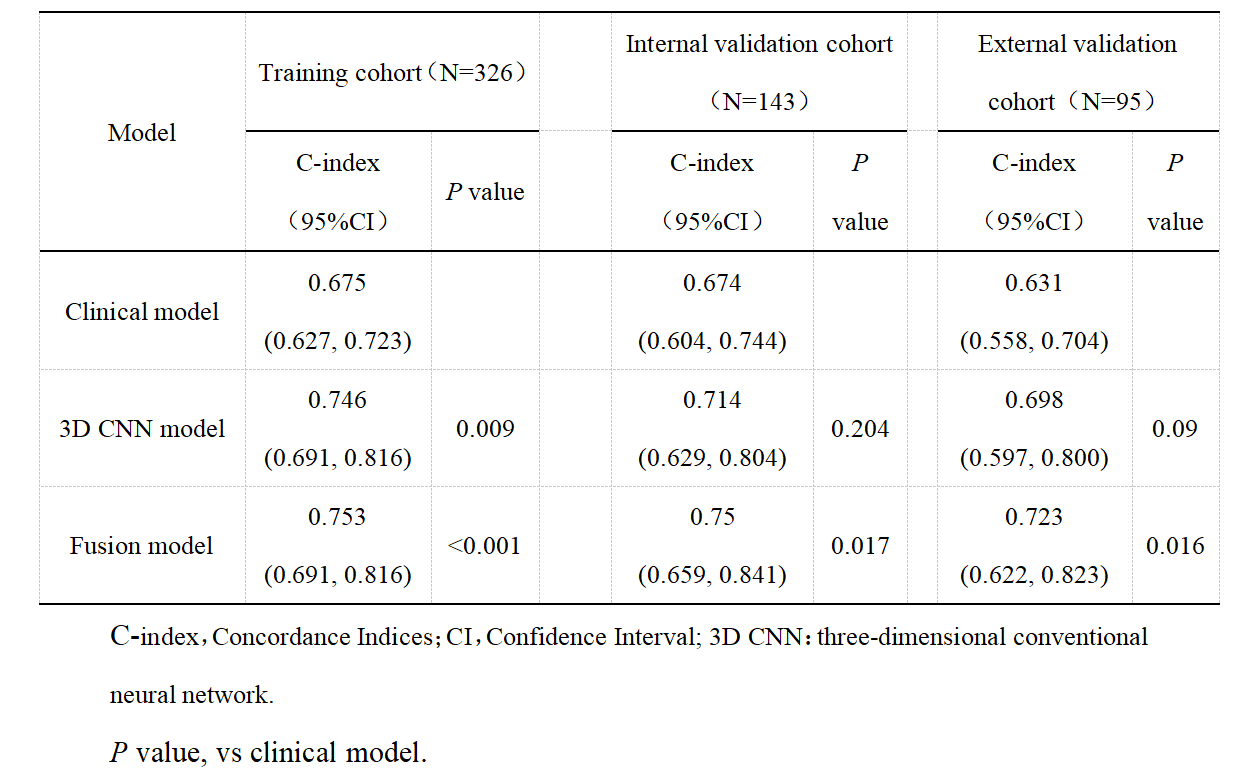
Multivariate Cox regression analysis of the training cohort data showed that the BCLC stage (HR, 3.554; 95% CI: 1.224–10.318) and total ALB (HR, 2.240; 95% CI: 1.732–2.901) were independent predictors of postoperative OS and could be used to construct the clinical model (Table 1).The C-indices of the 3D-Resnet CNN model for the training and internal and external validation data were 0.746 (95% CI: 0.685–0.810), 0.714 (95% CI: 0.629–0.804), and 0.698 (95% CI: 0.597–0.800), respectively. They were higher than those of the clinical model, which were 0.675, 0.674, and 0.631, respectively (P=0.009, P=0.204, and P=0.09, respectively). The C-indices of the combined model were 0.753 (95% CI: 0.691–0.816), 0.750 (95% CI: 0.659–0.841), and 0.723 (95% CI: 0.622–0.823), respectively, which were all significantly higher than those of the clinical model (P<0.001, P=0.017, P=0.016). The 3D-Resnet CNN model significantly distinguished patients with low and high mortality risks (Figure 3, Table 2).Discussion
Compared with previous studies[5-7], our cohort included more patients with chronic hepatitis B virus infection based on multi-parameter MRI, which can provide more high-throughput, high-dimensional microscopic information, and high soft tissue resolution. In addition, the follow-up was longer in our study, and our model effectively predicted the specific 5-year survival duration of patients after surgery. The C-index of the 3D-CNN model was above 0.7 for the training, internal, and external validation cohorts with good robustness. Besides, our results showed that the 3D-Resnet CNN model had a better performance than the clinical model. This suggests that 3D-CNNs can extract complex and informative features from MR images. The combined model had the best performance, which shows that integrating MRI and clinical features can help complement each other to make better predictions and reveal extreme variability. Furthermore, DL scores to distinguish high-risk patients from low-risk patients in the training, internal, and external validation cohorts with statistical significance (p <0.0001). It will be beneficial to relieve the financial burden of patients in the low-risk group and shorten their waiting time for further treatment to reduce the mortality risk in the high-risk group.Conclusion
A 3D-CNN model based on GD-DTPA-enhanced MRI can non-invasively predict the OS of HCC patients. The combined model integrating the deep learning score and clinical factors showed a higher predictive value than the clinical and 3D-CNN models and may be more useful in guiding clinical treatment decisions to improve the prognosis of HCC patients.Acknowledgements
No ackowledgement.References
1. Sung H, Ferlay J, Siegel RL, Laversanne M, Soerjomataram I, Jemal A, et al. Global Cancer Statistics 2020: GLOBOCAN estimates of incidence and mortality worldwide for 36 cancers in 185 countries. CA Cancer J Clin. 2021;71:209-49.
2. Ito K, Takemura N, Inagaki F, Mihara F, Kokudo N. Difference in treatment algorithms for hepatocellular carcinoma between world's principal guidelines. Glob Health Med. 2020;2:282-91.
3. Marrero J, Kulik L, Sirlin C, Zhu AX, Finn RS, Abecassis MM, et al. Diagnosis, staging, and management of hepatocellular carcinoma: 2018 Practice Guidance by the American Association for the Study of Liver Diseases. Hepatology. 2018;68:723-50.
4. Litjens G, Kooi T, Bejnordi B, Setio AAA, Ciompi F, Ghafoorian M, et al. A survey on deep learning in medical image analysis. Med Image Anal. 2017;42:60-88.
5. Saillard C, Schmauch B, Laifa O, Moarii M, Toldo S, Zaslavskiy M, et al. Predicting survival after hepatocellular carcinoma resection using deep learning on histological slides. Hepatology. 2020;72:2000-13.
6. Peng J, Kang S, Ning Z, Deng H, Shen J, Xu Y, et al. Residual convolutional neural network for predicting response of transarterial chemoembolization in hepatocellular carcinoma from CT imaging. Eur Radiol. 2020;30:413-24.
7. Liu F, Liu D, Wang K, Xie X, Su L, Kuang M, et al. Deep learning radiomics based on contrast-enhanced ultrasound might optimize curative treatments for very-early or early-stage hepatocellular carcinoma patients. Liver Cancer. 2020;9:397-413.
Figures