1885
Prediction of active Multiple Sclerosis lesions through use of logistic regression classifier and first-order features1Biomedical Engineering, Illinois Institute of Technology, Chicago, IL, United States, 2Medicine - Cardiology, University of Chicago Medical Center, Chicago, IL, United States, 3Radiology, University of Chicago Medical Center, Chicago, IL, United States, 4Philips Healthcare, Gainesville, FL, United States, 5Neurology, University of Chicago Medical Center, Chicago, IL, United States
Synopsis
Keywords: Machine Learning/Artificial Intelligence, Multiple Sclerosis
Multiple Sclerosis is a neuroinflammatory disease in which the immune system attacks nerve fibers and myelin sheaths, leading to the formation of lesions through white matter. Gadolinium-enhanced MRI is used to diagnose and track the progression of MS. Active MS lesions enhance with gadolinium, but there is an interest in prediction of lesion enhancement based on lesion features. In this study, we examined first-order features derived from T1w pre-contrast MS lesions acquired on multiple 3T imagers at a single center to train a logistic regression classifier to classify lesions as active or inactive.Introduction
Multiple Sclerosis (MS) is a chronic neuroinflammatory disease of the central nervous system (CNS) in which the immune system attacks nerve fibers and myelin sheaths, leading to destroyed nerve cell processes and myelin and the formation of lesions throughout white matter1-3. Contrast-enhanced magnetic resonance imaging (CE-MRI) is the current reference standard used to diagnose and track progression of the disease via detection of active inflammatory lesions4. Gadolinium-based contrast agent (GBCA) is administered for a T1-weighted (T1w) post-contrast image in which active lesions show up as hyperintensive. In this study, we examined the feasibility of using nine first-order features derived directly from T1w pre-contrast segmentation of lesions and logistic regression classification to predict lesion enhancement status.Materials and Methods
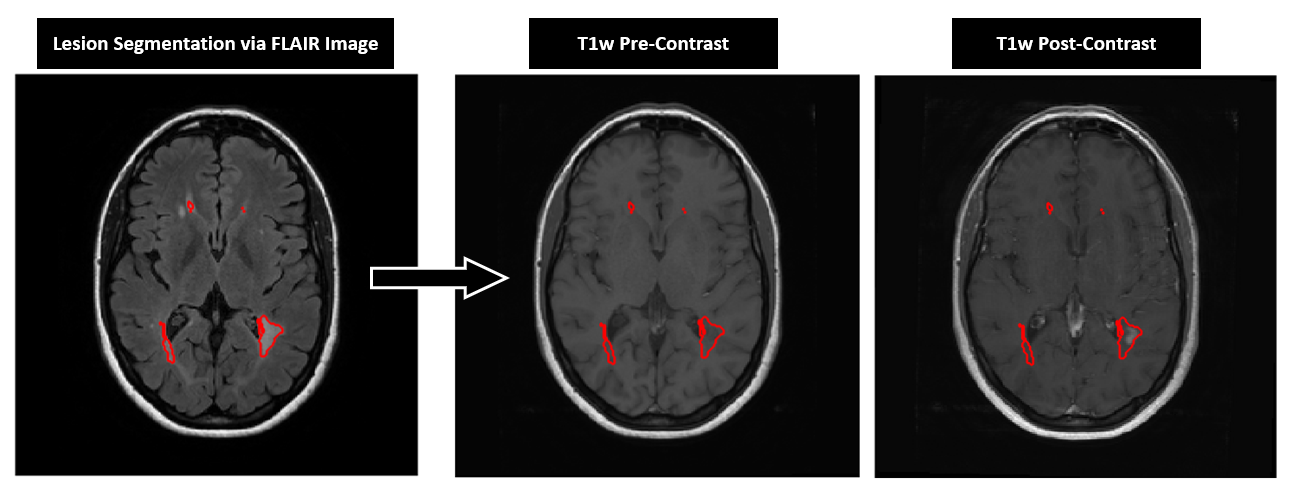
We performed a retrospective analysis of MRI exams of 40 patients (32 females) with clinically diagnosed MS according to the revised McDonald criteria were included in this study. All MR images were acquired on 3T whole-body systems (Philips Achieva and Ingenia; Best, The Netherlands) with a 16-channel coil array (February 2010 – December 2015, IRB approval obtained). Pre- and post-contrast T1w images were assessed to determine enhancement status of lesions. Analysis was performed on 58 imaging data using T2w FLAIR, pre- and post-contrast T1w spin-echo images.All data processing was performed using MATLAB R2021a (Mathworks, Natick MA). T1w pre- and post-contrast images were registered to the FLAIR image at respective time points using Statistical Parameter Mapping v12 (SPM12). MS lesions were segmented from all FLAIR images using SPM_LST’s lesion prediction5. Lesions with volume greater than 100 mm3 were applied to the registered T1w pre- and post-contrast images as a binary mask to derive nine first-order features from each image (Fig. 1). The nine first-order features were statistical measures of signal intensity: mean, median, standard deviation, variance, maximum, minimum, range, skewness, and kurtosis. Lesions were divided into two classes: CE lesion was classified as a lesion with a T1w post-contrast maximum intensity greater than two standard deviations above the mean white matter intensity on the T1w pre-contrast image, and non-contrast enhancing (nCE) lesion was any lesion that lacked this characteristic. Visually, CE lesions have areas of hyperintensity relative to the white matter. Each time point, including those of the same patient, was considered independent.
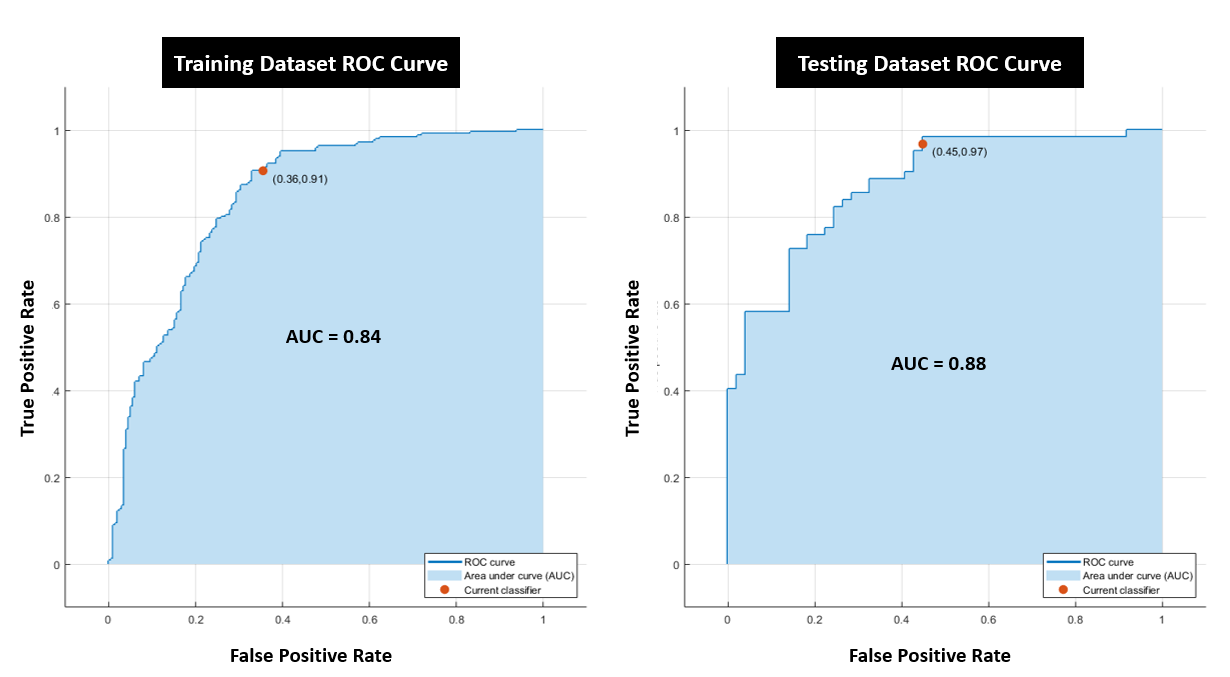
Logistic regression was performed on the nine features extracted from the T1w pre-contrast images. A receiver operator characteristic (ROC) analysis was performed and the area under the curve (AUC) was used to determine diagnostic accuracy. 5-fold cross validation was completed and accuracy for each fold was calculated as Accuracy = (True Positives + True Negatives)kth fold/(True Positives + True Negatives + False Positives + False Negatives)kth fold. The overall accuracy was calculated as the mean of all the fold accuracies. True Positive Rate (TPR) was calculated as TPR = True Positives/(True Positives + False Negatives).
Results
Using the listed metrics, a total number of 553 lesions were identified. Of these, 307 of which were classified as CE while the remaining 246 were classified as nCE. Logistic regression was first run for all features, which yielded an AUC of 0.84, an overall accuracy of 0.781, and TPR = 88.2%. On the test dataset, this classifier yielded an AUC of 0.86, an overall accuracy of 0.811, and TPR = 98.4% Logistic regression was then run for different combinations of subset of features, with the best performing combination included mean, max, min, and variance with an AUC of 0.84, an overall accuracy of 0.790, and TPR = 90.6% On the test dataset, this combination had an AUC of 0.88, an overall accuracy of 0.784, and TPR = 96.8% (Fig. 2). The model that performed the worst was trained on only kurtosis, with an AUC of 0.49, an overall accuracy of 0.532. Of note however, the single feature models that performed best were the models trained on mean (Training: AUC = 0.79, overall accuracy = 0.792; Testing: AUC = 0.79, overall accuracy = 0.739), max (Training: AUC = 0.76, overall accuracy = 0.778; Testing: AUC = 0.72, overall accuracy = 0.739), and minimum (Training: AUC = 0.83, overall accuracy = 0.794; Testing: AUC = 0.84, overall accuracy = 0.766).Discussion/Conclusion
This initial work demonstrates feasibility of MS diagnosis and lesion enhancement prediction using already available scans in the clinical workflow. Features embedded in T1w pre-contrast images may predict whether an MS lesion may enhance or not. This is critically essential to both the health of patients with MS and reducing costs and scan time. Further work warrants examination of other MS lesion features (such as lesion texture) and further examination of scans from different vendors and multiple centers.Acknowledgements
This work has been supported by NIH K25 HL141634.References
1. Wingerchuk, D. M., Lucchinetti, C. F., & Noseworthy, J. H. (2001). Multiple Sclerosis: Current Pathophysiological Concepts. Laboratory Investigation, 81(3), 263–281.
2. Compston, A., & Coles, A. (2002). Multiple sclerosis. 359, 1221–1231.
3. Vidal-Jordana, A., & Montalban, X. (2017). Multiple Sclerosis: Epidemiologic, Clinical, and Therapeutic Aspects. Neuroimaging Clinics of North America, 27(2), 195–204.
4. Saade C, Bou-Fakhredin R, Yousem DM, Asmar K, Naffaa L, El-Merhi F. Gadolinium and Multiple Sclerosis: Vessels, Barriers of the Brain, and Glymphatics. AJNR Am J Neuroradiol. 2018 Dec;39(12):2168-2176. doi: 10.3174/ajnr.A5773. Epub 2018 Nov 1. PMID: 30385472; PMCID: PMC7655403.
5. Schmidt, P., Gaser, C., Arsic, M., Buck, D., Forschler, A., Berthele, A., Hoshi, M., Rudiger, I., Volker, S., Zimmer, C., Hemmer, B., & Muhlau, M. (2012). An automated tool for detection of lesions in Multiple Sclerosis. NeuroImage, 59, 3774–3783.
Figures