1877
The diagnostic value of synthetic MRI combined with rFOV IVIM in transition zone prostate cancer1Department of Radiology,Taihe Hospital,Hubei University of Medicine, Hubei, China, 2GE Healthcare, MR Research, Beijing, China, 3Department of Biomedical Engineering,Hubei University of Medicine, Hubei, China
Synopsis
Keywords: Prostate, Cancer
This study investigated the value of relaxation time in synthetic MRI imaging combined with intravoxel incoherent motion (IVIM) imaging in differentiating transitional zone prostate cancer from benign prostatic hyperplasia (BPH). Finally, it was found that T2 value in synthetic MRI imaging and D value in IVIM imaging had higher diagnostic sensitivity and specificity, and their combined diagnostic performance was higher. It is helpful for the differential diagnosis of BPH and PCa in transitional zone.Introduction
Benign prostatic hyperplasia (BPH) involves two histologic subtypes: glands hyperplasia nodules (GHN) and interstitial hyperplastic nodules (IHN). It is confusing to differentiate IHN from PCa for obvious low-signal-intensity sclerosis, fibrous or muscular components appear on T2 images and DW images. T2WI is the main evaluation sequence for PCa in transitional zone mentioned in the latest edition of the Prostate Imaging-Reporting and Data System (PI-RADS2.1, 2019) [1]. However, structural T2WI can only be used to subjectively evaluatelesion morphology, size and contours but not offer disease-induced pathophysiological changes like T2 relaxation time based on free water content in different tissues.Recently, a synthetic MRI technology, Magnetic Resonance Image Compilation (MAGiC), can simultaneously provide multiple contrast images and corresponding quantitative parameters such as T1, T2 and proton density (PD) in a single scan[2]. In addition, ADC value is a common and indispensable parameter for PCa recognition and localization[1]. Nevertheless, two-b-value-computed ADC values unlike intravoxel incoherent motion (IVIM) cannot differentiate real diffusion restriction from tissue perfusion[3]. IVIM-derived parameters play an important role in the diagnosis and grading of prostate cancer[4]. In addition, there was no study applying both synthetic MRI and IVIM in diagnosing PCa from BPH. Therefore, our study examined the diagnostic accuracy of prostate cancer (PCa) and BPH using combined jointly synthetic MRI and reduced field-of-view DWI (rFOV-DWI) based IVIM derived parameters.Materials and Methods
This study was approved by our hospital. 20 cases with transitional zone prostate cancer and 28 cases with benign prostatic hyperplasia underwent routine prostate imaging and additional axial MAGiC (TR = 4000 ms, TE = 11.4/68.7 ms, matrix size = 128×128, NEX = 1, layer thickness = 4 mm, FOV = 26 ×26 cm, scan time = 2’ 24’’. and IVIM using rFOV-DWI (TR = 4000 ms, TE = 74.5 ms, matrix size = 80×100, layer thickness = 4 mm, FOV = 20 × 20 cm, 13b, scan time = 11’12’’) on 1.5T MR scanner (Signa voyager, GE Healthcare) with 8-channel phased array abdominal coil. For patients with PCa, the region of interest (ROI) was delineated on the largest section of the lesion. For BPH patients with multiple nodules, ROI was delineated along the edge of the largest nodule. All data were presented in mean±standard deviation (xˉ±s), and independent sample t-test or Mann-Whitney U test was used for comparison between PCa and BPH groups according normality and equality-of-variances respectively examined by Kolmogorov-Smirnov test and Levene's-Test. Receiver operating characteristic (ROC) curve and the area under the ROC curve (AUC) were used to check differentiation performance of all parameters between groups. P<0.05 was considered statistically significant.Results
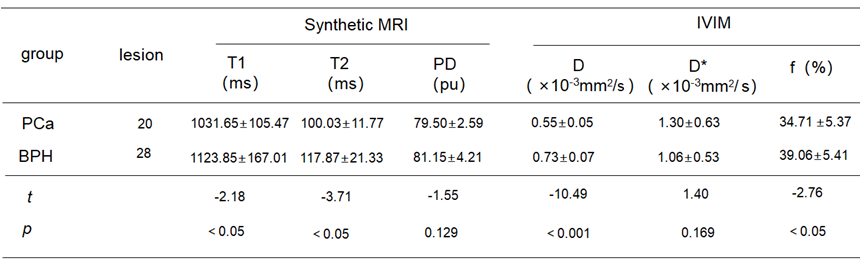
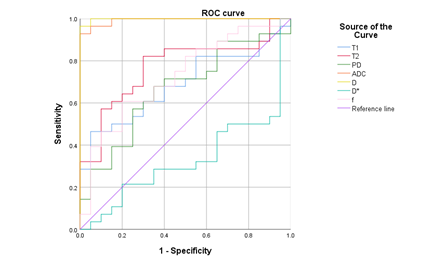
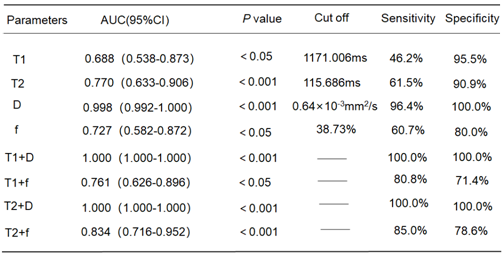
PCa patients showed significantly lower T1, T2, D, and f values than PHP patients (P < 0.05). T2 value in synthetic MRI imaging and D value in IVIM imaging respectively had the largest area under the curve (0.770 and 0.998) in differentiation of prostate cancer from benign prostatic hyperplasia. The combined models of D value, f value and synthetic MRI parameters showed improved diagnostic efficiency, especially combination of D value and T1 value or T2 value achieved AUC of 1.Discussion
Diagnostic efficacy of single quantitative relaxometry parameter (T1 only or T2 only) was low even they can discriminate PCa from BPH (most cases were IHN in our study) as Cui et al. reported that low diagnostic efficacy of T2 values on distinguishing IHN rather than GHN from PCa in transitional zone [2]. Theoretically, close arrangement and proliferation of tumor cells lead to limited diffusion of water molecules and decreased D value, and obvious blood perfusion and metabolism in tumor tissues increase f value. However, our finding of lower D value and f value in PCa than BPH might attribute to the highest b-values of >750s/mm2 in our IVIM protocol, leading to less perfusion effect [5]. In addition, D* value was not statistically significant between PCa and BPH groups in accordance with one study of the immature tumor neovascularization and no increase in capillary blood flow velocity. T2 value is strongly correlated with ADC value [6], but the combined application of D value or f value and one of synthetic MRI parameters improves diagnosticperformance in our study. The diagnostic efficiency of D value and T1-only or T2-only achieved the area under the curve of 1, for specificity and sensitivity were complemented by combination of synthetic MRI and high-b-value diffusion-oriented information. One bias to obtain good result was enrolled patients with higher pathological grade of prostate cancer that is easily differentiated from BPH.Conclusion
T2 value in synthetic MRI imaging and D value in IVIM imaging have higher diagnostic sensitivity and specificity, and their combined diagnostic efficiency is higher, which is helpful for the differential diagnosis of BPH and PCa in transitional area.Acknowledgements
No acknowledgement found.References
[1] TURKBEY B,ROSENKRANTZ AB,HAIDER MA, et al. Prostate Imaging Reporting and Data System Version 2.1: 2019 Update of Prostate Imaging Reporting and Data System Version 2. EurUrol 2019;76(3):340–351. doi:10.1016/j.eururo.2019.02.033
[2] CUI Y,HAN S,LIU M, et al. Diagnosis and Grading of Prostate Cancer by Relaxation Maps From Synthetic MRI. J MagnReson Imaging. 2020;52(2):552-564. doi:10.1002/jmri.27075
[3] LE BIHAN D,BRETON E,LALLEMAND D,et al. MR imaging of intravoxel incoherent motions: application to diffusion and perfusion in neurologic disorders. Radiology. 1986;161(2):401-407. doi:10.1148/radiology.161.2.3763909
[4] LI C,YU L,JIANG Y, et al. The Histogram Analysis of Intravoxel Incoherent Motion-Kurtosis Model in the Diagnosis and Grading of Prostate Cancer-A Preliminary Study. Front Oncol. 2021;11:604428. Published 2021 Oct 27. doi:10.3389/fonc.2021.604428
[5] Pang Y, Turkbey B, Bernardo M, et al. Intravoxel incoherent motion MR imaging for prostate cancer: an evaluation of perfusion fraction and diffusion coefficient derived from different b-value combinations. Magn Reson Med. 2013;69(2):553-562. doi:10.1002/mrm.24277
[6] MAI J,ABUBRIG M,LEHMANN T, et al. T2 Mapping in Prostate Cancer. Invest Radiol. 2019;54(3):146-152. doi:10.1097/RLI.0000000000000520
Figures