1871
Initial exploration of the potential of diffusion-weighted MRS for the evaluation of prostate pathology1Magnetic Resonance Methodology, Institute of Diagnostic and Interventional Neuroradiology, University of Bern, Bern, Switzerland, 2Translational Imaging Center (TIC), Swiss Institute for Translational and Entrepreneurial Medicine, Bern, Switzerland, 3Department of Medical Imaging, Radboud University Medical Center, Nijmegen, Netherlands, 4Cardiff University Brain Research Imaging Centre (CUBRIC), Cardiff University, Cardiff, United Kingdom
Synopsis
Keywords: Prostate, Cancer
Prostate pathologies like cancer and prostatitis cause alterations in tissue microstructure that are reflected in signal variations on diffusion-weighted MRI or MR relaxometry. Diffusion-weighted MR Spectroscopy (DW-MRS) allows specific characterization of tissue microstructure by quantifying both concentration and diffusion properties of MR-observable metabolites. In this work, an optimized DW-MRS protocol tailored to overcome the inherent challenges of prostate measurements is deployed. Initial results on potential alterations of metabolite concentrations and diffusivities (ADCs) are reported for prostate cancer and prostatitis. The preliminary findings are tentatively explained by microstructure alterations of the prostate tissue.
Introduction
Diffusion-weighted Magnetic Resonance Spectroscopy (DW-MRS)1 allows the characterization of tissue microstructure by quantifying the diffusion properties of MR-observable metabolites2,3. Prostate pathologies like cancer and prostatitis cause alterations in tissue microstructure that are reflected in diffusion-weighted MRI or MR relaxometry. While MRS detects abnormal tissue content of metabolites, DW-MRS may pinpoint metabolic tissue content alterations and changes in the tissue microenvironment. In the prostate, DW-MRS is challenging, not only because of the organ size and location close to the bladder and rectum but also due to the sensitivity of DW-MRS to any motion, including peristaltic motion. A parallel submission outlines the optimization of DW-MRS for this organ in healthy subjects.Here, we explored apparent diffusion coefficients (ADCs) of water and metabolites in prostate cancer (PCa) and prostatitis (CPPS).
Methods
Ten subjects with elevated PSA levels (≥9ng/mL, mean age 72y), suspicious for PCa, underwent a clinical multi-parametric MRI protocol followed by biopsy. Single-voxel DW-MRS was added as a 15-minutes long prolongation of the examination. MRS voxel positioning to maximize the targeted tumor tissue content was performed with T2w and ADC images. We report on two patients eventually diagnosed with PCa and two with CPPS. Nine healthy subjects served as controls. Measurements were performed on a 3T MR system (Siemens) with external phased-array coils.A metabolite-cycled DW-MRS STEAM sequence allowed simultaneous measurement of metabolite and water signals4,5. The acquisition parameters were: TE/TM/TR 33/35/2500 ms; b-values: 124, 776, 1988 s/mm2. Post-processing featured artifact correction and motion compensation using the co-acquired water signal as inherent reference as described for brain5. A 2D-fit with simultaneous χ2-minimization in the spectral and mono-exponential diffusion–decay dimension was run in FitAID6 for both water and metabolites. Metabolites of interest include citrate (Cit), total choline (tCho), spermine (Spe), myo-inositol (mI), total creatine (tCr). Absolute quantification was performed referencing to the total water signal7, with corrections for T1 and T2 relaxation.8 Details of the specifically optimized DW-MRS methodology and results from healthy subjects are reported in a separate submission where 6 b-values were recorded, leading to better precision and relatively lower ADC values, and the potential to distinguish luminal (LS) and cellular space. Here, we investigate a minimal setup with 3 b-values respecting clinical time constraints.
The fractional volume of tumor tissue was qualitatively estimated with SpectrIm9 using ADC maps.
Results & Discussion
Fig.1 presents results for PCa. Good fit results can be monitored from white Gaussian-distributed residues. Given the hardly visible peaks for Cit and tCr, tissue concentrations and ADC values are only reported for tCho and water. CPPS patients are portrayed in Fig.2 with fit results for all metabolites (CPPS#1: acute prostatitis, CPPS#2: chronic inflammation). Fig.3 depicts average spectra and results from the healthy cohort. The metabolite tissue contents are in-line with those published previously8,10, with Cit levels typical for the transition zone, in agreement that this area covered most of the VOI. Separated metabolite patterns are included to demonstrate spectral overlap.Fig.4 compares tissue concentrations and ADC values between the average healthy cohort and the pathologic cases. For metabolite ADCs, there are no values from the literature to compare to. They are instead critically reviewed with respect to plausibility given the knowledge on prostate cellular microstructure.
PCa vs. healthy cohort:
- The ADC for tCho is found to be substantially lower in both patients. Given that tCho resides intracellularly11 and cells are denser in tumorous tissue, the reduction in ADC may be well explained given a diffusion time ensuring metabolite diffusion to be restricted by cell size. Surprisingly, there is hardly any and even inconsistent literature on this also from other organs.12,13
- As expected,7,11 tCho concentration is higher in tumor tissue.
CPPS vs. healthy cohort:
- Based on only two cases, one could speculate that the ADCs of mI and tCr are lowered in CPPS.
- Similarly, for metabolite contents, no certain trend is seen, potentially, tCr and Cit may turn out to range consistently lower. Reduced Cit levels would reflect a smaller LS, expected in such pathology.14
- The chronic inflammation case (CPPS #2) shows comparable tCho and lower mI content, whereas the acute prostatitis case (CPPS #1) shows higher tCho and mI content.
Water ADCs are aligned with literature values.15–17 Both PCa and CPPS report lower water ADCs compared to healthy tissue, as expected for reduced luminal space. ADCs are lower in PCa than CPPS with values within reported distributions.15
Conclusions
Initial results for prostate cancer and prostatitis show the potential of DW-MRS for the characterization of microstructural changes in prostate pathology, even in a clinical time frame. Longer dedicated exams with more and higher b-values would no doubt provide more precise information, which may also include quantifying loss of luminal space from water data17,18. The latter would also allow partial volume correction of metabolite concentrations, which might lead to enhanced specificity of MRS findings. Statistical investigations on a more significant patient cohort are obviously required to consolidate the initial findings – particularly for reduced ADCs of tCho in PCa.Acknowledgements
This work is supported by the Marie-Sklodowska-Curie Grant #813120 (Inspire-Med) and the Swiss National Science Foundation (#320030-175984).References
- Ronen I, Valette J. Diffusion-Weighted Magnetic Resonance Spectroscopy. In: EMagRes. John Wiley & Sons, Ltd; 2015:733-750. http://dx.doi.org/10.1002/9780470034590.emrstm1471
- Le Bihan D. Molecular diffusion, tissue microdynamics and microstructure. NMR Biomed. 1995;8(7-8):375-386. http://www.ncbi.nlm.nih.gov/pubmed/8739274
- Palombo M, Shemesh N, Ronen I, Valette J. Insights into brain microstructure from in vivo DW-MRS. Neuroimage. 2018;182:97-116. doi:https://doi.org/10.1016/j.neuroimage.2017.11.028
- Şimşek K, Döring A, Pampel A, Möller HE, Kreis R. Macromolecular background signal and non-Gaussian metabolite diffusion determined in human brain using ultra-high diffusion weighting. Magn Reson Med. 2022;88(5):1962-1977. doi:10.1002/MRM.29367
- Döring A, Adalid V, Boesch C, Kreis R. Diffusion-weighted magnetic resonance spectroscopy boosted by simultaneously acquired water reference signals. Magn Reson Med. 2018;80(6):2326-2338. doi:10.1002/mrm.27222
- Chong DGQ, Kreis R, Bolliger CS, Boesch C, Slotboom J. Two-dimensional linear-combination model fitting of magnetic resonance spectra to define the macromolecule baseline using FiTAID, a Fitting Tool for Arrays of Interrelated Datasets. Magn Reson Mater Physics, Biol Med. 2011;24:147-164. doi:10.1007/s10334-011-0246-y
- Tayari N, Wright AJ, Heerschap A. Absolute choline tissue concentration mapping for prostate cancer localization and characterization using 3D 1 H MRSI without water-signal suppression. Magn Reson Med. 2022;87(2):561-573. doi:10.1002/MRM.29012
- Tayari N, Heerschap A, Scheenen TWJ, Kobus T. In-vivo MR spectroscopic imaging of the prostate, from application to interpretation. Anal Biochem. 2017;529:158-170. https://www.sciencedirect.com/science/article/pii/S000326971730060X
- Pedrosa de Barros N, Mckinley R, Knecht U, Wiest R, Slotboom J. Automatic quality control in clinical 1H MRSI of brain cancer. NMR Biomed. 2016;29(5):563-575. doi:10.1002/nbm.3470
- Weis J, von Below C, Tolf A, et al. Quantification of metabolite concentrations in benign and malignant prostate tissues using 3D proton MR spectroscopic imaging. J Magn Reson Imaging. 2017;45(4):1232-1240. doi:10.1002/JMRI.25443
- Stamatelatou A, Scheenen TWJ, Heerschap A. Developments in proton MR spectroscopic imaging of prostate cancer. MAGMA. 2022;35(4):645. doi:10.1007/S10334-022-01011-9
- Harada M, Uno M, Hong F, Hisaoka S, Nishitani H, Matsuda T. Diffusion-weighted in vivo localized proton MR spectroscopy of human cerebral ischemia and tumor. NMR Biomed. 2002;15(1):69-74.
- Hakumäki JM, Poptani H, Puumalainen AM, Loimas S, Paljärvi LA, Ylä-Herttuala Kauppinen SRA. Quantitative 1H nuclear magnetic resonance diffusion spectroscopy of BT4C rat glioma during thymidine kinase-mediated gene therapy in vivo: identification of apoptotic response. Cancer Res. 1998;58(17):3791-3799.
- Shukla-Dave A, Hricak H, Eberhardt SC, et al. Chronic Prostatitis: MR Imaging and 1H MR Spectroscopic Imaging Findings—Initial Observations1. Radiology. 2004;231(3):717-724. doi:10.1148/RADIOL.2313031391
- Nagel KNA, Schouten MG, Hambrock T, et al. Differentiation of Prostatitis and Prostate Cancer by Using Diffusion-weighted MR Imaging and MR-guided Biopsy at 3 T. Radiology. 2013;267(1):164-172. doi:10.1148/RADIOL.12111683
- Liu X, Peng W, Zhou L, Wang H. Biexponential apparent diffusion coefficients values in the prostate: Comparison among normal tissue, prostate cancer, benign prostatic hyperplasia and prostatitis. Korean J Radiol. 2013;14(2):222-232. doi:10.3348/KJR.2013.14.2.222
- Shinmoto H, Oshio K, Tanimoto A, et al. Biexponential apparent diffusion coefficients in prostate cancer. Magn Reson Imaging. 2009;27(3):355-359. doi:10.1016/J.MRI.2008.07.008
- Lemberskiy G, Fieremans E, Veraart J, Deng FM, Rosenkrantz AB, Novikov DS. Characterization of prostate microstructure using water diffusion and NMR relaxation. Front Phys. Published online September 25, 2018. doi:10.3389/FPHY.2018.00091
Figures
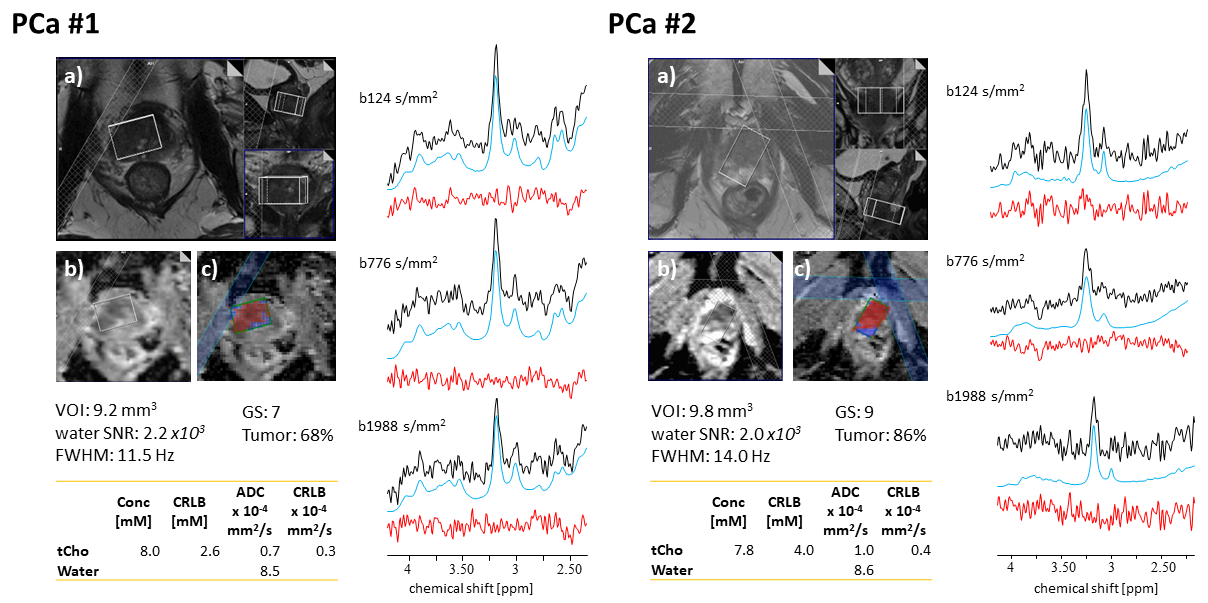
Fig. 1: PCa patients. a) T2w, b) and c) ADC axial images with voxel segmentation. Measured spectra (black), fitted model (blue), and residues (red) for the 3 b-values. Assessment of spectral quality via water-referenced time domain SNR and Full-Width Half-Maximum (FWHM) averaged over b-values. The volume of Interest (VOI), Gleason Score (GS), and tumor fraction from the segmentation map are also reported. Tissue concentrations, ADCs, and estimates’ precision (Cramer Rao Lower Bound, CRLB) are reported for water and tCho.
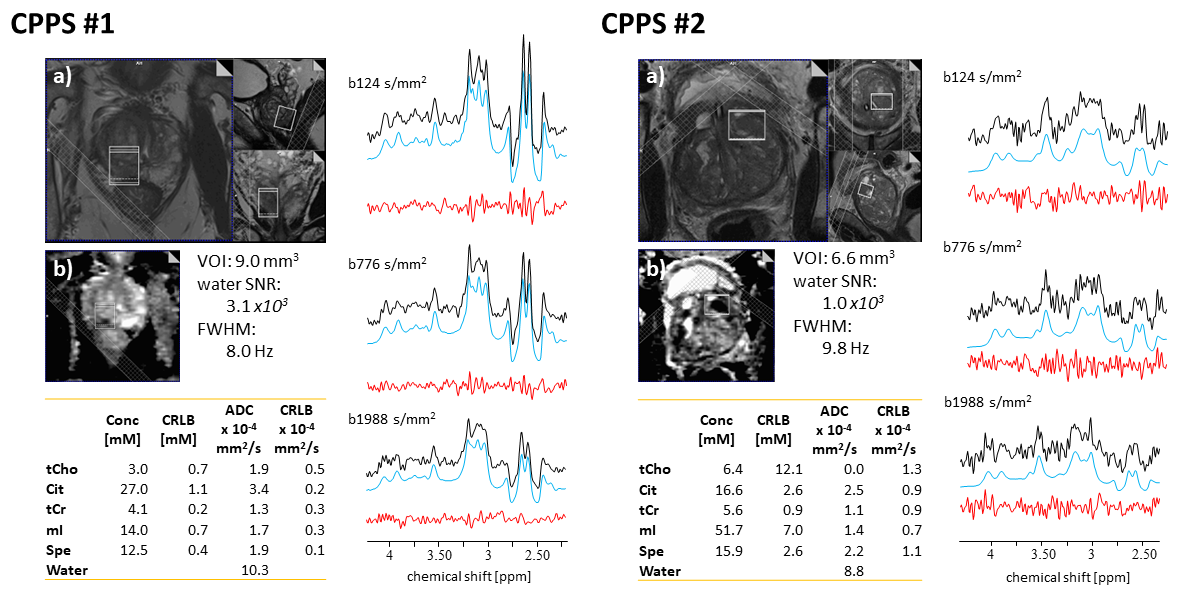
Fig. 2 Prostatitis patients. a) T2w, b) ADC MRI. Measured spectra (black), fitted model (blue), and residues (red) for the 3 b-values. Assessment of spectral quality via water-referenced time domain SNR and Full-Width Half-Maximum (FWHM) averaged over b-values. The volume of Interest (VOI) and tissue concentrations, ADCs, and estimates’ precision (Cramer Rao Lower Bound, CRLB) are reported for water, tCho, Cit, tCr, mI, and Spe.
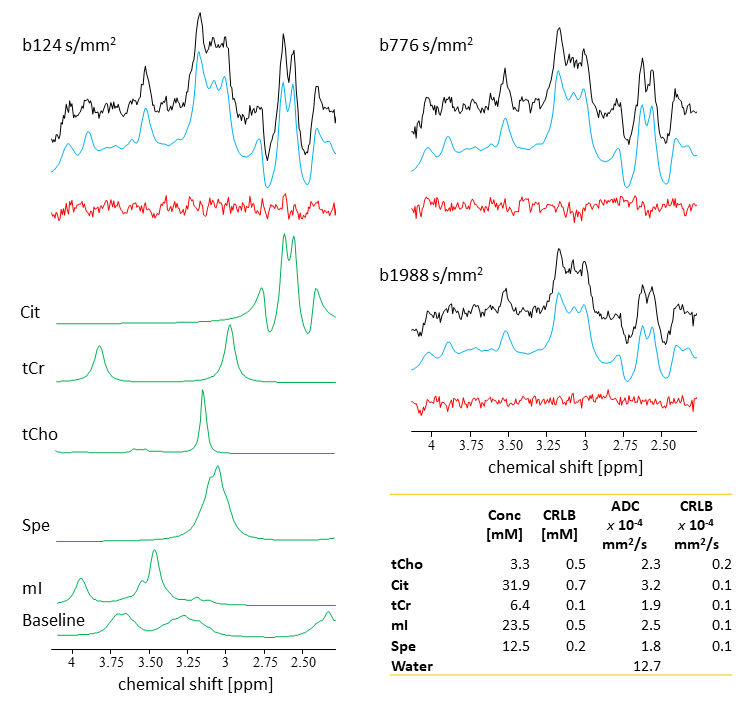
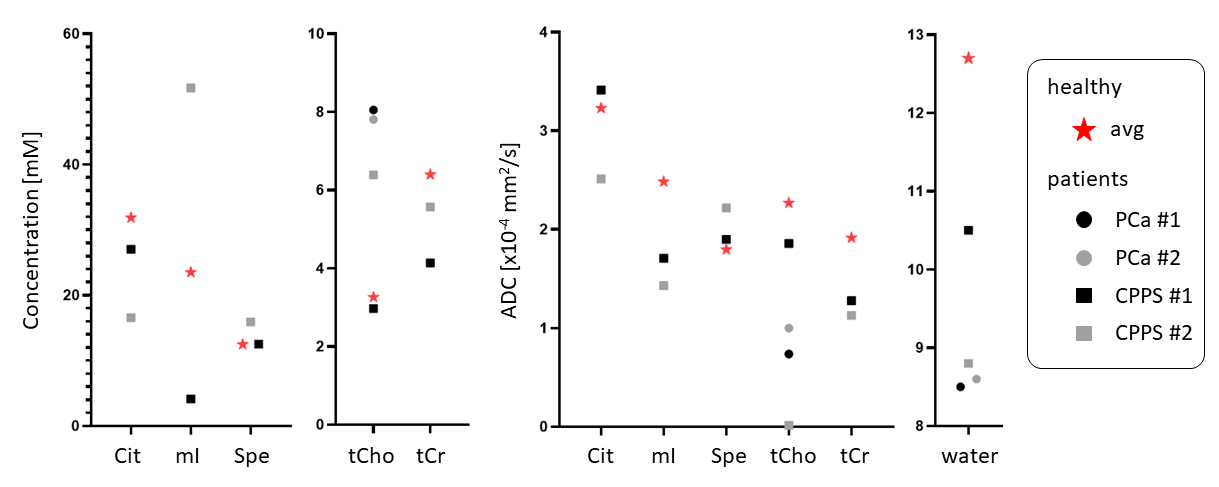
Fig. 4. Comparison of findings for metabolite concentrations and ADCs for metabolite and water for the initial four patients with PCa (circles) and prostatitis (squares) in relation to the norm from 9 healthy subjects (star).