1867
Studying variation in DWI MRI derived ADC for Prostate Cancer (PCa) with respect to Gleason Grade and location of PCa lesions
Sudhanya Chatterjee1, Dattesh Dayanand Shanbhag1, Aanchal Mongia1, Uday Patil1, Adele Courot2, Nicolas Gogin2, and Rakesh Mullick1
1GE Healthcare, Bangalore, India, 2GE Healthcare, Buc, France
1GE Healthcare, Bangalore, India, 2GE Healthcare, Buc, France
Synopsis
Keywords: Prostate, Cancer, DWI, ADC, Gleason grade
Diffusion weighted MRI (DWI) derived apparent diffusion coefficient (ADC) is a marker of the extent of restrictive diffusion in tissues. Higher Gleason Grade (GG) prostate cancer (PCa) lesions are known to exhibit higher restrictive diffusion. In this study we investigated whether ADC as a tissue biomarker follows the known histopathological behavior of PCa lesions by studying variations in ADC with respect to GG of PCa lesions and its location. We observe that ADC values of lesion voxels, although belonging to same GG, vary based on its location.Introduction
DWI plays a critical role in care pathway for prostate cancer (PCa) since the DWI derived apparent diffusion coefficient (ADC) is known to represent pathological behavior of PCa lesions. Hence, ADC has been widely used as a biomarker in PCa studies. In one part of this study, we observe how well does ADC depict histopathological findings of PCa lesions. This is done by observing variation of ADC values with respect to Gleason Grade (GG) of PCa lesions. Next, we studied whether PCa lesion location needs to be considered while using ADC to assess lesion status. To check this, we observed ADC values in PCa lesions as a function of its location in prostate region.Methods
Subjects: All the data for the study was obtained from the PROSTATEx and PROSTATEx-2 challenge [1, 2, 3]. We considered 204 cases (Training pool only) from both the challenge data. Datasets which had large mis-registration artifacts (assessed using a dashboard and T2-derived prostate segmentation masks on DWI) between T2W and DWI data or did not contain any lesions were not considered for further analysis, yielding a total dataset=191.MRI Scanner and Acquisition: We considered only the axial T2W, and DWI b=50s/mm2 and b=800s/mm2 for ADC computation.
Lesion Marking: The scanner coordinate position of the lesion locations on T2W data are made available through the challenge. Using lesion position information and synchronized cursor feature in ITK-SNAP tool [v 3.6], a senior radiologist marked the lesions separately on T2W and DWI b= 800 s/mm2 images with the paintbrush tool. PI-RADS V2.1 criteria were used for identifying and marking the lesions. The two lesion masks on T2W and DWI were then merged with identity transform resampling in SimpleITK (v2.1.1.2).
Lesion Grading: PROSTATEx data has information regarding the lesion in terms of benign vs malignant while PROSTATEx-2 [4] data has information on the lesion Gleason Grade (GG). We used this information to merge lesion grade with their respective position information in all the cases. All the cases in which no biopsy was done post PIRAD scoring (diagnosed as benign lesions) in PROSTATEx study were not considered in this study.
Prostate Parcellation: The prostate gland and the prostate peripheral zone (PZ) was automatically segmented on axial T2W images using an in-house deep learning algorithm.
Analysis: We obtained voxel-wise values for ADC within lesions, and its corresponding GG and location. We considered three locations for each voxel – peripheral zone in prostate (PZ), in prostate but not in PZ (not PZ) and outside prostate. ADC values were plotted for the voxels along GG for the corresponding voxel and grouped by location of the lesion voxel. An example is for prostate zones considered for lesion location has been shown in Figure-1.
Result and Discussion
PCa lesion voxel population per GG, which are further grouped by its location are shown in Figure-2. Mean and standard deviation of each group considered in this analysis are also stated in Figure-2.Box plots and point statistics of the ADC values in PCa lesions are shown in Figure-3 and Figure-4. Following are the important observations from the plots shown:
- ADC values tend to reduce as GG of lesion increases (refer Figure-4). This agrees with the expected pathology behavior of PCa lesions (implying restricted diffusion) [5]. Slight deviation of trend is observed for PCa lesions located outside prostate while GG of lesions progress from 7 to 8.
- Although trend remains similar across PCa lesions, ADC values differ based on location of the PCa lesions (refer Figure-3). In most cases, even though PCa lesion voxels belonged to same GG, ADC values were significantly different based on its location. In our study we used Scheffé test for all pairwise comparisons. This is an important observation in context of PCa lesion studies. ADC values of PCa lesions alone might not be sufficient while predicting GS of lesion voxels. Location of the lesions should also be considered while analyzing ADC values used to make clinical decisions or its adoption as a biomarker.
Conclusion
In this study we analyzed ADC values of lesion voxels as a function of its Gleason grade and its location in the prostate. ADC values of lesions largely agree with known pathological behavior of PCa lesions. Location of the lesion should be considered while studying ADC values as a biomarker for PCa studies.Acknowledgements
No acknowledgement found.References
- Geert Litjens, Oscar Debats, Jelle Barentsz, Nico Karssemeijer, and Henkjan Huisman. "ProstateX Challenge data", The Cancer Imaging Archive (2017). DOI: 10.7937/K9TCIA.2017.MURS5CL.
- Litjens G, Debats O, Barentsz J, Karssemeijer N, Huisman H. "Computer-aided detection of prostate cancer in MRI", IEEE Transactions on Medical Imaging 2014;33:1083-1092. DOI: 10.1109/TMI.2014.2303821.
- Clark K, Vendt B, Smith K, Freymann J, Kirby J, Koppel P, Moore S, Phillips S, Maffitt D, Pringle M, Tarbox L, Prior F. The Cancer Imaging Archive (TCIA): Maintaining and Operating a Public Information Repository, Journal of Digital Imaging, Volume 26, Number 6, December 2013, pp 1045-1057. DOI: 10.1007/s10278-013-9622-7.
- https://www.aapm.org/GrandChallenge/PROSTATEx-2/
- Manetta R, Palumbo P, Gianneramo C, Bruno F, Arrigoni F, Natella R, Maggialetti N, Agostini A, Giovagnoni A, Di Cesare E, Splendiani A, Masciocchi C, Barile A. Correlation between ADC values and Gleason score in evaluation of prostate cancer: multicentre experience and review of the literature. Gland Surg. 2019 Sep;8(Suppl 3):S216-S222. doi: 10.21037/gs.2019.05.02. PMID: 31559188; PMCID: PMC6755951.
Figures
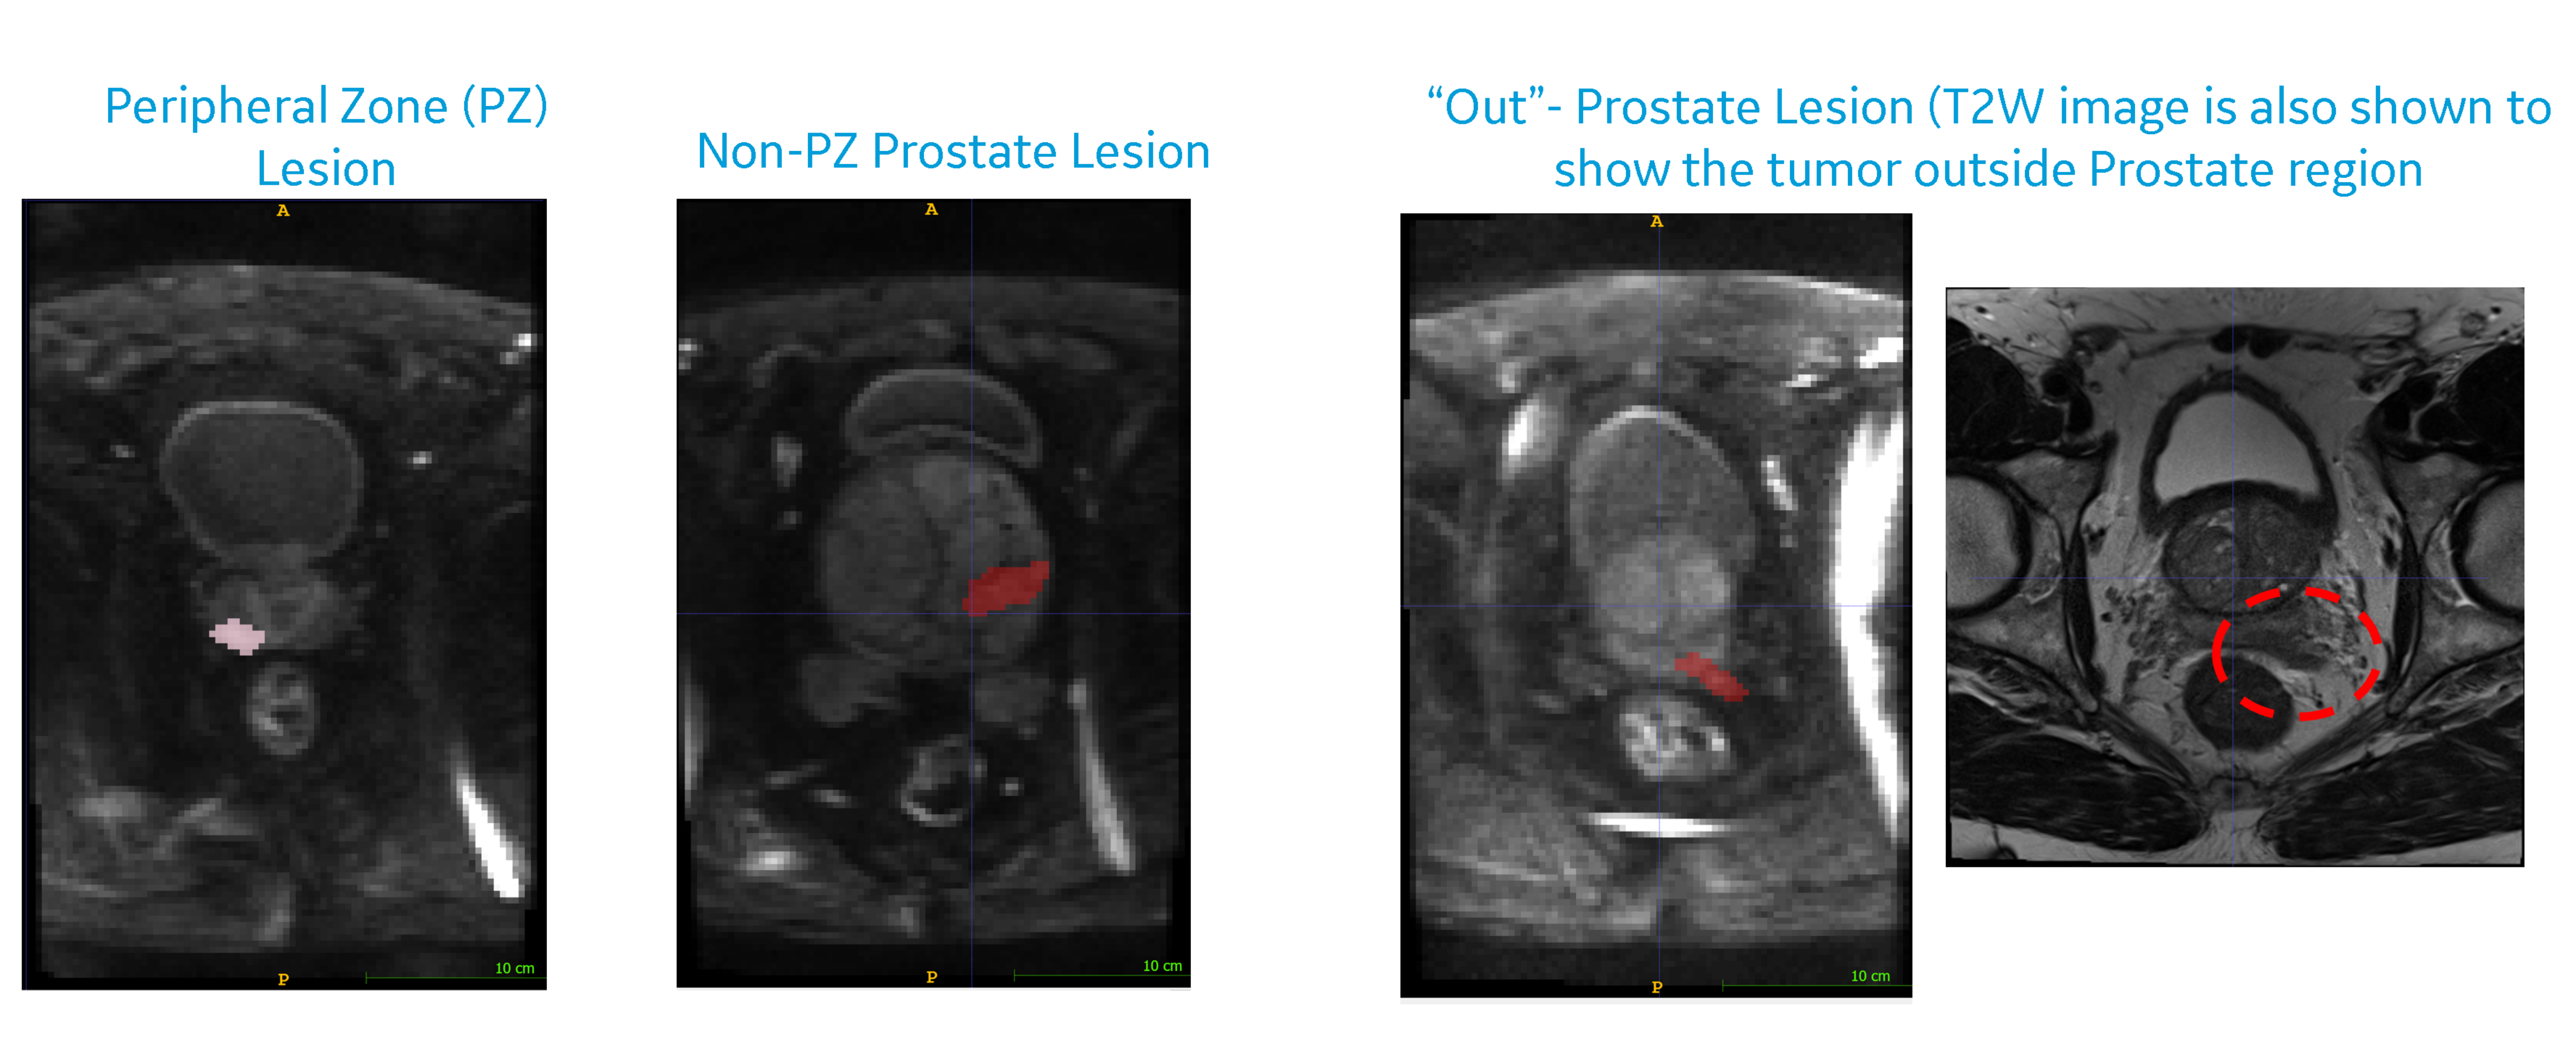
Figure-1: In
this figure we show examples of PCa lesions in different locations. (Left)
Example is shown for lesion in peripheral zone (PZ) of prostate, and within the
prostate but not in PZ. (Right) Example is shown for lesion located outside
prostate.
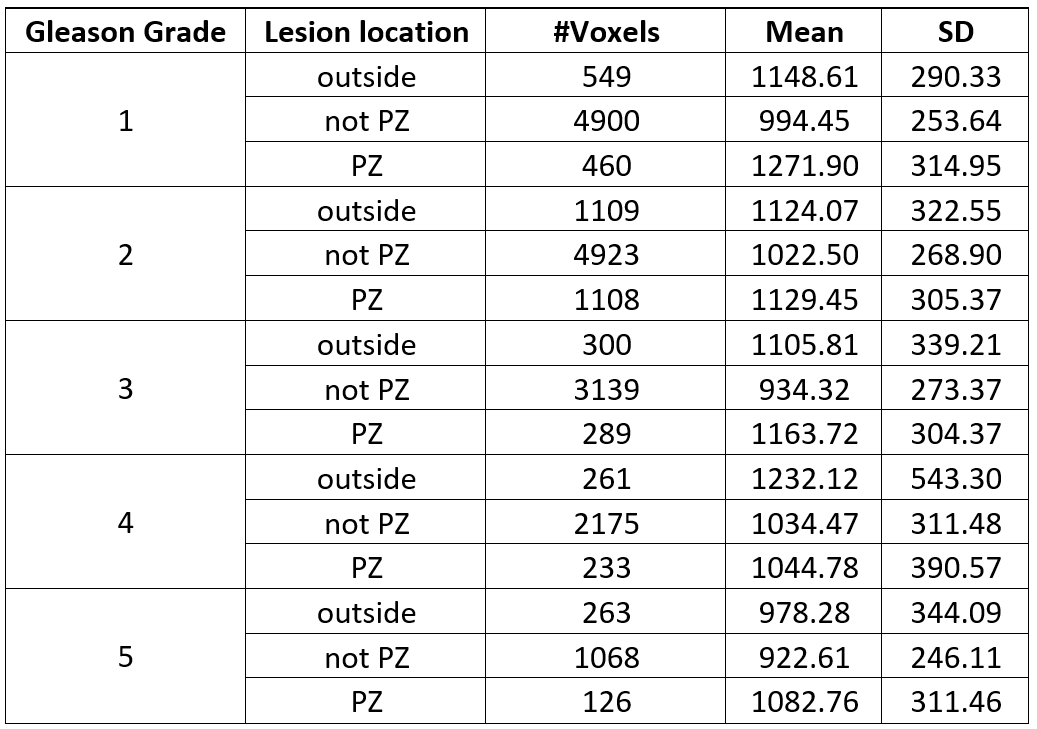
Figure-2: This figure shows population, mean and standard deviation for lesion voxels corresponding to a GG score and which are further grouped by lesion locations as defined in the Methods section. Units for mean and standard deviation (SD) of ADC values are as mm2/s
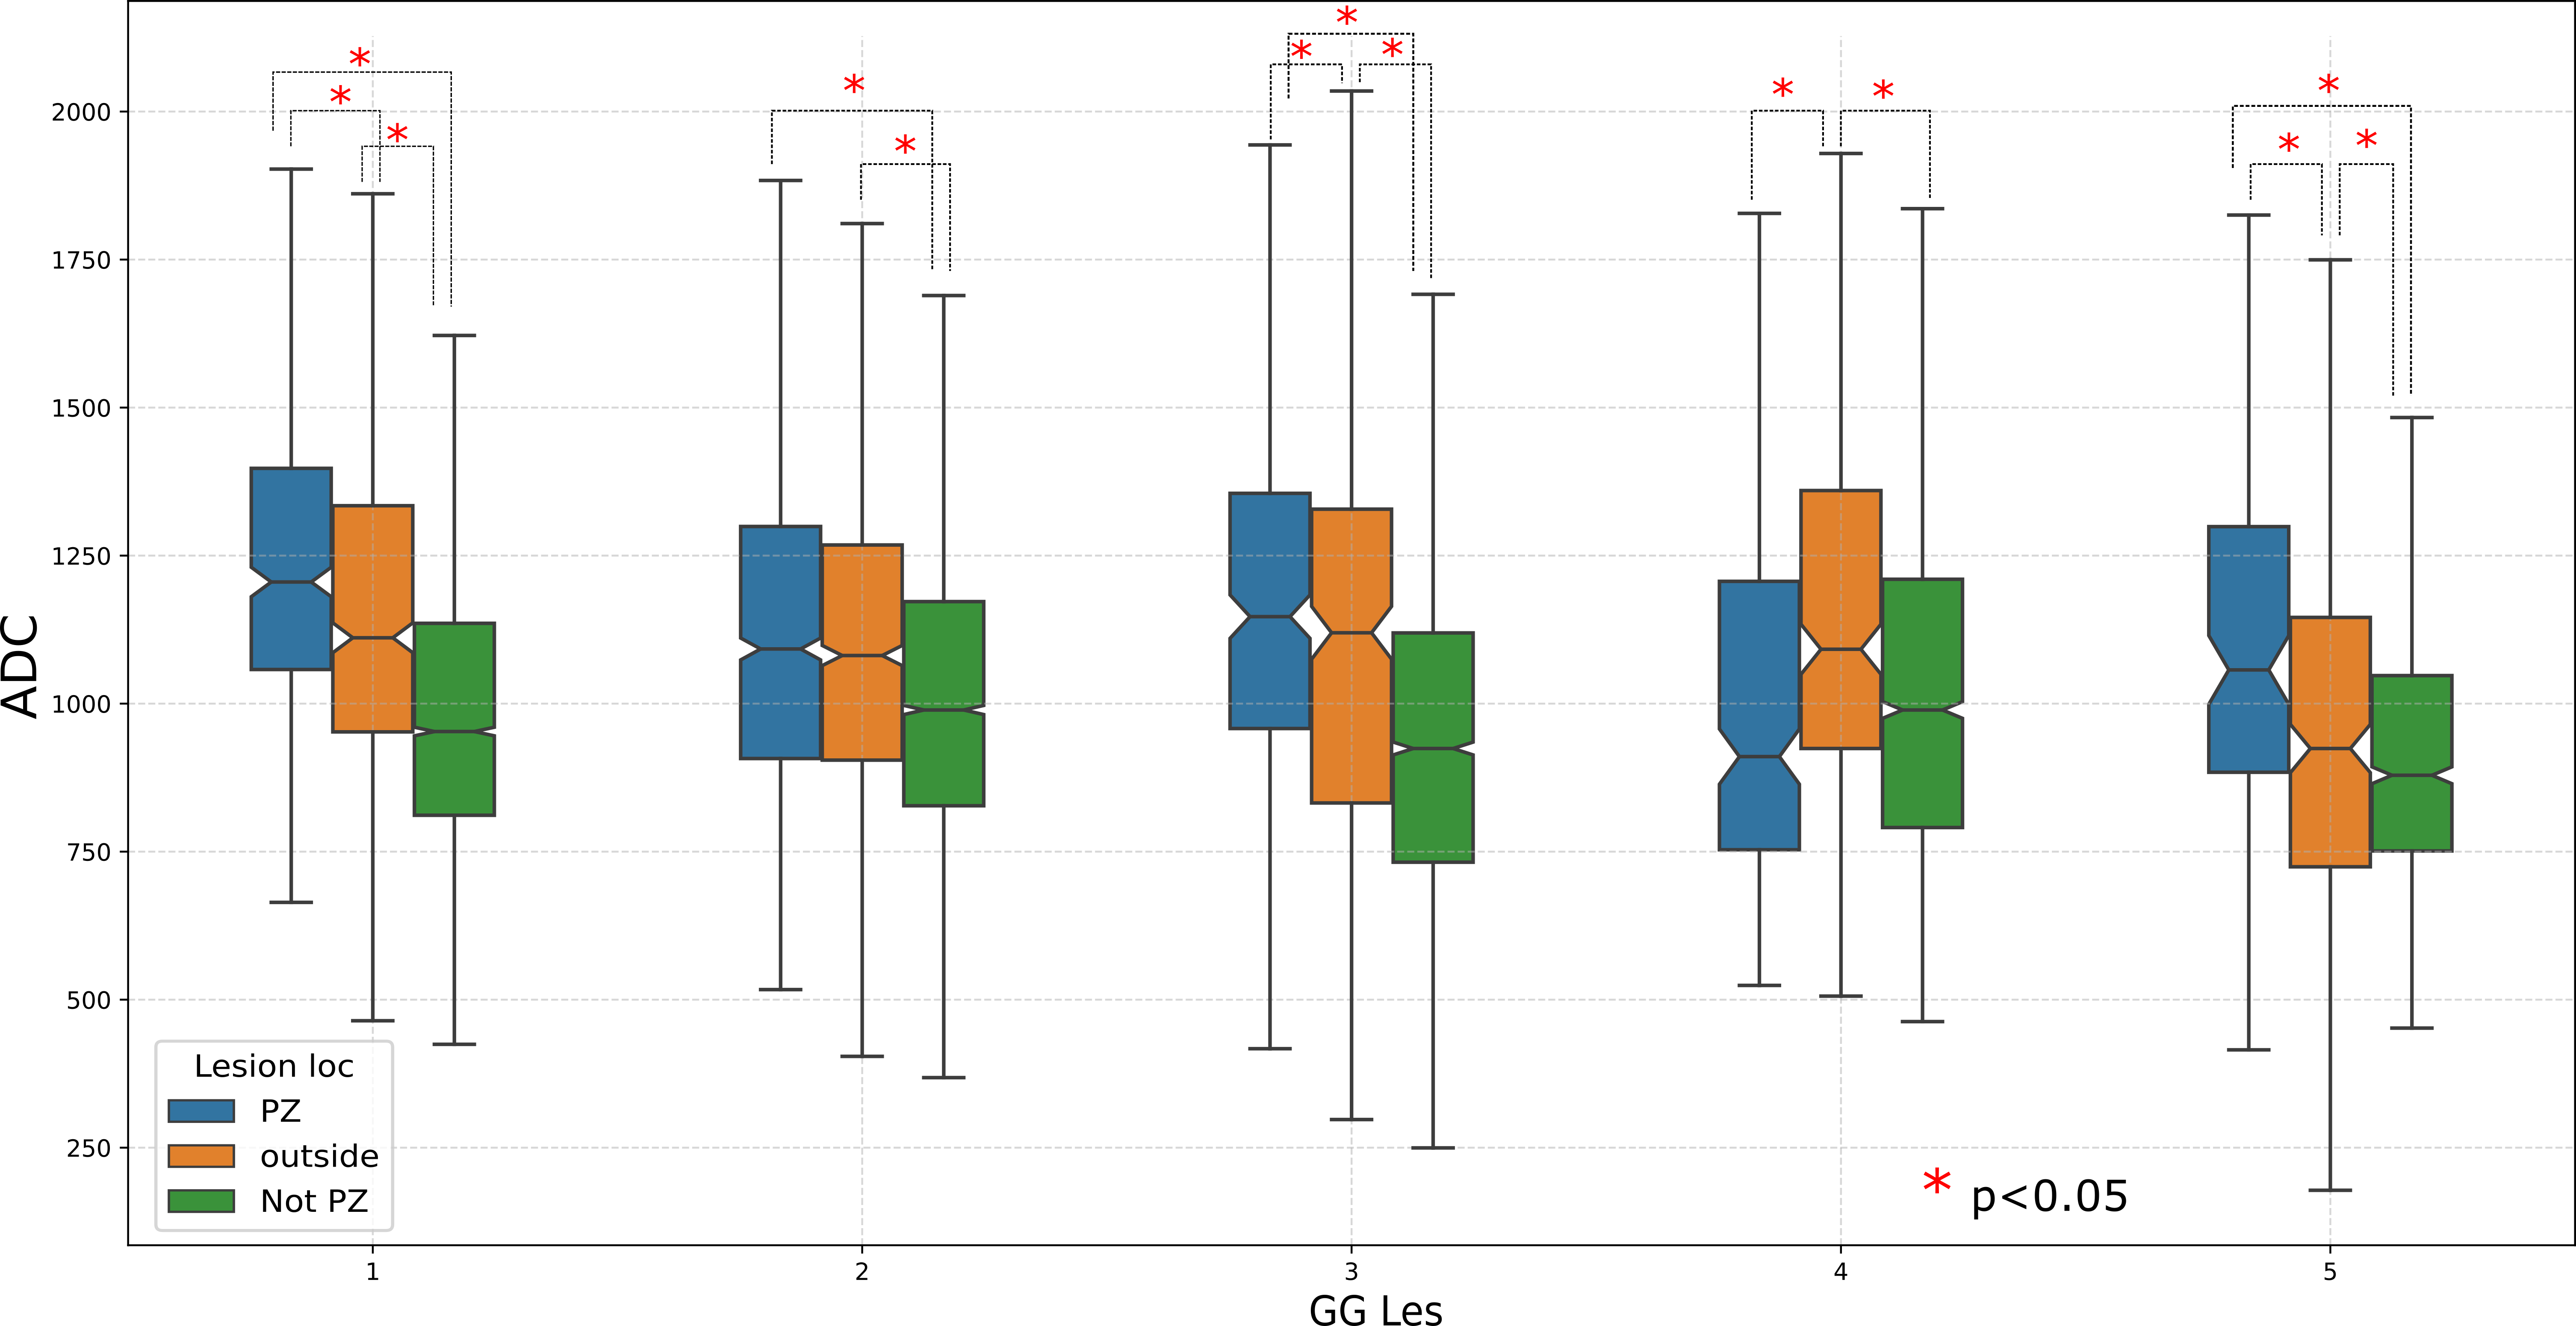
Figure-3: This figure shows box
plots of the ADC values of PCa lesion voxels w.r.t Gleason grade of lesions and
grouped by lesion location. We observe that although lesion voxels belong to same GG score, the ADC values differ significantly based on lesion location for majority of the comparisons.
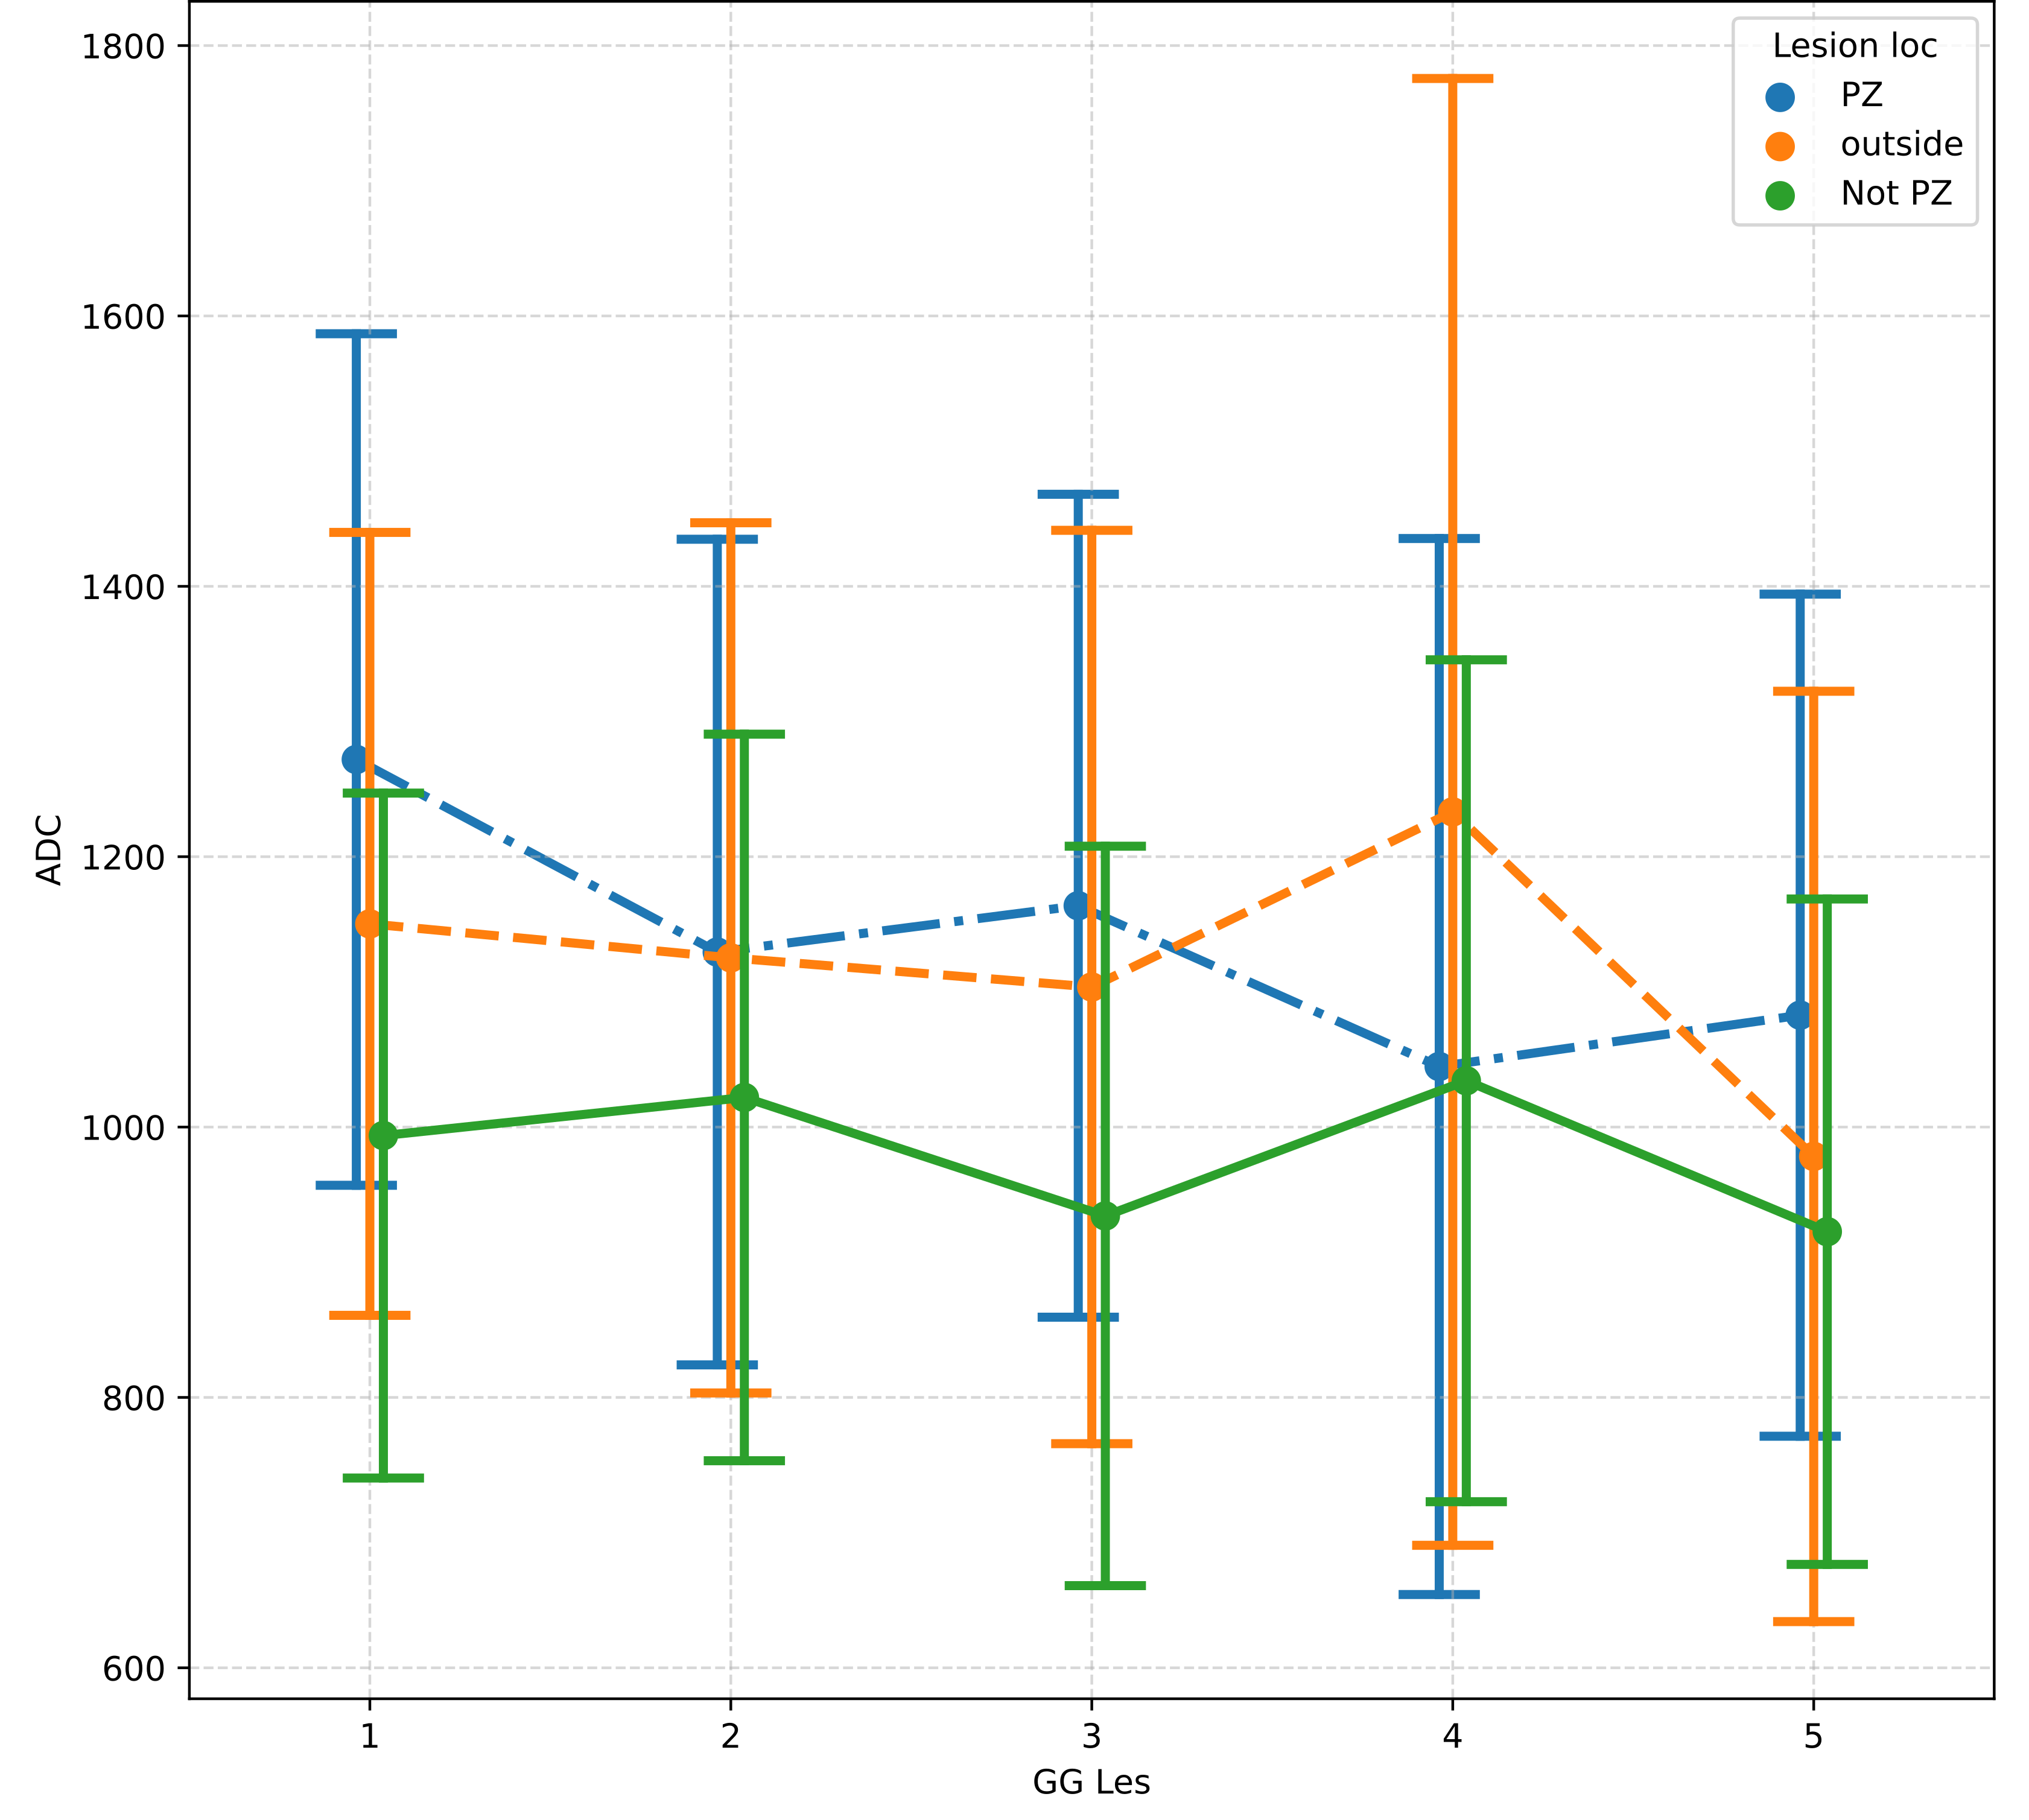
Figure-4: Point
plots of the ADC values of PCa lesion voxels w.r.t Gleason grade of lesions and
grouped by lesion location where points
correspond to mean values and bounds represent standard deviation. Observations agree with the expected pathology behavior of
PCa lesions. Slight deviation of trend is
observed for PCa lesions located outside prostate while GG of lesions progress
from 7 to 8
DOI: https://doi.org/10.58530/2023/1867