1864
Study of deep-learning models for detection and localization of early-stage clinically significant prostate cancer on mpMRI
Zhaonan Sun1, Xiaoying Wang2, and Kexin Wang3
1Department of Radiology, Peking University First Hospital, Beijing, China, 2Department of Radiology, Peking University First Hospital, Beijing, China, 3School of Basic Medical Sciences, Capital Medical University, Beijing, China
1Department of Radiology, Peking University First Hospital, Beijing, China, 2Department of Radiology, Peking University First Hospital, Beijing, China, 3School of Basic Medical Sciences, Capital Medical University, Beijing, China
Synopsis
Keywords: Prostate, Cancer
The purpose of this study was to explore the best sequences for fully automated detection and localization of early-stage csPCa with a PSA range of 4-10 ng/mL.1628 prostate mpMRI examined with seven scanners were retrospectively enrolled. A training dataset (n=1428) was used to train models, i.e., a diffusion model was trained with diffusion-weighted imaging, and a biparametric model was trained with diffusion-weighted imaging and T2-weighted imaging. A hold-out test dataset (n=200) was reserved for validation. Our research shows that the diffusion model trained using ADC and DWI achieved best performance in detection and localization of early-stage csPCa.Abstract Body
Background: Deep-learning for diagnosis clinically significant prostate cancer (csPCa) is feasible but needs to be further evaluated in patients with PSA of 4-10 ng/mL.Purpose: The purpose of this study was to develop and compare two deep-learning-based models trained using diffusion images with or without T2WI, to explore the best sequences for fully automated detection and localization of early-stage csPCa with a PSA range of 4-10 ng/mL.Materials and Methods: A total of 1628 patients were included in this study, of which 78.7% (1282/1628) underwent TRUS-guided systematic biopsy plus cognitive-targeted biopsy and clinical follow up, and 21.3% (346/1628) underwent radical prostatectomy. Of the 1628 patients, 748 patients had PSA serum levels of 4∼10 ng/mL. We selected 200 patients (100 PCa, 100 non-PCa) from the patients with PSA serum levels of 4∼10 ng/mL to bild a hold-out test dataset to evaluate and compare. The rest 1428 patients were used to develop models and were randomly allocated into the dataset of the train (total 1142, 719 PCa, 423 non-PCa), validation (total 143, 88 PCa, 55 non-PCa), and test (total 143, 100 PCa, 43 non-PCa) with a ratio of 8:1:1.All examinations were obtained using one of five 3.0 T MR scanners and one of two 1.5 T MR scanners, including diffusion-weighted image (DWI), apparent diffusion coefficient (ADC) map, and T2-weighted image (T2WI).The csPCa was defined as International Society of Urological Pathology (ISUP) grade 2 or higher based on histopathology findings and scored as Gleason score 3 + 4 or higher(1). Two urogenital radiologists retrospectively reviewed all cases and mapped the pathology results of each focus to the MR images with consensus. Ground truth segmentation was manually delineated by the urogenital radiologist and modified by the other urogenital radiologist on DWI using the software ITK-SNAP(2).The diffusion model (DWI and ADC as input) and the biparametric model (DWI, ADC, and T2WI as input) were trained based on U-Net. This is an end-to-end AI model, in other words, there is an automated the whole prostate gland, the anatomic zones and the csPCa lesion step by step. Based on the current capabilities of mpMRI, the csPCa greater than or equal to 0.5cc in volume may be detected(3). Considering the current prevalence of high false positives in artificial intelligence algorithms for prostate cancer, to minimize the influence of very small predicted tumor foci, the outputs were filtered with a threshold value of 0.5cc.All the mpMRI images in the hold-out test dataset were retrospectively interpreted according to PI-RADS version 2.1(4) by an experienced urogenital radiologistwithout dynamic contrast enhancement. The lesions detected were delineated on a prostate sector map(3) embedded instructed report.We take the pathology as the ground truth. At lesion level, the predicted areas of the models overlapping the manual csPCa segmentation lesions with at least one voxel were considered true positive; otherwise, the predicted lesions were considered false positive. At patient level, the prediction of the models was defined as true positive when at least one index lesion, i.e., ISUP Grade >=2, was detected. For location analysis, when one area overlaps with an index lesion, it is considered a true positive area, otherwise, it is considered a true negative area (5). For the PI-RADS assessment, PI-RADS ≥ 3 was considered positive for csPCa. A receiver operating characteristic curve analysis was employed to calculate the area under the curve (AUC) values of both the two models and the PI-RADS assessment. Dice similarity coefficient (DSC) was used to segmentation assessment. The AUCs were compared using the DeLong test. The sensitivity, specificity, and accuracy were calculated and compared using the Chi-square test. A two-sided p < 0.05 was considered statistically significant.Results: The DSC of csPCa segmentation was 0.69±0.28 and 0.67±0.30 for diffusion model and biparametric model (P = 0.184). The lesion-level sensitivity of diffusion model, biparametric model, and PI-RADS assessment was 89.0%, 85.3%, and 90.8% (all P>0.05). At patient level, the area under the curves (AUCs) of diffusion model, biparametric model, and PI-RADS assessment is 0.865, 0.875, and 0.920 (all P > 0.05). The diffusion model had higher sensitivity compared with biparametric model (96.0% vs. 90.0%, P = 0.031) and showed similar specificity (77.0%. vs. 85.0%, P = 0.096). For location analysis, the diffusion model and biparametric model had similar AUCs (sextant-level, 0.895 vs. 0.893, P = 0.777; zone-level, 0.931 vs. 0.917, P = 0.282), and were both higher than PI-RADS assessment (sextant-level, 0.734; zone-level, 0.863, all P<0.05).Conclusion: Our research shows that the diffusion model trained using ADC and DWI achieved best performance in detection and localization of early-stage csPCa and had comparable performance with an experienced radiologist using PI-RADS (Version 2.1).Acknowledgements
NoReferences
1. Epstein JI, Egevad L, Amin MB, Delahunt B, Srigley JR, Humphrey PA. The 2014 International Society of Urological Pathology (ISUP) Consensus Conference on Gleason Grading of Prostatic Carcinoma: Definition of Grading Patterns and Proposal for a New Grading System. The American journal of surgical pathology 2016;40(2):244-252.2. Yushkevich PA, Piven J, Hazlett HC, et al. User-guided 3D active contour segmentation of anatomical structures: significantly improved efficiency and reliability. NeuroImage 2006;31(3):1116-1128.3. Weinreb JC, Barentsz JO, Choyke PL, et al. PI-RADS Prostate Imaging - Reporting and Data System: 2015, Version 2. European urology 2016;69(1):16-40.4. Turkbey B, Rosenkrantz AB, Haider MA, et al. Prostate Imaging Reporting and Data System Version 2.1: 2019 Update of Prostate Imaging Reporting and Data System Version 2. European urology 2019;76(3):340-351.5. Schelb P, Kohl S, Radtke JP, et al. Classification of Cancer at Prostate MRI: Deep Learning versus Clinical PI-RADS Assessment. Radiology 2019;293(3):607-617.Figures
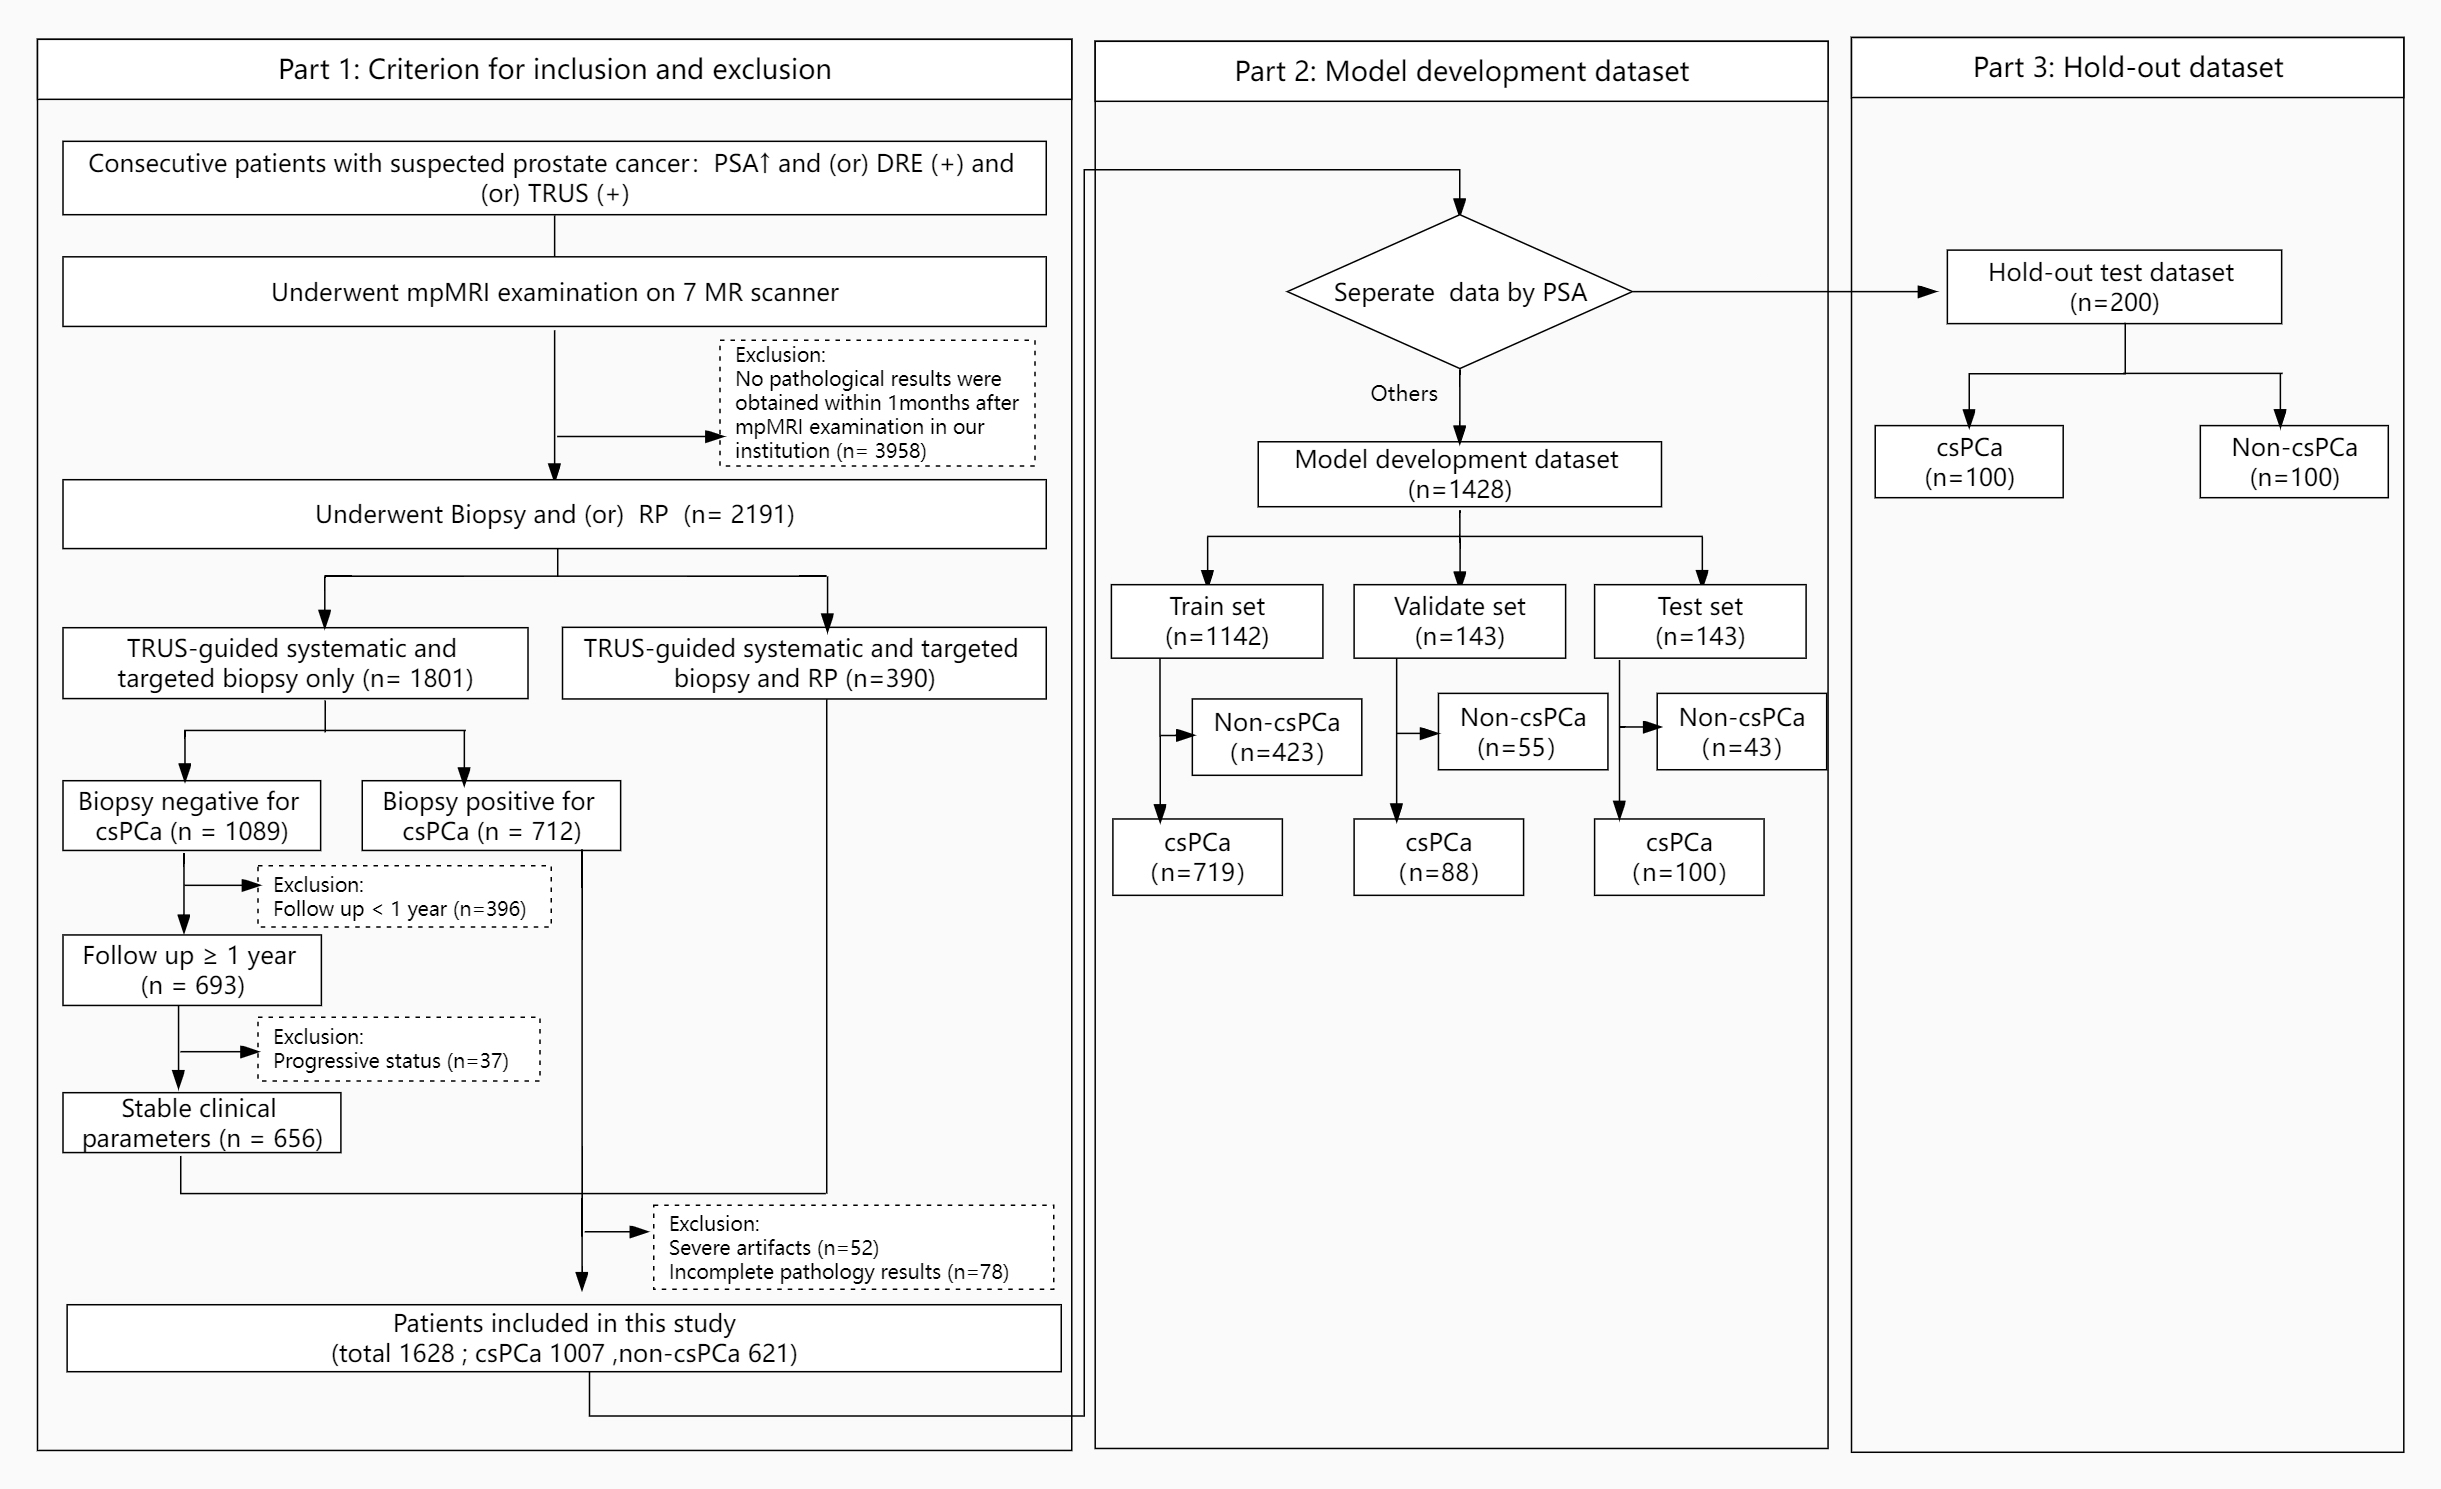
The workflow of patients’ enrollment and distribution. DRE = digital rectal examination, TRUS = transrectal ultrasound, RP = radical prostatectomy, PCa = prostate cancer.
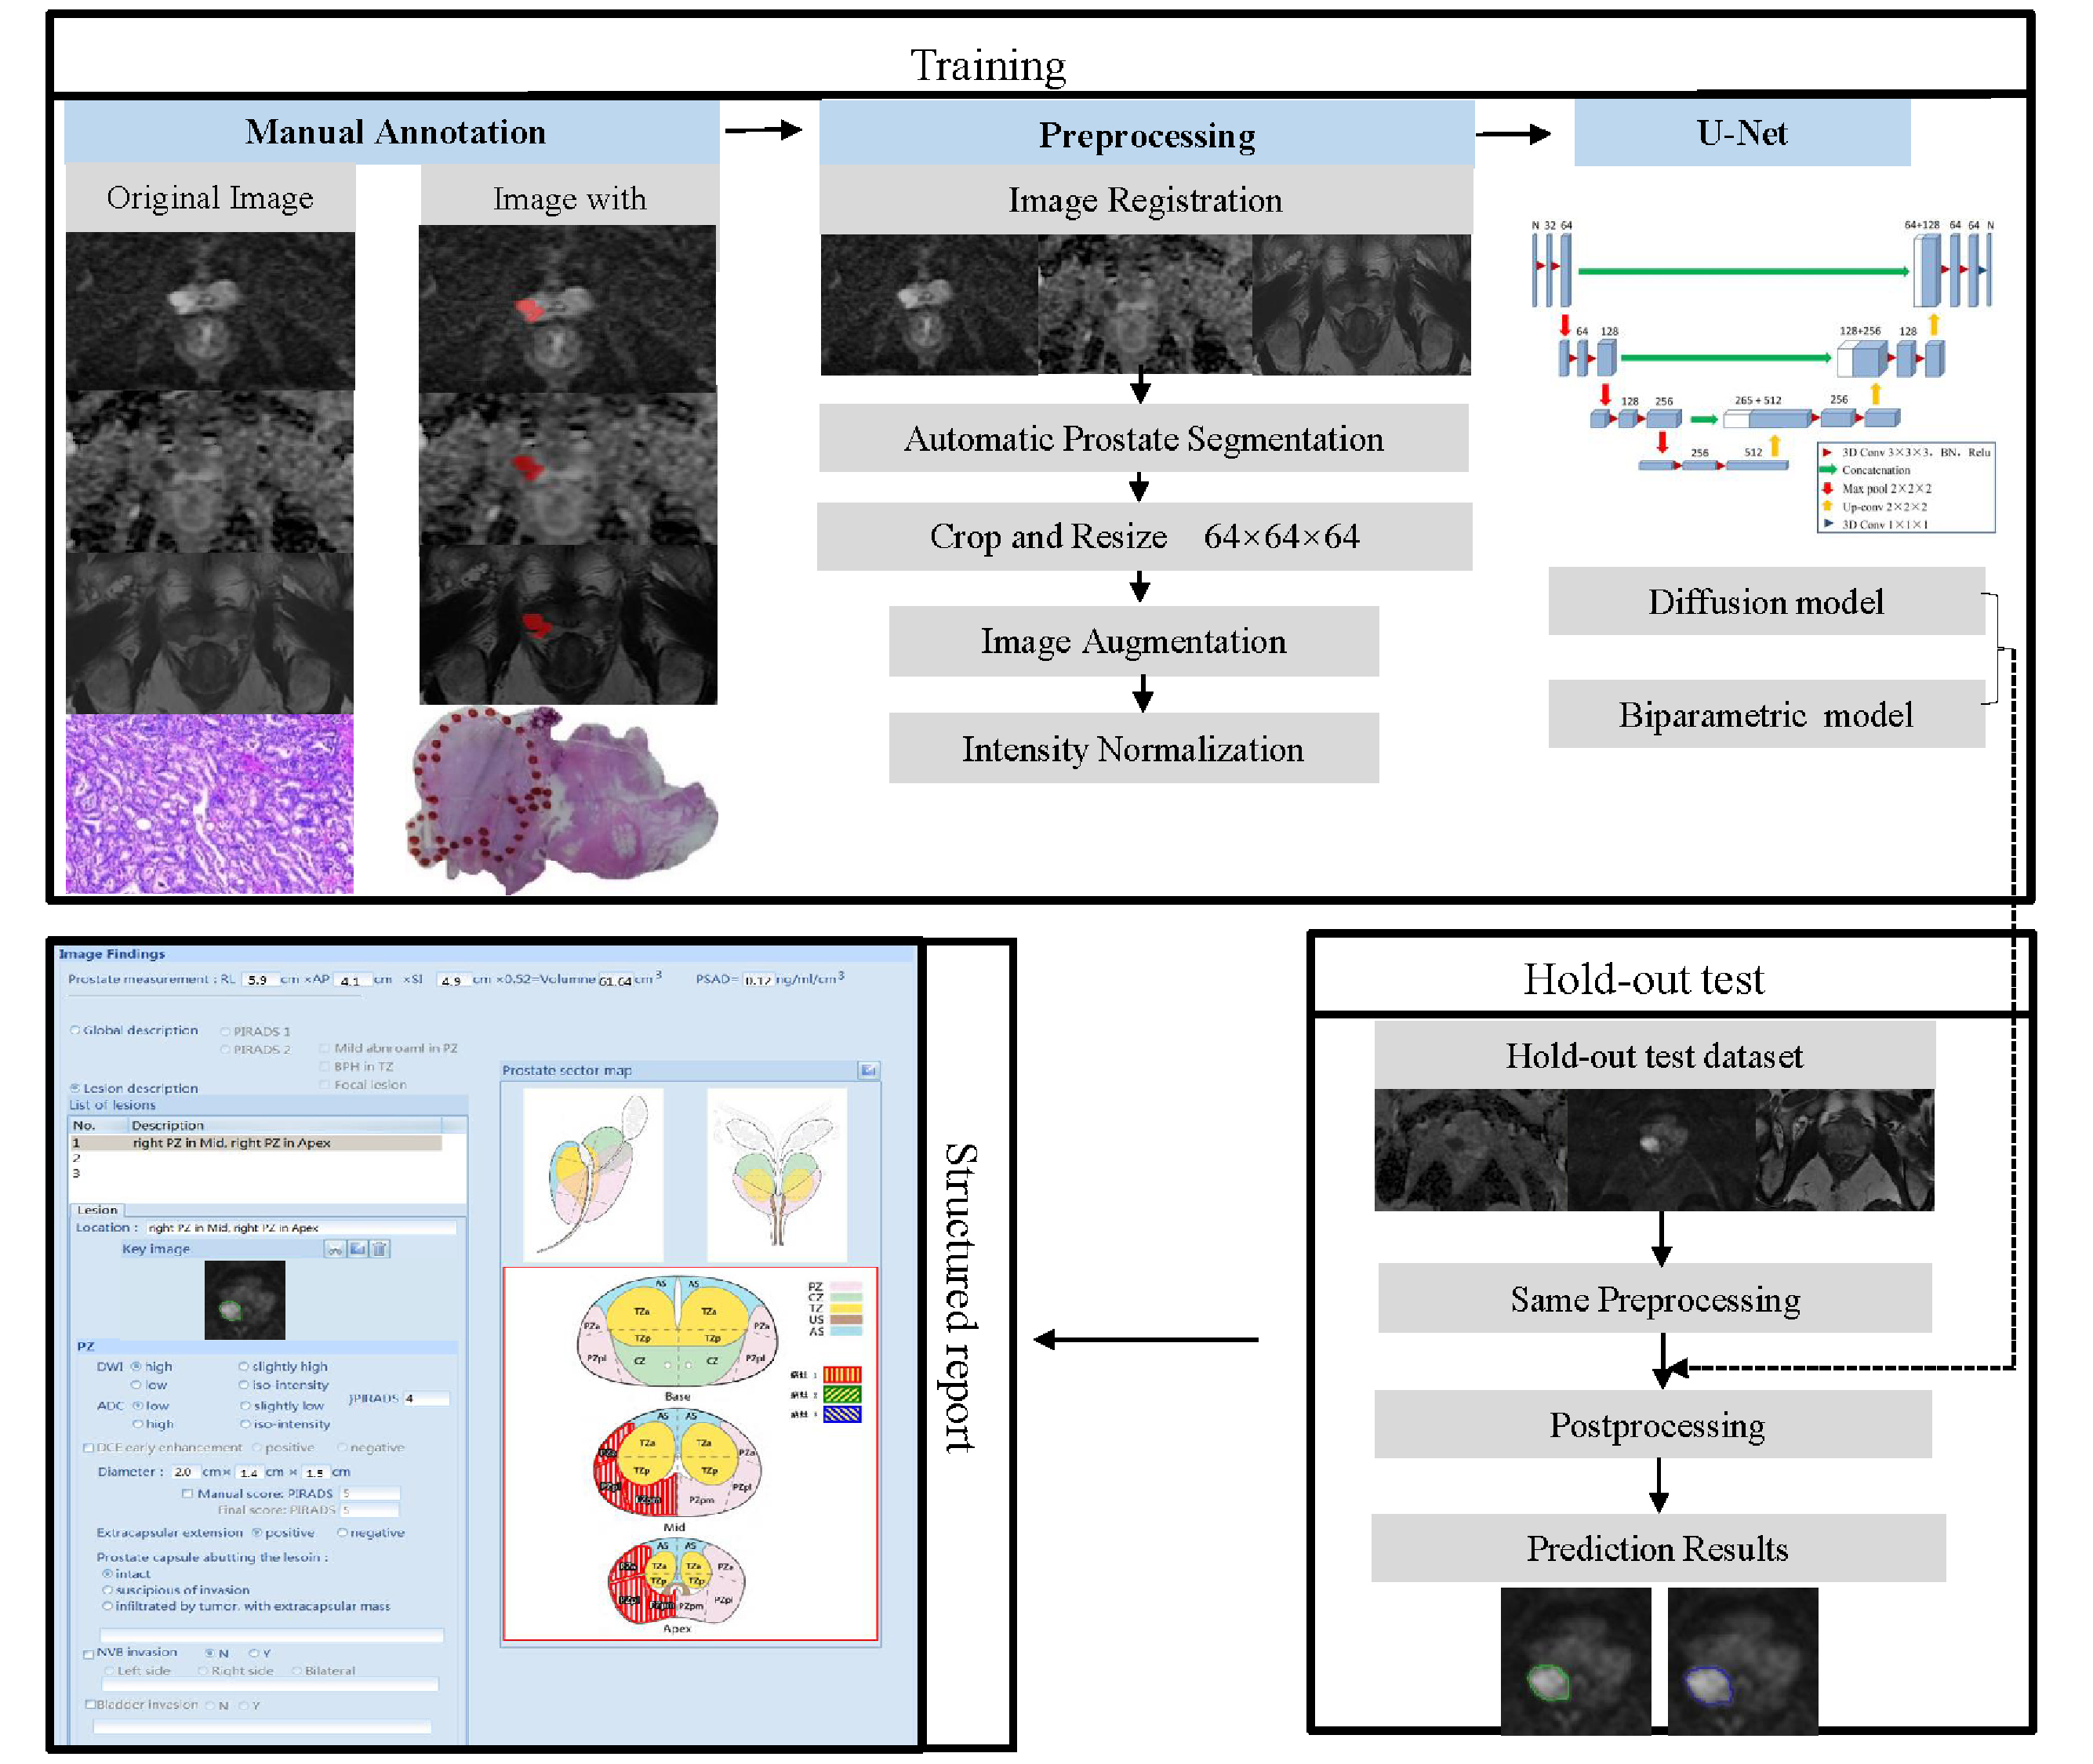
Training and testing process of the models.
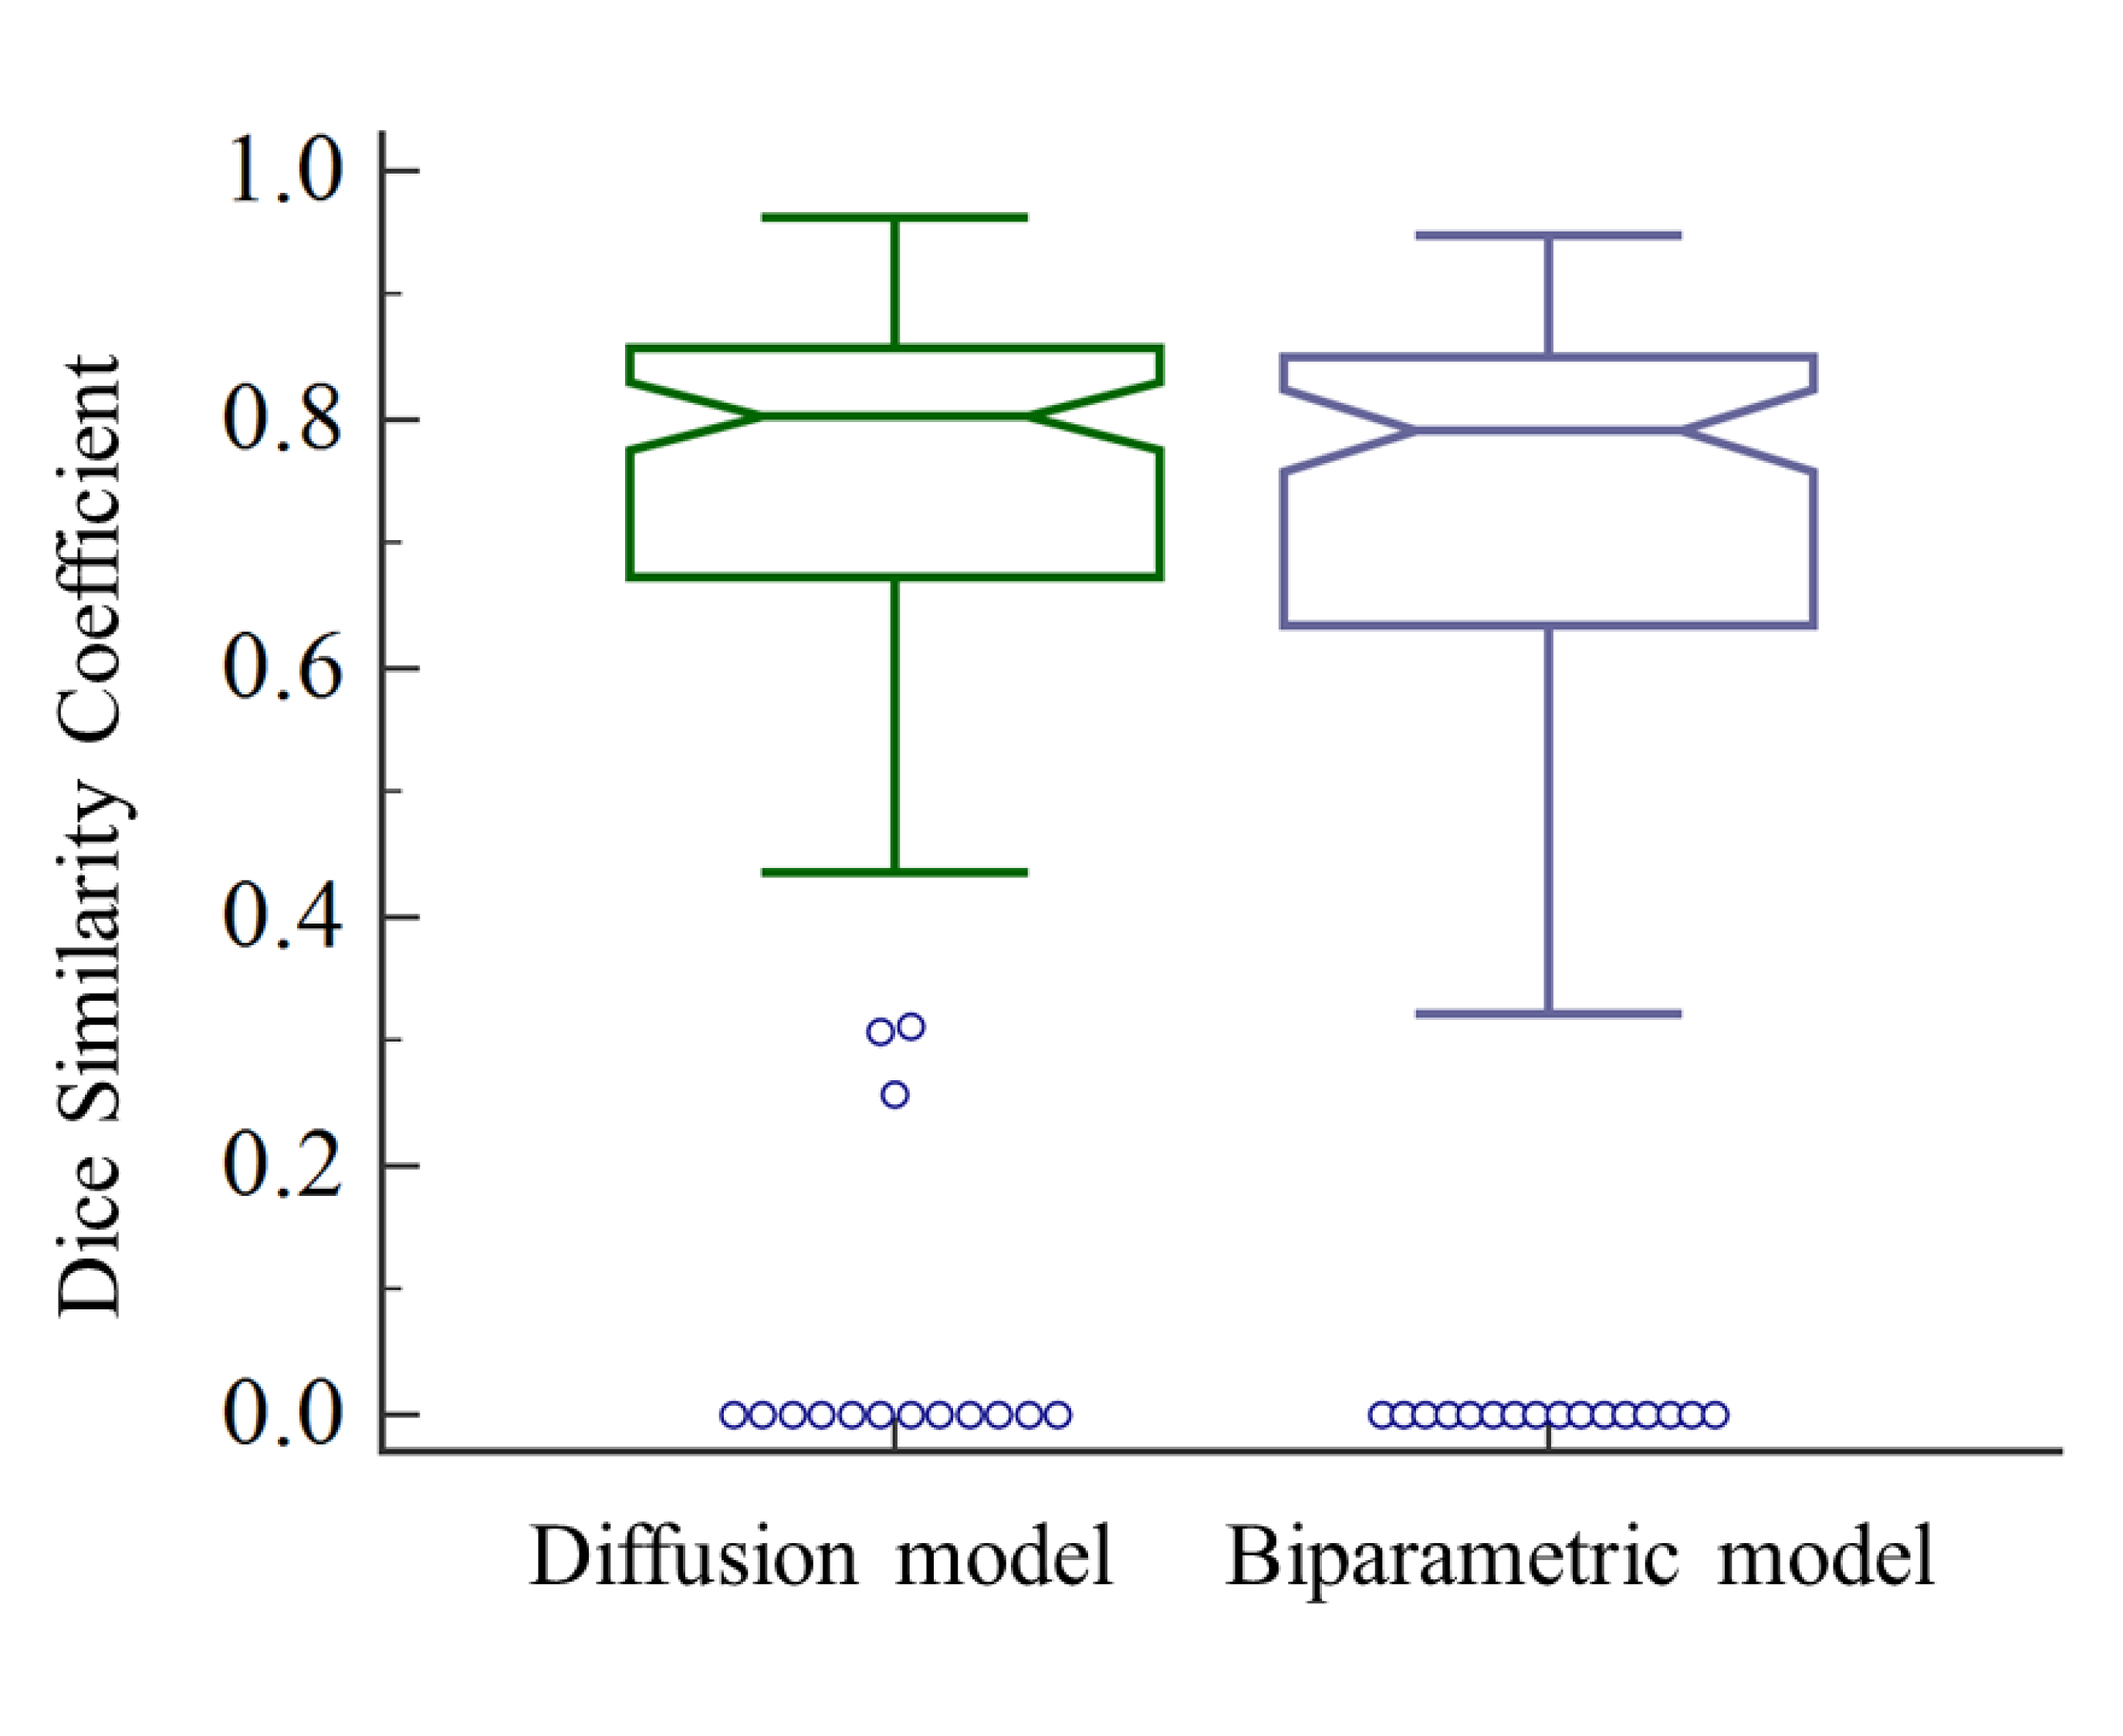
Notched box plots show the Dice similarity coefficient (DSC) of the diffusion model and biparametric model. Lengths of whiskers are limited to a maximum of 1.5 times the interquartile range. Notches indicate a 95% confidence interval around the median.
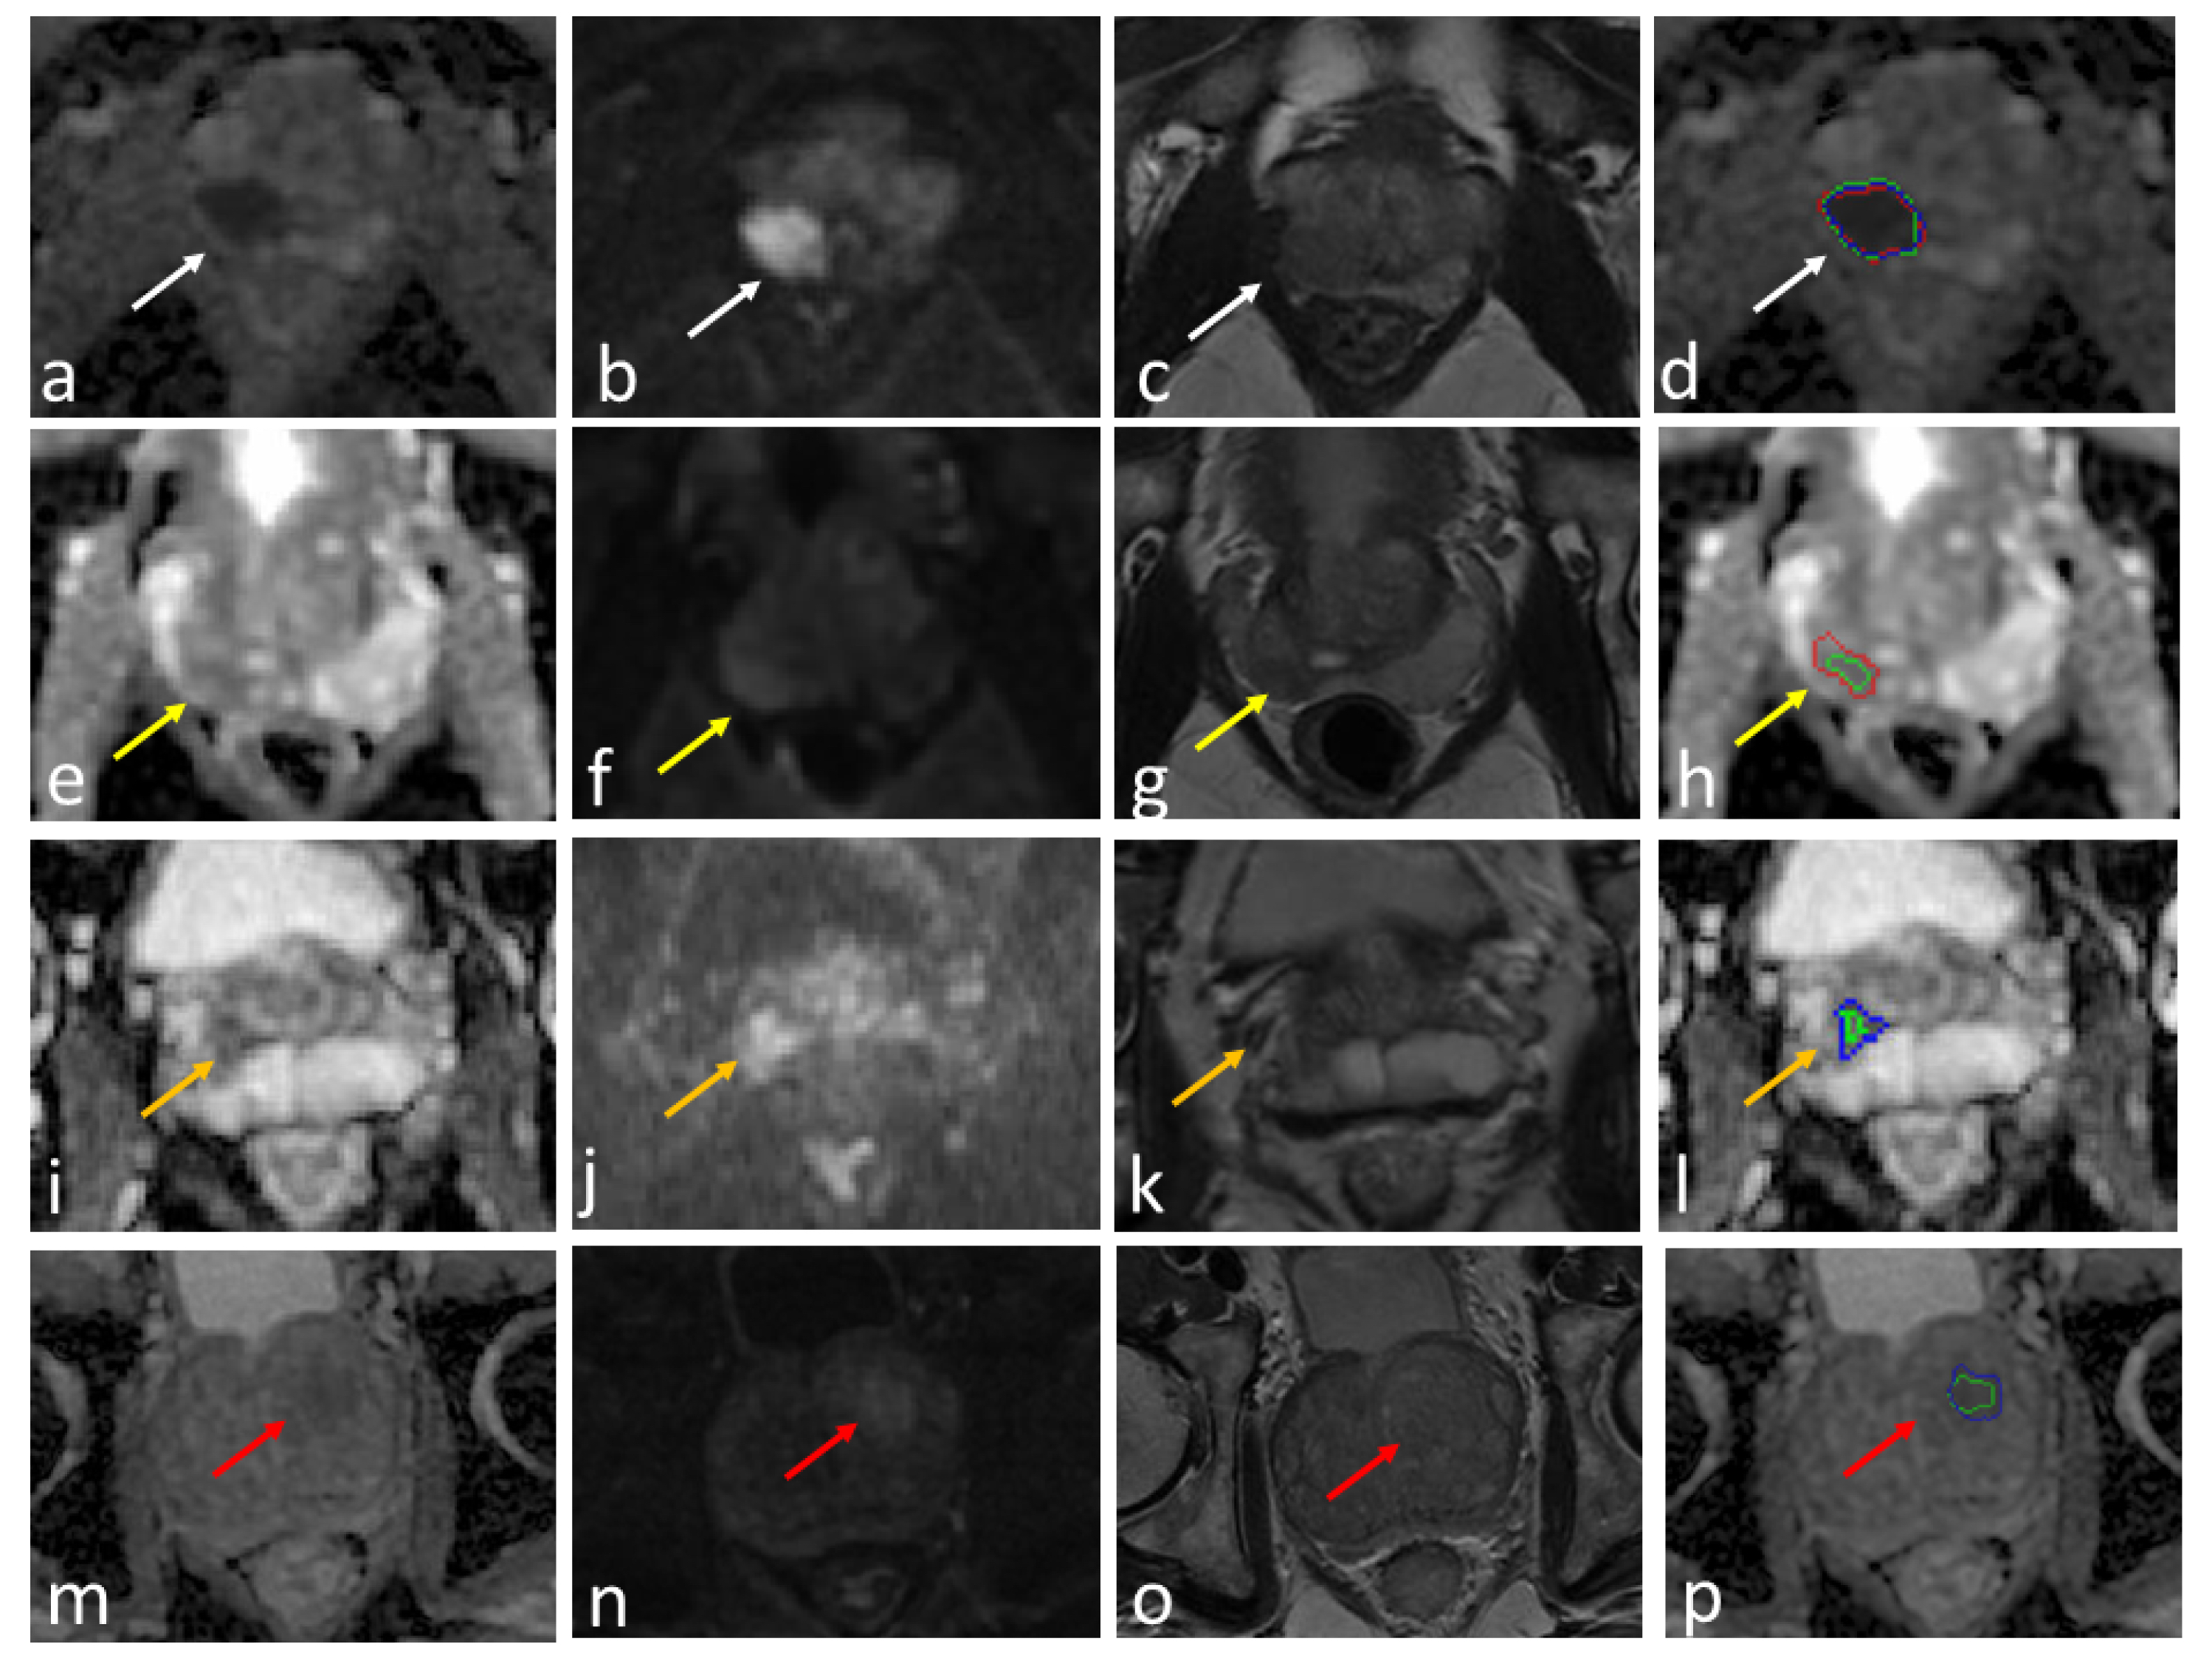
The examples of csPCa segmentation. Green, blue, and red outline represent the results of diffusion model, the biparametric model, and ground truth, respectively.a – d showed an example of true positive case (while arrow). e – h showed the prediction result of the diffusion model was true positive, while the biparametric model missed the lesion (yellow arrow). i – l showed an asymmetrical central (orange arrow). The predicted results were false positive. m – p showed a benign hyperplasia node in the transition zone (red arrow). The predicted results were false positive.
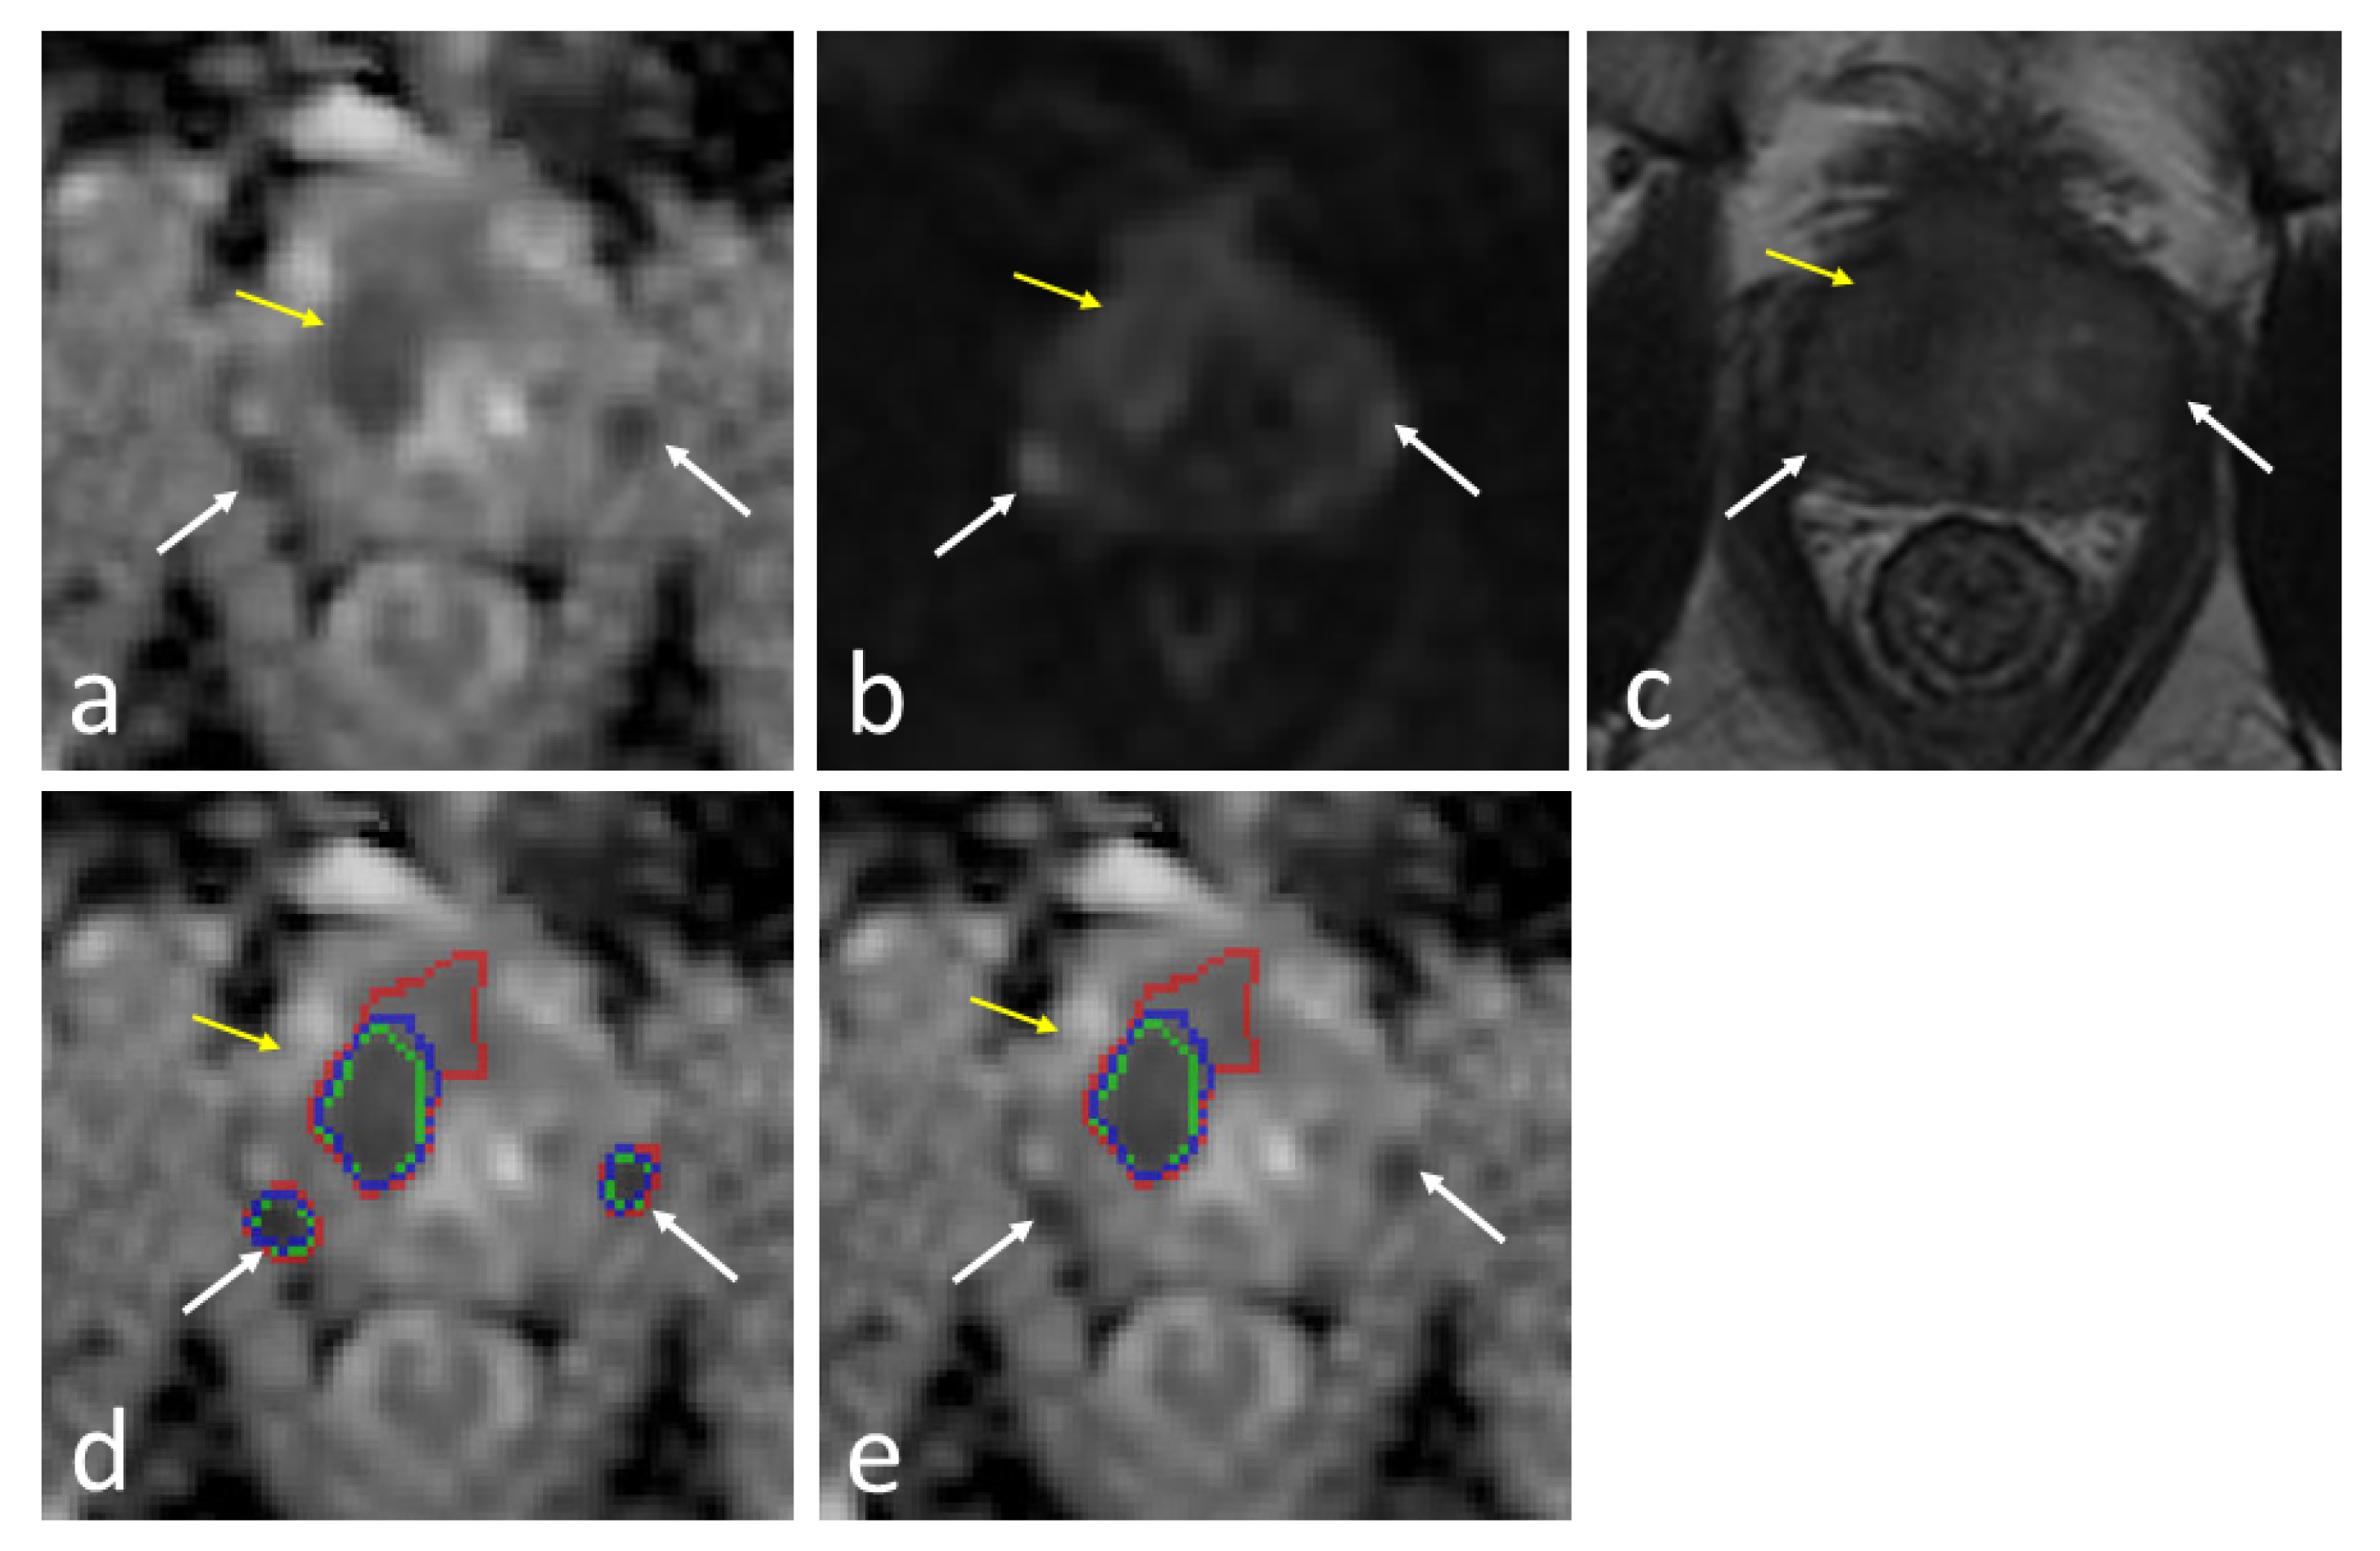
Examples of a cancerous patient with small positive lesions. a - c Two small cancer lesions (white arrow) with volumes of 0.25cc and 0.27cc in the peripheral zone and one larger lesion in the transition zone (yellow arrow). d Original prediction results of models. All the three lesions were annotated by ground truth (red line) and were detected by the diffusion model (green line) and the parametric model (blue line). The post-processing (e) filtered the two small true cancer lesions (white arrow) and the larger lesion was retained (yellow).
DOI: https://doi.org/10.58530/2023/1864