1863
Retrospective T2 quantification from conventional weighted MRI of the prostate based on deep learning1Biomedical Imaging Research Institute, Cedars-Sinai Medical Center, Los Angeles, CA, United States, 2Bioengineering, University of California, Los Angeles, Los Angeles, CA, United States, 3Minimally Invasive Urology, Cedars-Sinai Medical Center, Los Angeles, CA, United States, 4Imaging/Nuclear Medicine, Cedars-Sinai Medical Center, Los Angeles, CA, United States, 5Imaging, Cedars-Sinai Medical Center, Los Angeles, CA, United States
Synopsis
Keywords: Prostate, Quantitative Imaging
Prostate cancer (PCa) is one of the most common types of cancer with a considerable morbidity and mortality. Multiparametric MRI as a noninvasive imaging tool in PCa diagnosis has limitations. Recent studies suggest that quantitative T2 information is helpful in PCa diagnosis and lesion characterization but is not generally available due to the need for additional scans. Here, we developed a DL-based method to estimate T2 maps retrospectively from clinically acquired T1- and T2-weighted images. The developed technique has the potential to improve PCa diagnosis and lesion characterization using quantitative T2 information estimated from conventional clinical scans.
INTRODUCTION
Prostate cancer (PCa) is one of the most common types of cancer with a rate of morbidity and mortality1. Multiparametric MRI (mpMRI) has been used as a noninvasive imaging tool in the diagnosis of PCa. However, limitations of mpMRI exist, including a low sensitivity for low-grade cancer detection2,3; a false negative rate of 10%-20% for high-grade tumor diagnosis4 and considerable interobserver variations.Recently, parametric mapping has been shown to improve PCa diagnosis and characterizationcompared to standard mpMRI5-7. In particular, T2 mapping helps differentiate cancer from normal prostate tissue and determine its aggressiveness8-10. However, T2 mapping requires additional acquisitions and prolonged imaging time, which has not been adopted as part of the routine clinical imaging and PCa diagnosis using PI-RADs11. In this work, we developed a deep learning-based method to retrospectively estimate T2 maps from clinically acquired T1- and T2-weighted images. The proposed network was trained and validated with in vivo prostate MR scans in both PCa patients and healthy volunteers.
METHODS
2.1 Subjects and Study DatasetTwenty-five subjects were scanned on a 3T clinical scanner (Biograph mMR; Siemens Healthineers, Erlangen Germany), including 17 previously confirmed PCa patients and 8 healthy volunteers. For each subject, conventional mpMRI were acquired, including T1WI and T2WI (T1 FLASH: FOV = 360 × 292.5 × 306 mm3, resolution = 1.125 × 1.125 × 6 mm3, TR = 271 ms, TE =2.03 ms, flip angle [FA] = 48.0˚; T2 TSE: FOV = 360 × 292.5 × 306 mm3, resolution = 1.125 × 1.125 × 6 mm3, TR = 4570 ms, TE =108 ms) and DWI (not used in this work). The corresponding T2 maps were acquired using multi echo spin echo sequence (FOV = 300 × 300 × 90 mm3, resolution = 1.172 × 1.172 × 3 mm3).
2.2 Data Preprocessing
Data preprocessing workflows are shown in Figure 1. Using one in the T2 map sequence as the reference, conventional weighted images were deformably registered to the T2 maps using ANTsPy12. A bladder mask and extreme value mask (T2 value larger than 400ms) were generated to avoid irrelevant information in both the network development and result evaluation. An experienced radiologist generated two pairs of tumor and non-tumor ROIs for the T2-weighted image and T2 map ground truth, respectively, informed by DWI, PET and clinical PCa reports using ITK-SNAP.
2.3 Deep Learning Network Training
The deep learning architecture is a 2D U-Net-based network as illustrated in Figure 2. The model is implemented using PyTorch with CUDA-11.6, NVIDIA RTX 2080-TI GPUs. The network was trained to estimate T2 maps directly from T1- and T2-weighted images with a four-fold cross-validation training strategy covering all 17 PCa patients for testing.
2.4 Statistical Analysis
Mean percentage error, peak signal-to-noise ratio and structural similarity index were used to evaluate the performance of the network at the voxel level. Pearson coefficient and Spearman coefficient were used to assess the correlation between the prediction and the T2 map.
Region of interest (ROI) analysis was performed on the tumor and non-tumor regions labeled by the experienced radiologist. The mean T2 values were calculated within the ROIs, and two paired t-tests were performed: one between the estimated T2 value and the reference, the other between tumor and non-tumor region.
RESULTS
3.1 Image AnalysisFigure 3 shows examples of the network estimation and the quantitative metrics of the 17 suspected PCa patients. Despite some blurring, tissue structures and contrast are well preserved with high similarity to the T2 map ground truth.
3.2 ROI analysis
Figure 4 shows zoomed views of the prostate gland in two representative patients, with the peripheral zone tumor region outlined green and non-tumor region outlined yellow. Focusing on the prostate gland area, the different signal intensity of the tumor and non-tumor region is accurately predicted and consistent with the corresponding reference. As shown in Figure 4 (C), the T2 value of the tumor region is significantly lower than the non-tumor region in paired t-test, consistent with the results from literature6,13-15.
DISCUSSION AND CONCLUSION
T2 values in tumor and non-tumor regions estimated using our deep learning-based approach are consistent with those reported previously. Estimated T2 values in the tumor region are also consistent with those of the reference method. Even though there is a significant difference between T2 values estimated using our deep learning method and those of the reference method in the non-tumor region, estimated T2 values in tumor and non-tumor regions are significantly different, providing the potential of T2-based tumor detection using this approach.Future work includes expanding the dataset and improving image registration. Further optimization of the network may improve its robustness to misregistration. Causes for significant differences between estimated T2 values and those of the reference method in the non-tumor region should be further investigated.
In conclusion, we developed a deep learning-based method of retrospective T2 mapping from conventional T1- and T2-weighted prostate images acquired in clinical practice. Upon further validation, this method has the potential to retrospectively derive T2 values from standard clinical MRI for more accurate PCa diagnosis and characterization.
Acknowledgements
This study was partially supported by NIH R01s CA217098 and EB028146.References
1. Sung H, Ferlay J, Siegel RL, et al. Global Cancer Statistics 2020: GLOBOCAN Estimates of Incidence and Mortality Worldwide for 36 Cancers in 185 Countries. CA Cancer J Clin. 2021 May;71(3):209-249. doi: 10.3322/caac.21660. Epub 2021 Feb 4. PMID: 33538338.
2. Bryant RJ, Hobbs CP, Eyre KS, et al. Comparison of Prostate Biopsy with or without Prebiopsy Multiparametric Magnetic Resonance Imaging for Prostate Cancer Detection: An Observational Cohort Study. J Urol. 2019 Mar;201(3):510-519. doi: 10.1016/j.juro.2018.09.049. PMID: 30266332.
3. Chesnut GT, Vertosick EA, Benfante N, et al. Role of Changes in Magnetic Resonance Imaging or Clinical Stage in Evaluation of Disease Progression for Men with Prostate Cancer on Active Surveillance. Eur Urol. 2020 Apr;77(4):501-507. doi: 10.1016/j.eururo.2019.12.009. Epub 2019 Dec 23. PMID: 31874726; PMCID: PMC7096768.
4. Park KJ, Choi SH, Kim MH, Kim JK, Jeong IG. Performance of Prostate Imaging Reporting and Data System Version 2.1 for Diagnosis of Prostate Cancer: A Systematic Review and Meta-Analysis. J Magn Reson Imaging. 2021;54(1):103-112.
5. Panda A, OʼConnor G, Lo WC et al. Targeted Biopsy Validation of Peripheral Zone Prostate Cancer Characterization with Magnetic Resonance Fingerprinting and Diffusion Mapping. Invest Radiol. 2019 Aug;54(8):485-493. doi: 10.1097/RLI.0000000000000569. PMID: 30985480; PMCID: PMC6602844.
6. Panda A, Obmann VC, Lo WC, et al. MR Fingerprinting and ADC Mapping for Characterization of Lesions in the Transition Zone of the Prostate Gland. Radiology. 2019 Sep;292(3):685-694. doi: 10.1148/radiol.2019181705. Epub 2019 Jul 23. PMID: 31335285; PMCID: PMC6716564.
7. Oto, Aytekin & Yang, et al. Diffusion-Weighted and Dynamic Contrast-Enhanced MRI of Prostate Cancer: Correlation of Quantitative MR Parameters with Gleason Score and Tumor Angiogenesis. AJR. American journal of roentgenology. 197. 1382-90. 10.2214/AJR.11.6861
8. Mai J, Abubrig M, Lehmann T, Hilbert T, Weiland E, Grimm MO, Teichgräber U, Franiel T. T2 Mapping in Prostate Cancer. Invest Radiol. 2019 Mar;54(3):146-152. doi: 10.1097/RLI.0000000000000520. PMID: 30394962.
9. Chatterjee A, Devaraj A, Mathew M, Szasz T, Antic T, Karczmar GS, Oto A. Performance of T2 Maps in the Detection of Prostate Cancer. Acad Radiol. 2019 Jan;26(1):15-21. doi: 10.1016/j.acra.2018.04.005. Epub 2018 May 3. PMID: 29731420; PMCID: PMC6215527.
10. A. Hoang Dinh, R. Souchon, C. Melodelima, F. Bratan, F. Mège-Lechevallier, M. Colombel, O. Rouvière, Characterization of prostate cancer using T2 mapping at 3T: A multi-scanner study, Diagnostic and Interventional Imaging, Volume 96, Issue 4, 2015, Pages 365-372, ISSN 2211-5684.
11. Weinreb JC, Barentsz JO, Choyke PL, et al. PI-RADS Prostate Imaging - Reporting and Data System: 2015, Version 2. Eur Urol. 2016 Jan;69(1):16-40. doi: 10.1016/j.eururo.2015.08.052. Epub 2015 Oct 1. PMID: 26427566; PMCID: PMC6467207.
12. Avants BB, Tustison N, Song G. Advanced normalization tools (ANTs). Insight J. 2009;2:1-35.
13. Hoang Dinh A, Souchon R, Melodelima C, Bratan F, Mège-Lechevallier F, Colombel M, Rouvière O. Characterization of prostate cancer using T2 mapping at 3T: a multi-scanner study. Diagn Interv Imaging. 2015 Apr;96(4):365-72. doi: 10.1016/j.diii.2014.11.016. Epub 2014 Dec 23. PMID: 25547670.
14. Klingebiel, M., Schimmöller, L., Weiland, E., Franiel, T., Jannusch, K., Kirchner, J., Hilbert, T., Strecker, R., Arsov, C., Wittsack, H.-J., Albers, P., Antoch, G. and Ullrich, T. (2022), Value of T2 Mapping MRI for Prostate Cancer Detection and Classification. J Magn Reson Imaging, 56: 413-422.https://doi.org/10.1002/jmri.28061
15. Chatterjee A, Devaraj A, Mathew M, Szasz T, Antic T, Karczmar GS, Oto A. Performance of T2 Maps in the Detection of Prostate Cancer. Acad Radiol. 2019 Jan;26(1):15-21. doi: 10.1016/j.acra.2018.04.005. Epub 2018 May 3. PMID: 29731420; PMCID: PMC6215527.
Figures
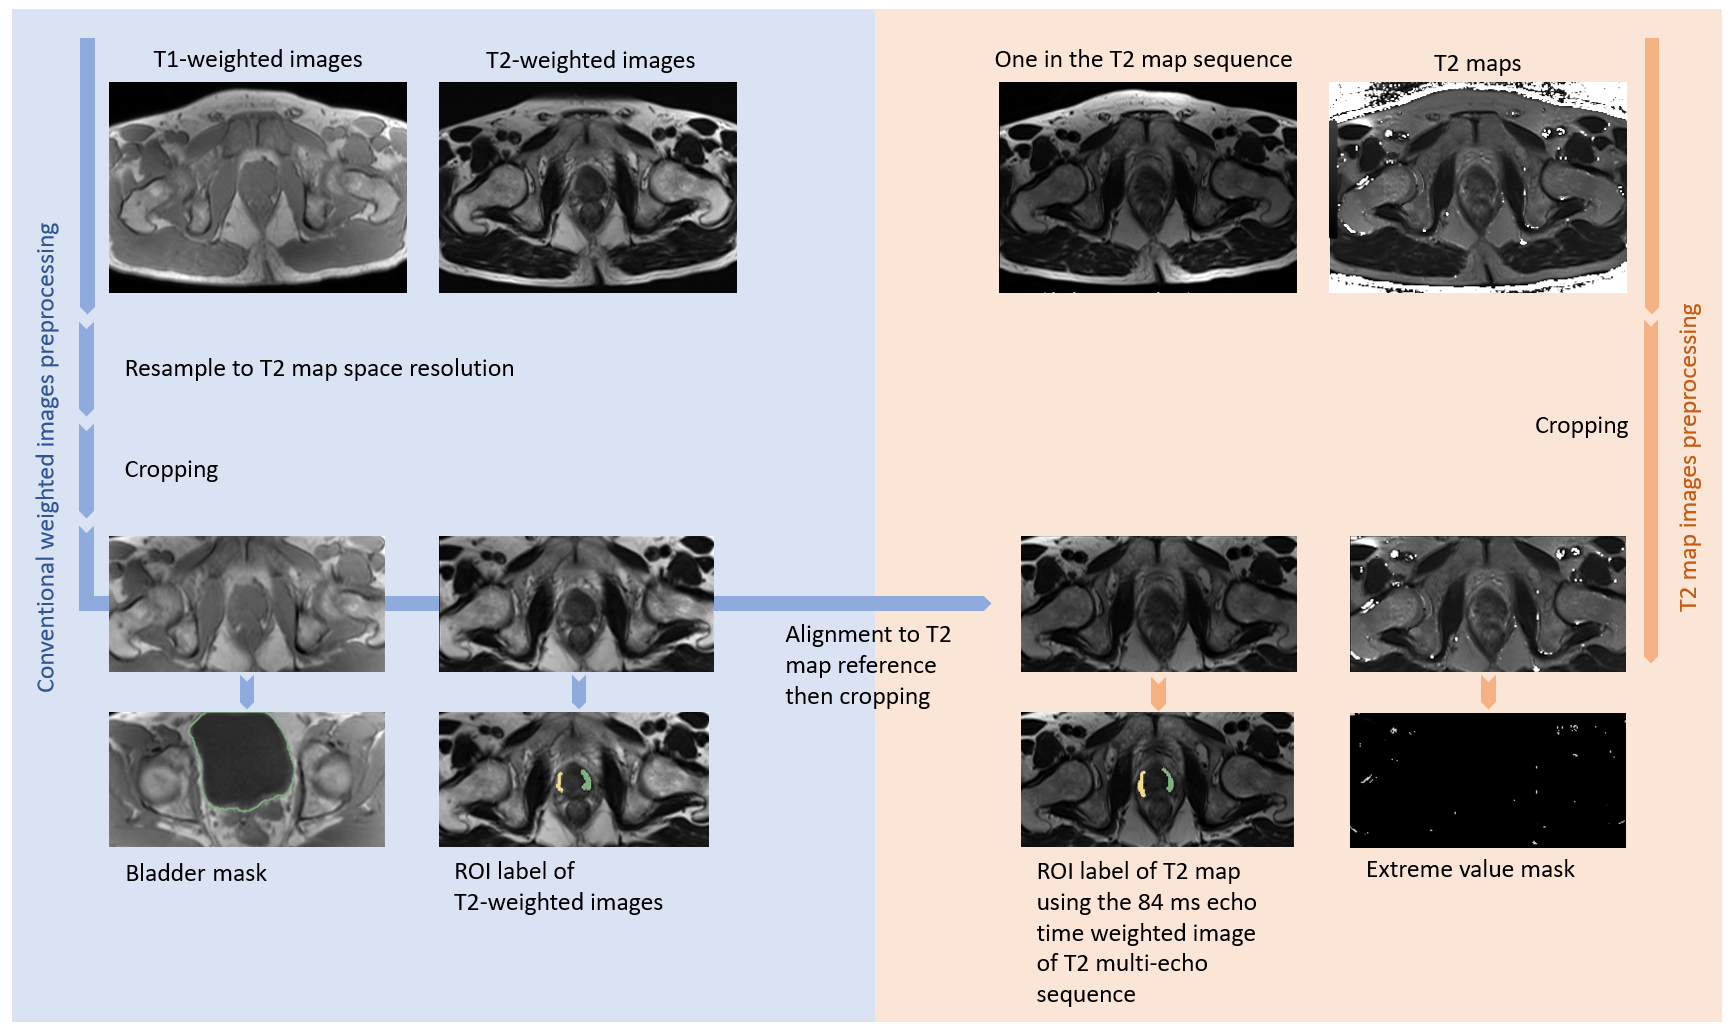
Figure 1. Image preprocessing pipeline, consisting of conventional weighted images preprocessing (on the left) and T2 map preprocessing (on the right).
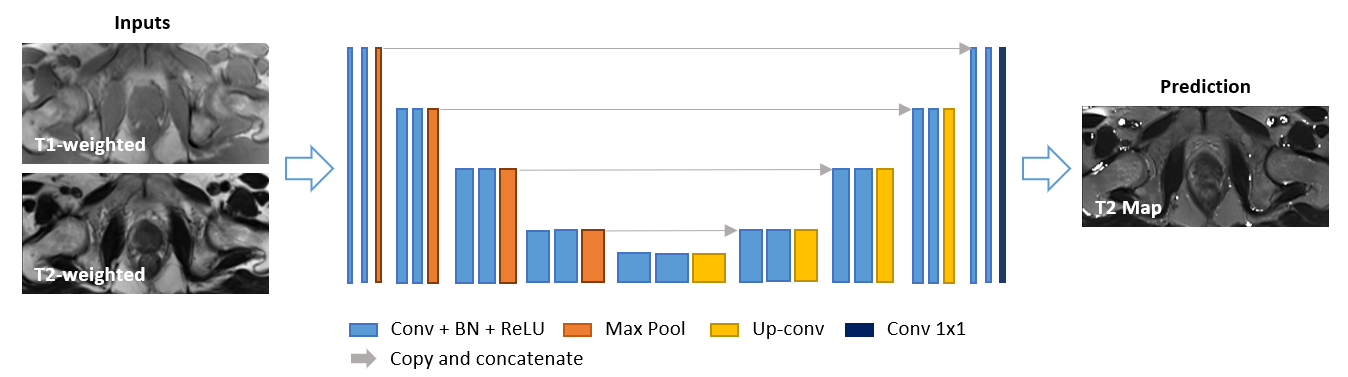
Figure 2. Deep-learning network structure. A 2D U-Net-based architecture consisting of four down-sampling steps and four up-sampling steps was implemented. Each encoder stage is followed by 2×2 max-pooling for downsampling, and each decoder stage is followed by 2×2 up sampling convolutional layers. Every stage incorporated two series of 3×3 2D convolutions, batch normalization and rectified linear units (ReLU). Input images included T1- and T2-weighted images as two channels. The output image is predicted T2 map. An L1 loss function was used.
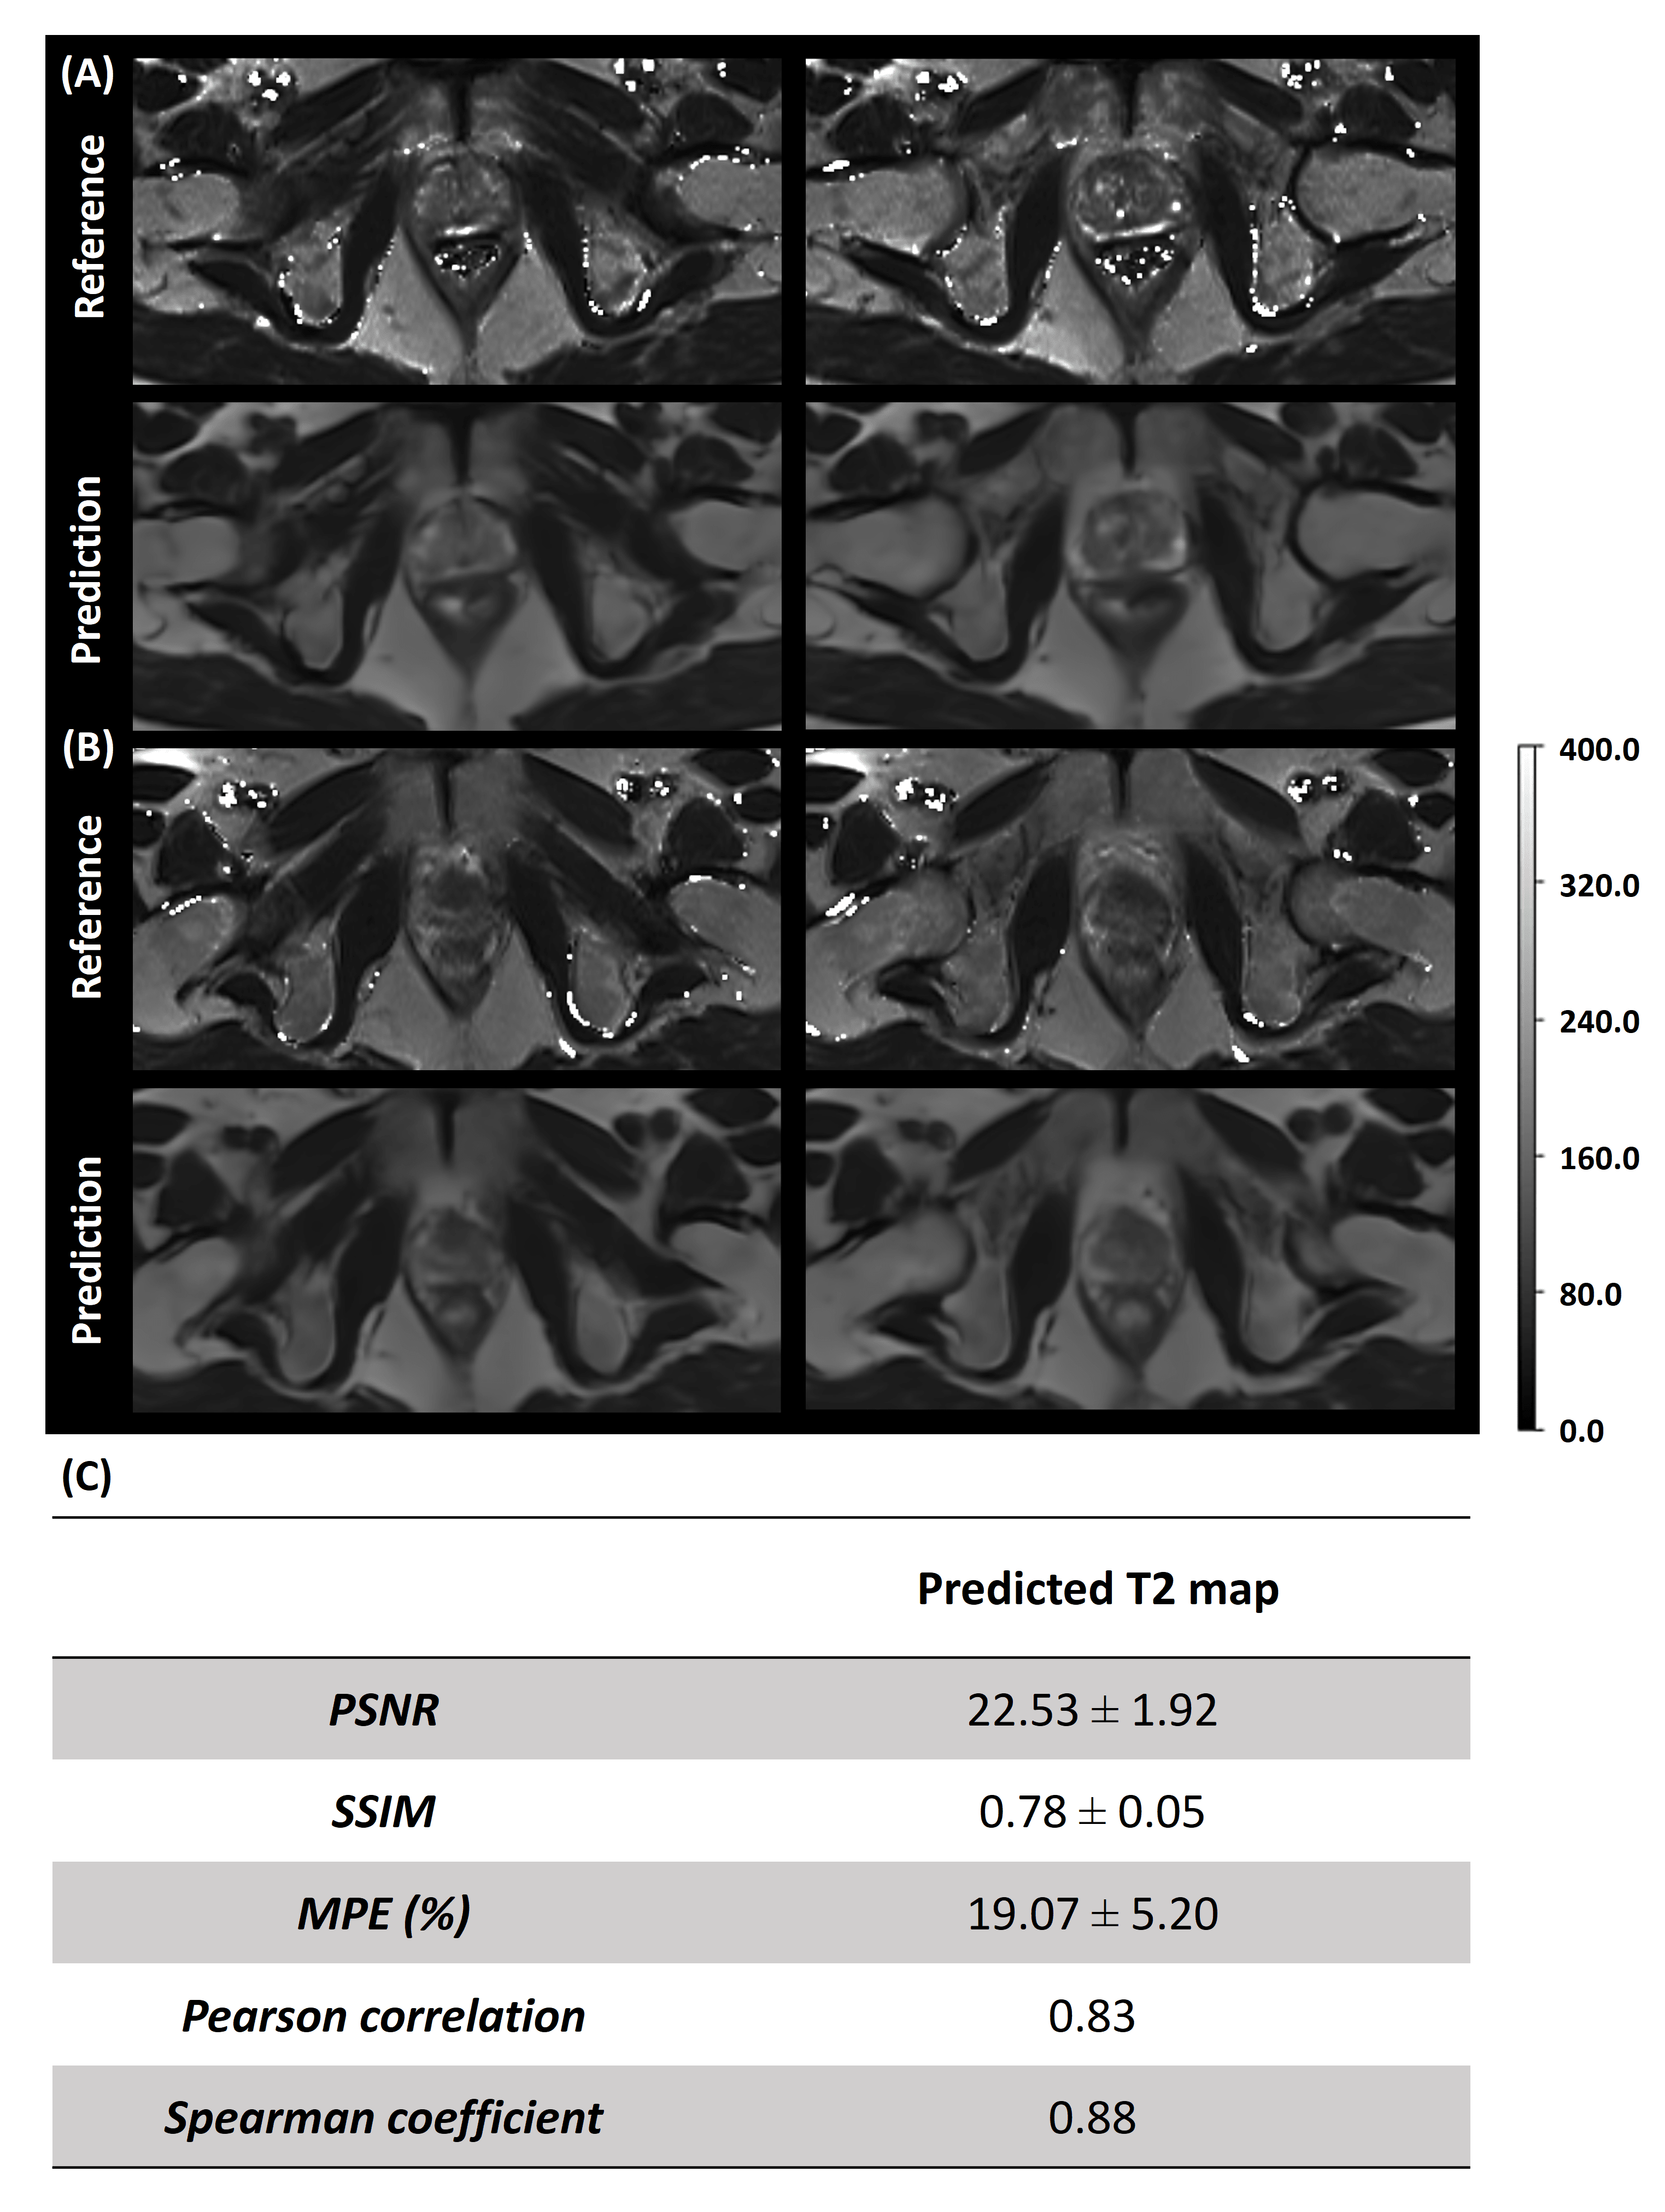
Figure 3. Representative slices of the predicted T2 map and the corresponding ground truth from two PCa patients (A, B). The first and third rows are the T2 reference and the second and fourth rows are the predicted T2 map generated by the deep learning network. The two columns represent two slices which included the prostate gland from two patients A and B. Table (C) shows the quantitative analysis results of the predicted T2 map of the seventeen PCa patients on the whole image level.
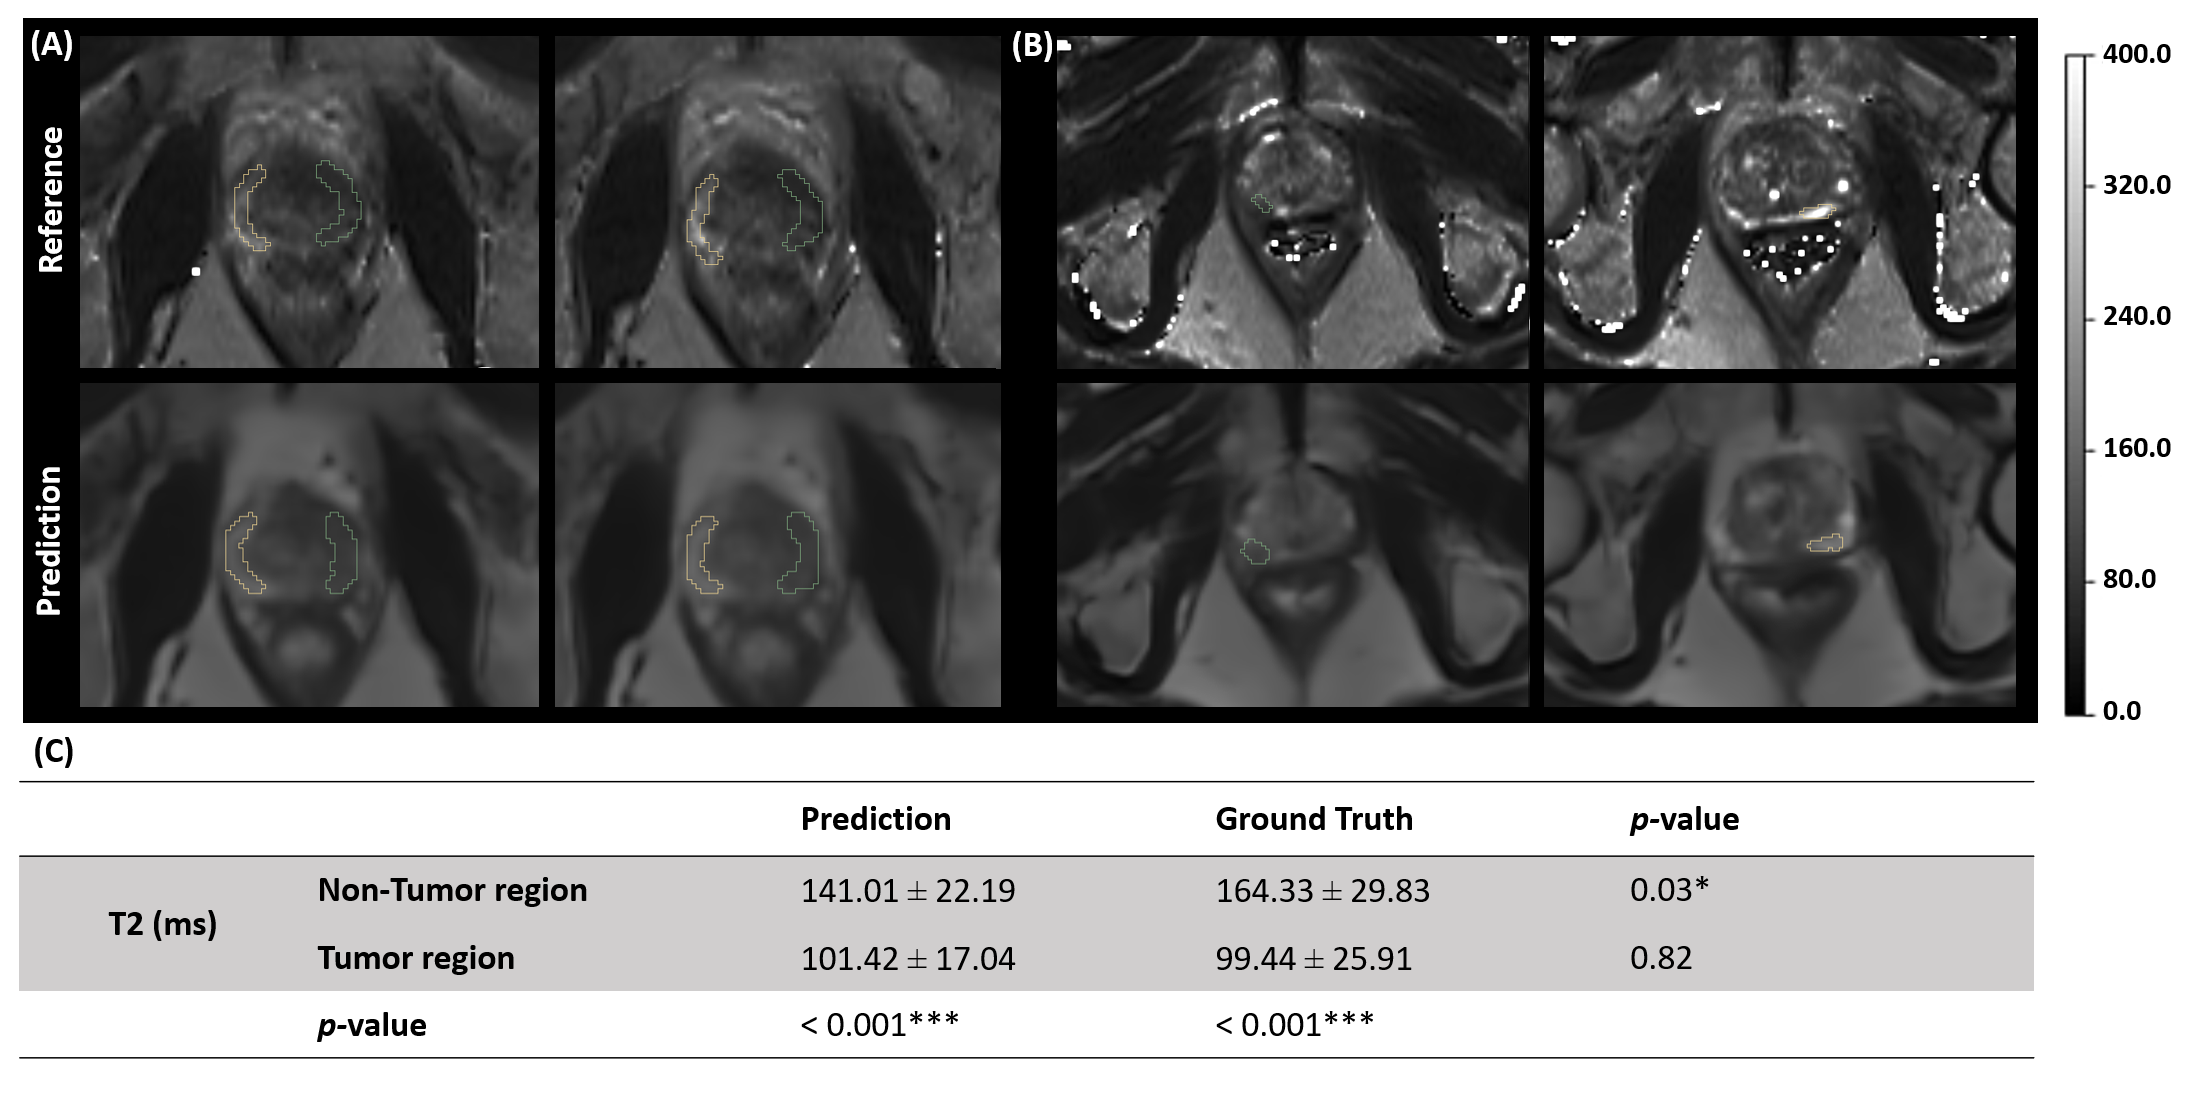
Figure 4. Zoomed view of representative slices of the predicted T2 map and the corresponding ground truth from two PCa patients (A, B) with ROI labeled. Both tumor (green) and non-tumor (yellow) regions were outlined on the peripheral zone of the prostate gland. Table (C) shows the T2 ROI quantification results on tumor and non-tumor regions. Two groups of paired t-test were included in the analysis, one is between prediction and ground truth, and the other is between tumor and non-tumor region with the significance level of *p<0.05; **p<0.01; ***p<0.001.