1861
To evaluate the value of APT combined with T1 mapping in the differential diagnosis of prostate cancer and benign prostatic hyperplasia
Xiwei Li1, Lihua Chen1, Nan Wang1, Liangjie Lin2, Jiazheng Wang2, and Ailian Liu1
1The First Affiliated Hospital of Dalian Medical University, Dalian, China, 2Philips Healthcare,Beijing, Beijing, China
1The First Affiliated Hospital of Dalian Medical University, Dalian, China, 2Philips Healthcare,Beijing, Beijing, China
Synopsis
Keywords: Cancer, Prostate
At present, the prostate specific antigen (PSA) detection is a common method for screening prostate cancer. However, the specificity of PSA is very low, and it is easy to appear false positive. In recent years, multiparameter imaging has great value in the diagnosis of prostate diseases. Amide proton weighted(APTw) imaging and T1 mapping imaging can more accurately reflect the information of tumor tissue cell metabolism and pathological cell microstructure.The purpose of this study was to evaluate the value of APT and T1 measurements in the diagnosis of prostate cancer and benign prostatic hyperplasia.Summary of Main Findings
This study found that APT and T1 values were useful for distinguishing prostate cancer from prostate hyperplasia, and the combination of the two parameters increased the diagnostic efficiency and sensitivity.Introduction
With the development of global aging, the incidence of prostate cancer is increasing year by year. MRI is the first choice for the diagnosis of prostate diseases, but there will still be overlapping signals between cancerous nodules and hyperplastic nodules.With the development of multiparameter MRI, quantitative parameters are of great value in differentiating prostate cancer from benign prostatic hyperplasia. APTw reflects the molecular metabolism of tissues and cells by measuring the exchange rate of protein and amide proton with water molecules.T1 values can reflect tumor cell density, water content, polypeptide, protein and other macromolecular tissue content and micronecrosis components.Methods
This study was approved by the Ethics Committee of our hospital, and patients were exempted from informed consent. Sixty-one patients with confirmed prostate neoplasia who underwent 3.0T MRI (Ingenia CX, Philips, the Netherlands) were retrospectively collected and divided into PCa group (Group A, n=37, age range 58-94, mean age 72.48±8.06 years) and BPH group (group B, n=24, age range 56-81, mean age 68.29±8.07) based on the biopsy pathological results. The imaging sequence includes T1WI, T2WI, DWI, APTw and T1mapping, as shown in Table 1 for details. APT mapping (calculated as asymmetric magnetization transfer ratio based on APTw imaging) and T1 mapping were obtained through post-processing and were fused onto the DWI images to identify the slice with largest lesion coverage for each patient. ROIs (134.6±13.1)mm2 were drawn on these slices independently by two radiologists to cover the lesion avoiding the cystic degeneration and necrotic areas. The APT and T1 values within each ROI were recorded as mean±SD(Figure 1). Bland-Altman images were used to evaluate the agreement of the measurement of each parameter value between the two observers. Binary Logistic regression was used to predict a combined model that differentiated between the two groups of disease. Independent samples t-test or Mann-Whitney U test was used to evaluate the difference between PCa and BPH for each parameter alone or in combination. The ROC curve was used to evaluate the efficacy of each parameter alone or in combination in the differentiation between the two groups. The De-Long test was used to compare the differences between the ROC curves.Results
The measurement agreement between the two observers was good (Figure 2). The APT value, T1 value and APT-T1 combined model had significant differences in differentiating the two groups of diseases (P<0.05) ( Table 2). The AUC values for APT, T1 and APT-T1 were 0.801,0.605 and 0.807 for the two groups respectively.(Table 3 and Figure 3). The results of De-Long test showed that the AUC values of T1 value and APT-T1 model were statistically significant (P=0.0475).The rest of the curves were not statistically different between the two comparisons.Discussion
Amide proton transfer (APT)-weighted imaging is a technique that reflects pathophysiological status of the disease by detecting the tissue free-protein concentration and the pH microenvironment. In this study, the APT values of prostate cancer was higher than that of prostate hyperplasia. Due to the high malignant degree of prostate cancer, the content of proteins and peptides in the tumor increases, and the oxygen consumption increases, which leads to the increase of APT values.In addition, because of the increased water content of malignant tumors, the T1 value of dimensional prostate cancer is lower than that of prostatic hyperplasia. The efficiency of APT combined with T1 mapping model was improved, which was significantly higher than that of T1 mapping alone. This study suggests a novel non-invasive metric by combining APT and T1 values, which demonstrated improved sensitivity and specificity for the differential diagnosis of prostate neoplasia.Conclusion
Both APT and T1 values are significantly different between prostate cancer and benign prostate hyperplasia. Combining the two measurements provides a potential diagnosis tool to distinguish the malignant prostate disease, considering the AUC.Acknowledgements
The Philips team (Beijing, China) is gratuitous for guidance on this studyReferences
[1]Zheng Y, Wang X. Amide proton transfer (APT) imaging-based study on the correlation between brain pH and voltage-gated proton channels in piglets after hypoxic-ischemic brain injury. Quant Imaging Med Surg. 2021;11(10):4408-4417. doi:10.21037/qims-21-250
[2]Taylor AJ, Salerno M, Dharmakumar R, Jerosch-Herold M. T1 Mapping: Basic Techniques and Clinical Applications. JACC Cardiovasc Imaging. 2016;9(1):67-81. doi:10.1016/j.jcmg.2015.11.005
[3]Takayama Y, Nishie A, Sugimoto M, et al. Amide proton transfer (APT) magnetic resonance imaging of prostate cancer: comparison with Gleason scores. MAGMA. 2016;29(4):671-679. doi:10.1007/s10334-016-0537-4
Figures
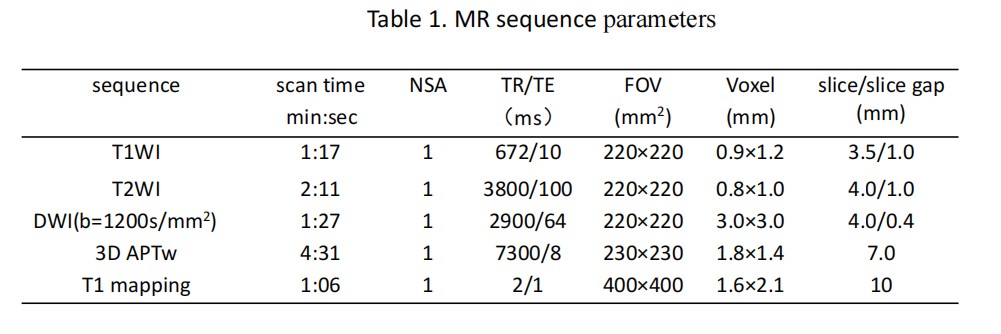
Table 1. MR sequence parameters
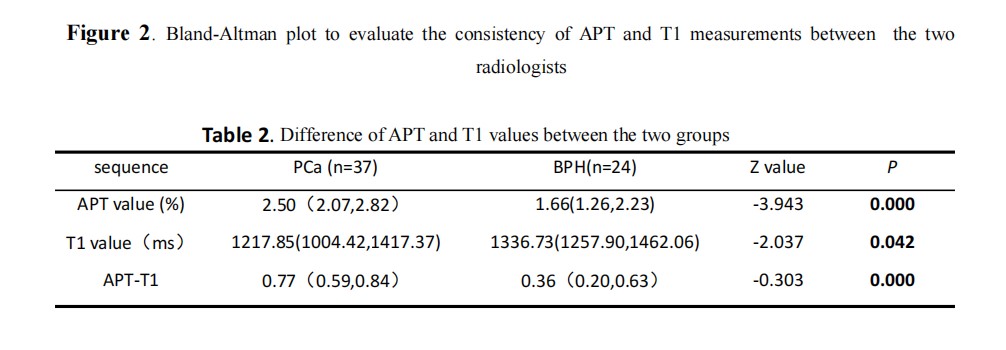
Table 2. Difference of APT and T1 values between the two groups
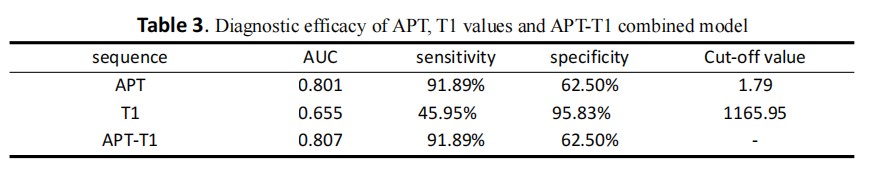
Table 3. Diagnostic efficacy of APT, T1 values and APT-T1 combined model
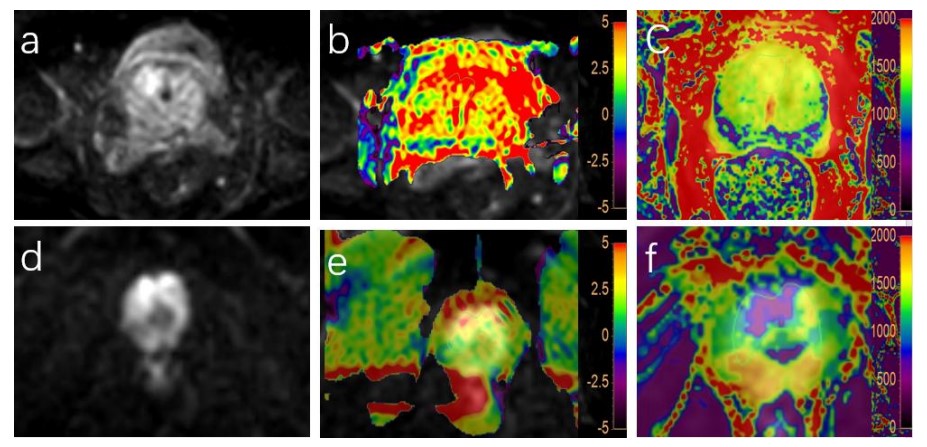
Figure 1. (a-e) a 56-year-old patient with prostatic hyperplasia. DWI (a), DWI and APT fusion (b) and DWI and T1 mapping fusion. There was nodule in the right peripheral zone of prostate, and the APT and T1 values were 2.5% and 932.4ms, respectively. (d-e) A 71-year-old man with prostate cancer. DWI (a), fusion images of DWI and APT (b), and fusion images of DWI and T1 mapping. The APT and T1 values were 3.3% and 577.8ms, respectively.
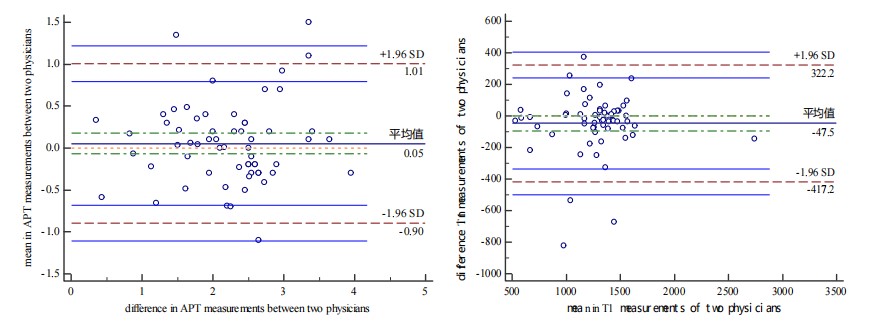
Figure 2. Bland-Altman plot to evaluate the consistency of APT and T1 measurements between the two radiologists
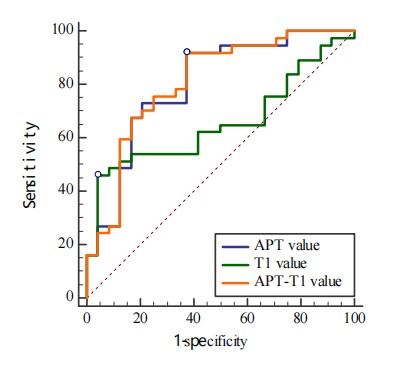
Figure 3. ROC curve of APT value, T1 value and APT-T1 model in differentiating prostate cancer and benign prostatic hyperplasia
DOI: https://doi.org/10.58530/2023/1861