1857
Impact of Iron Particle Sizes on R2* Estimation in Phantoms Mimicking Hepatic Iron Overload and Steatosis Using MRI1Biomedical Engineering, University of Memphis, Memphis, TN, United States, 2Diagnostic Imaging, St. Jude Children's Research Hospital, Memphis, TN, United States, 3Radiology, Cincinnati Children's Hospital Medical Center, Cincinnati, OH, United States
Synopsis
Keywords: Liver, Phantoms
Size and concentration of iron will affect the dephasing of an MRI signal. However, iron particle size is often unaccounted for in phantom studies investigating iron overload. In this study, phantoms utilizing iron nanoparticles of different diameters were used to mimic in vivo iron deposits, and R2* quantification was analyzed using different signal models. Our results show that R2* was higher and more unstable in phantoms with iron particles of 500nm diameter in comparison to those with 250nm and 130nm particles potentially due to clustering. High iron concentrations and large iron particle sizes were also shown to confound fat quantification.Introduction
Under conditions of hereditary hemochromatosis or transfusional hemosiderosis, excess iron can build up in the liver leading to iron overload1. Liver biopsy is the current gold standard for evaluating hepatic iron overload, but it has limitations resulting from the invasiveness of the procedure and high sampling variability arising from the heterogeneity of iron deposition1. Alternatively, R2*-MRI-based techniques are emerging as robust and clinically accepted methods for non-invasively assessing hepatic iron overload2. In the human body, iron is normally stored in ferritin (50-70 nm)3 or, under iron overload conditions, as hemosiderin (0.5-2 µm)4. Additionally, iron in the presence of fat (steatosis) has been shown to preferentially effect water protons depending on the size and distribution of all nearby particles5. However, current imaging phantoms that emulate hepatic iron overload often do not consider the size of in vivo iron storage proteins in the chosen iron material as well as the interactions of iron with surrounding particles. Thus, the primary goal of this study is to analyze the impact of iron particle size on the quantification of R2* and fat fraction (FF) in iron-agar and iron-agar-fat phantoms for increasing iron concentrations.Materials and Methods
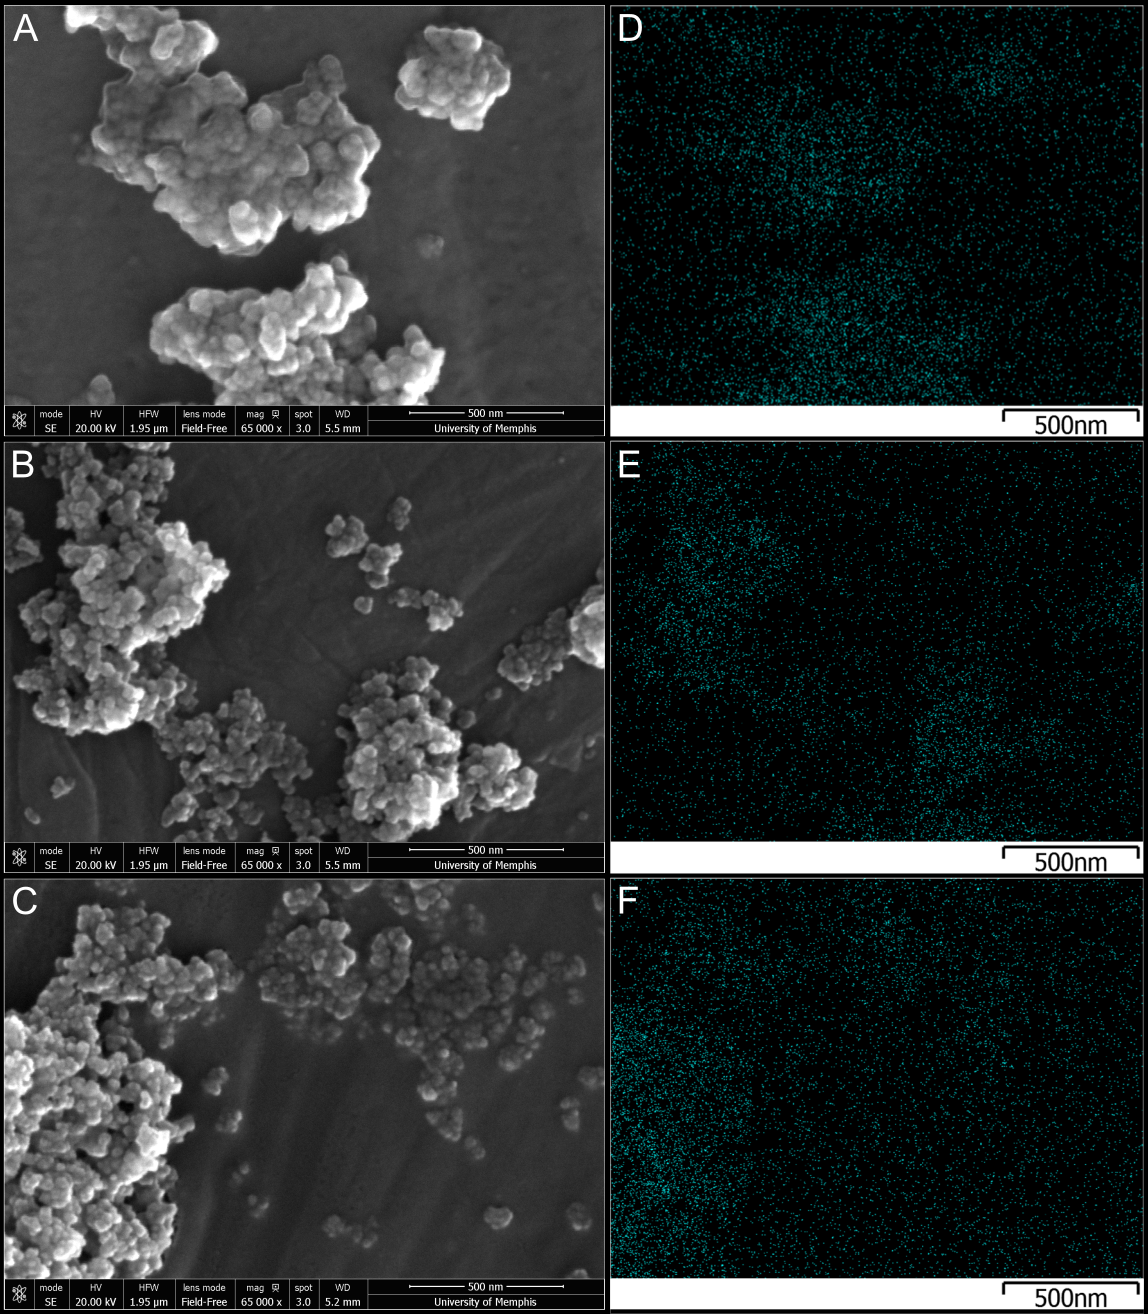
Two sets of homogeneous iron emulsion phantoms were produced at solid (iron dextran) contents of 0%, 0.075%, 0.16%, 0.24%, and 0.32% with the first set of phantoms containing only iron (iron-only) while the second set also containing fat with FF of 20% (iron-fat). Each set of phantoms contained iron nanoparticles (Nanomag-D Plain, Micromod, Rostock, Germany) of diameters 130nm, 250nm, and 500nm and were held in suspension using 2% agar. The iron-fat phantom set included peanut oil emulsified with 43mM SDS. All phantoms were homogenized using a handheld homogenizer (D1000, Benchmark Scientific, Sayreville, NJ, USA) with a saw tooth generator probe at ~15000 rpm. A total of 30 phantoms were created: 3 different iron particle diameters x 5 iron concentrations x 2 (iron-only, iron-fat) sets.Scanning electron microscopy (SEM) was used to quantify the size and distribution of the different iron nanoparticles used in this study. Each sample was sputter coated with a gold/palladium (80:20) coat using an EMS550x Sputter Coater (Quorum, Laughton, East Sussex, England) and mounted on 25mm diameter aluminum specimen stubs. SEM analysis was performed with a Nova NanoSEM 650 (FEI Company, Hillsboro, Oregon, USA) at a voltage of 20.00 kV, spot size of 3.0, working distance of 5.5-5.2 mm, and a field-free lens mode.
MRI scans were performed on a 1.5T scanner (MAGNETOM Avantofit, Siemens) using a 2D GRE sequence with a monopolar gradient and following imaging parameters: TE1 = 1.2 ms, echo spacing= 1.44ms, TR=200ms, echo train length=20, flip=25°, 104x128 matrix, slice thickness = 5mm. R2* was estimated using a mono-exponential6 model and multi-spectral fat-water models: NLSQ (Non-linear Least Squares)7 model from ISMRM Fat-Water Toolbox, and an ARMA (Autoregressive Moving Average)8 model.
MATLAB (R2020b) was used for drawing region-of-interests (ROI) and quantifying the mean and standard deviation of R2* and FF values.
Results and Discussion
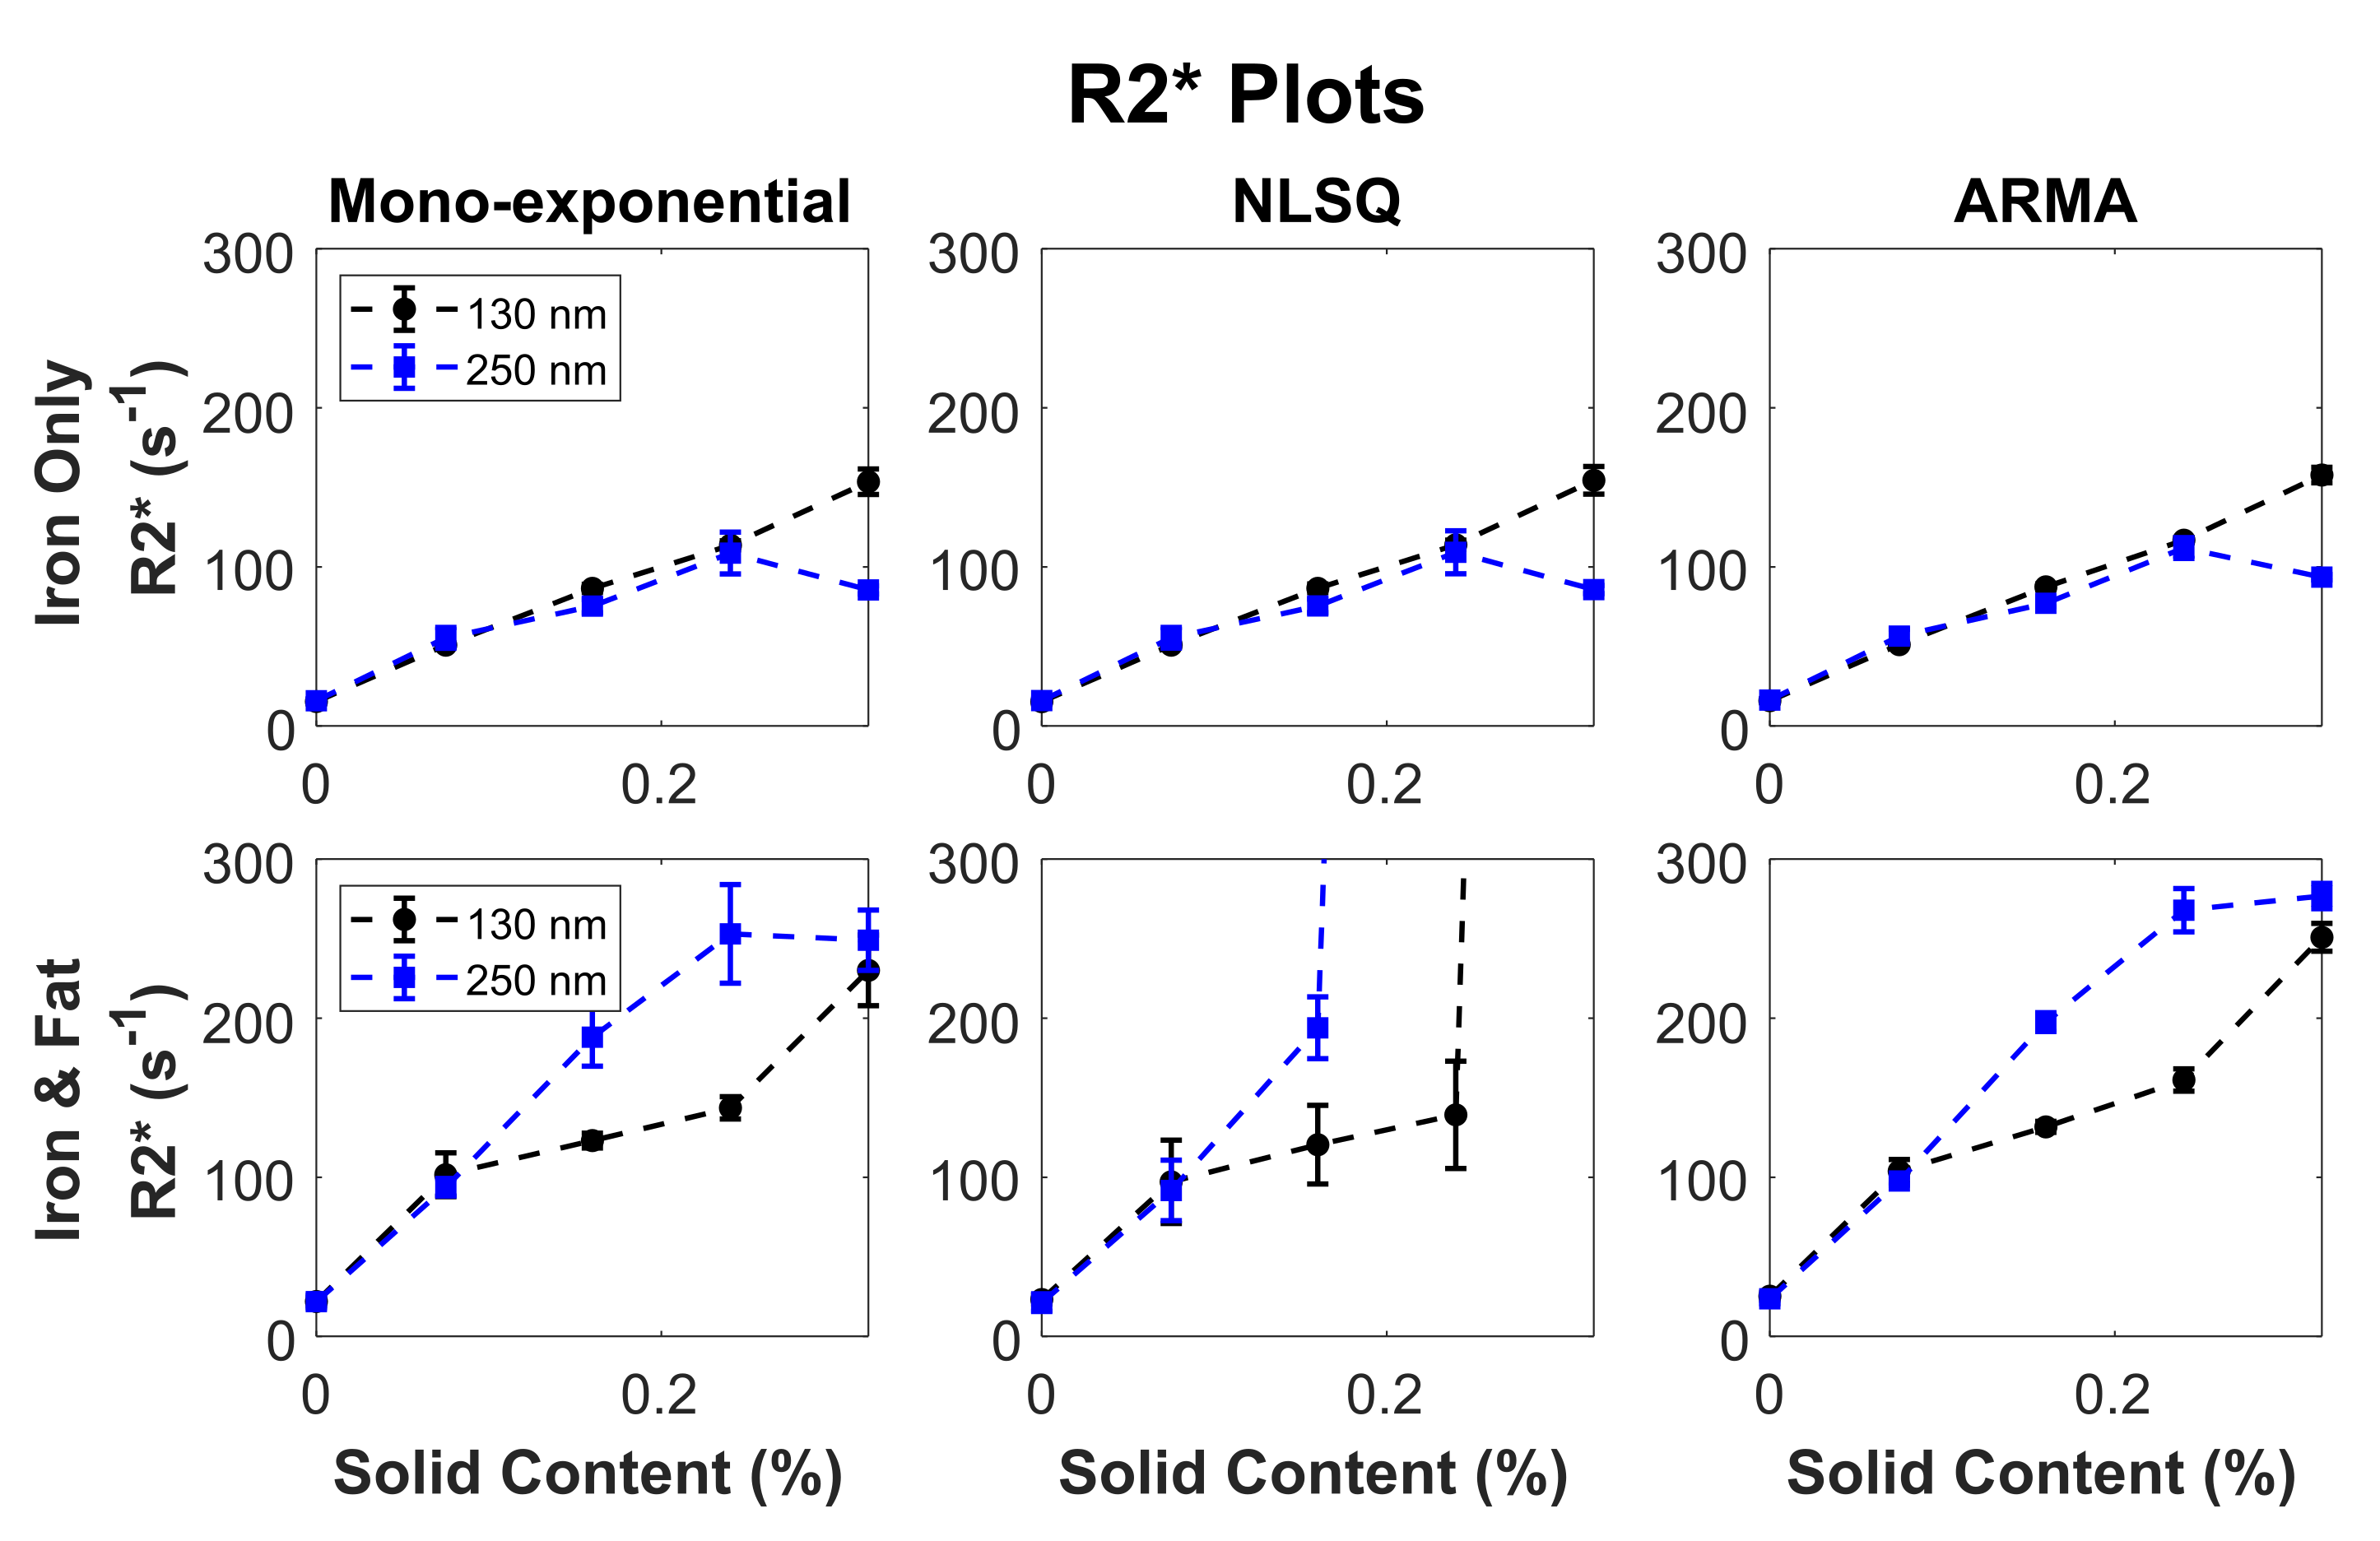
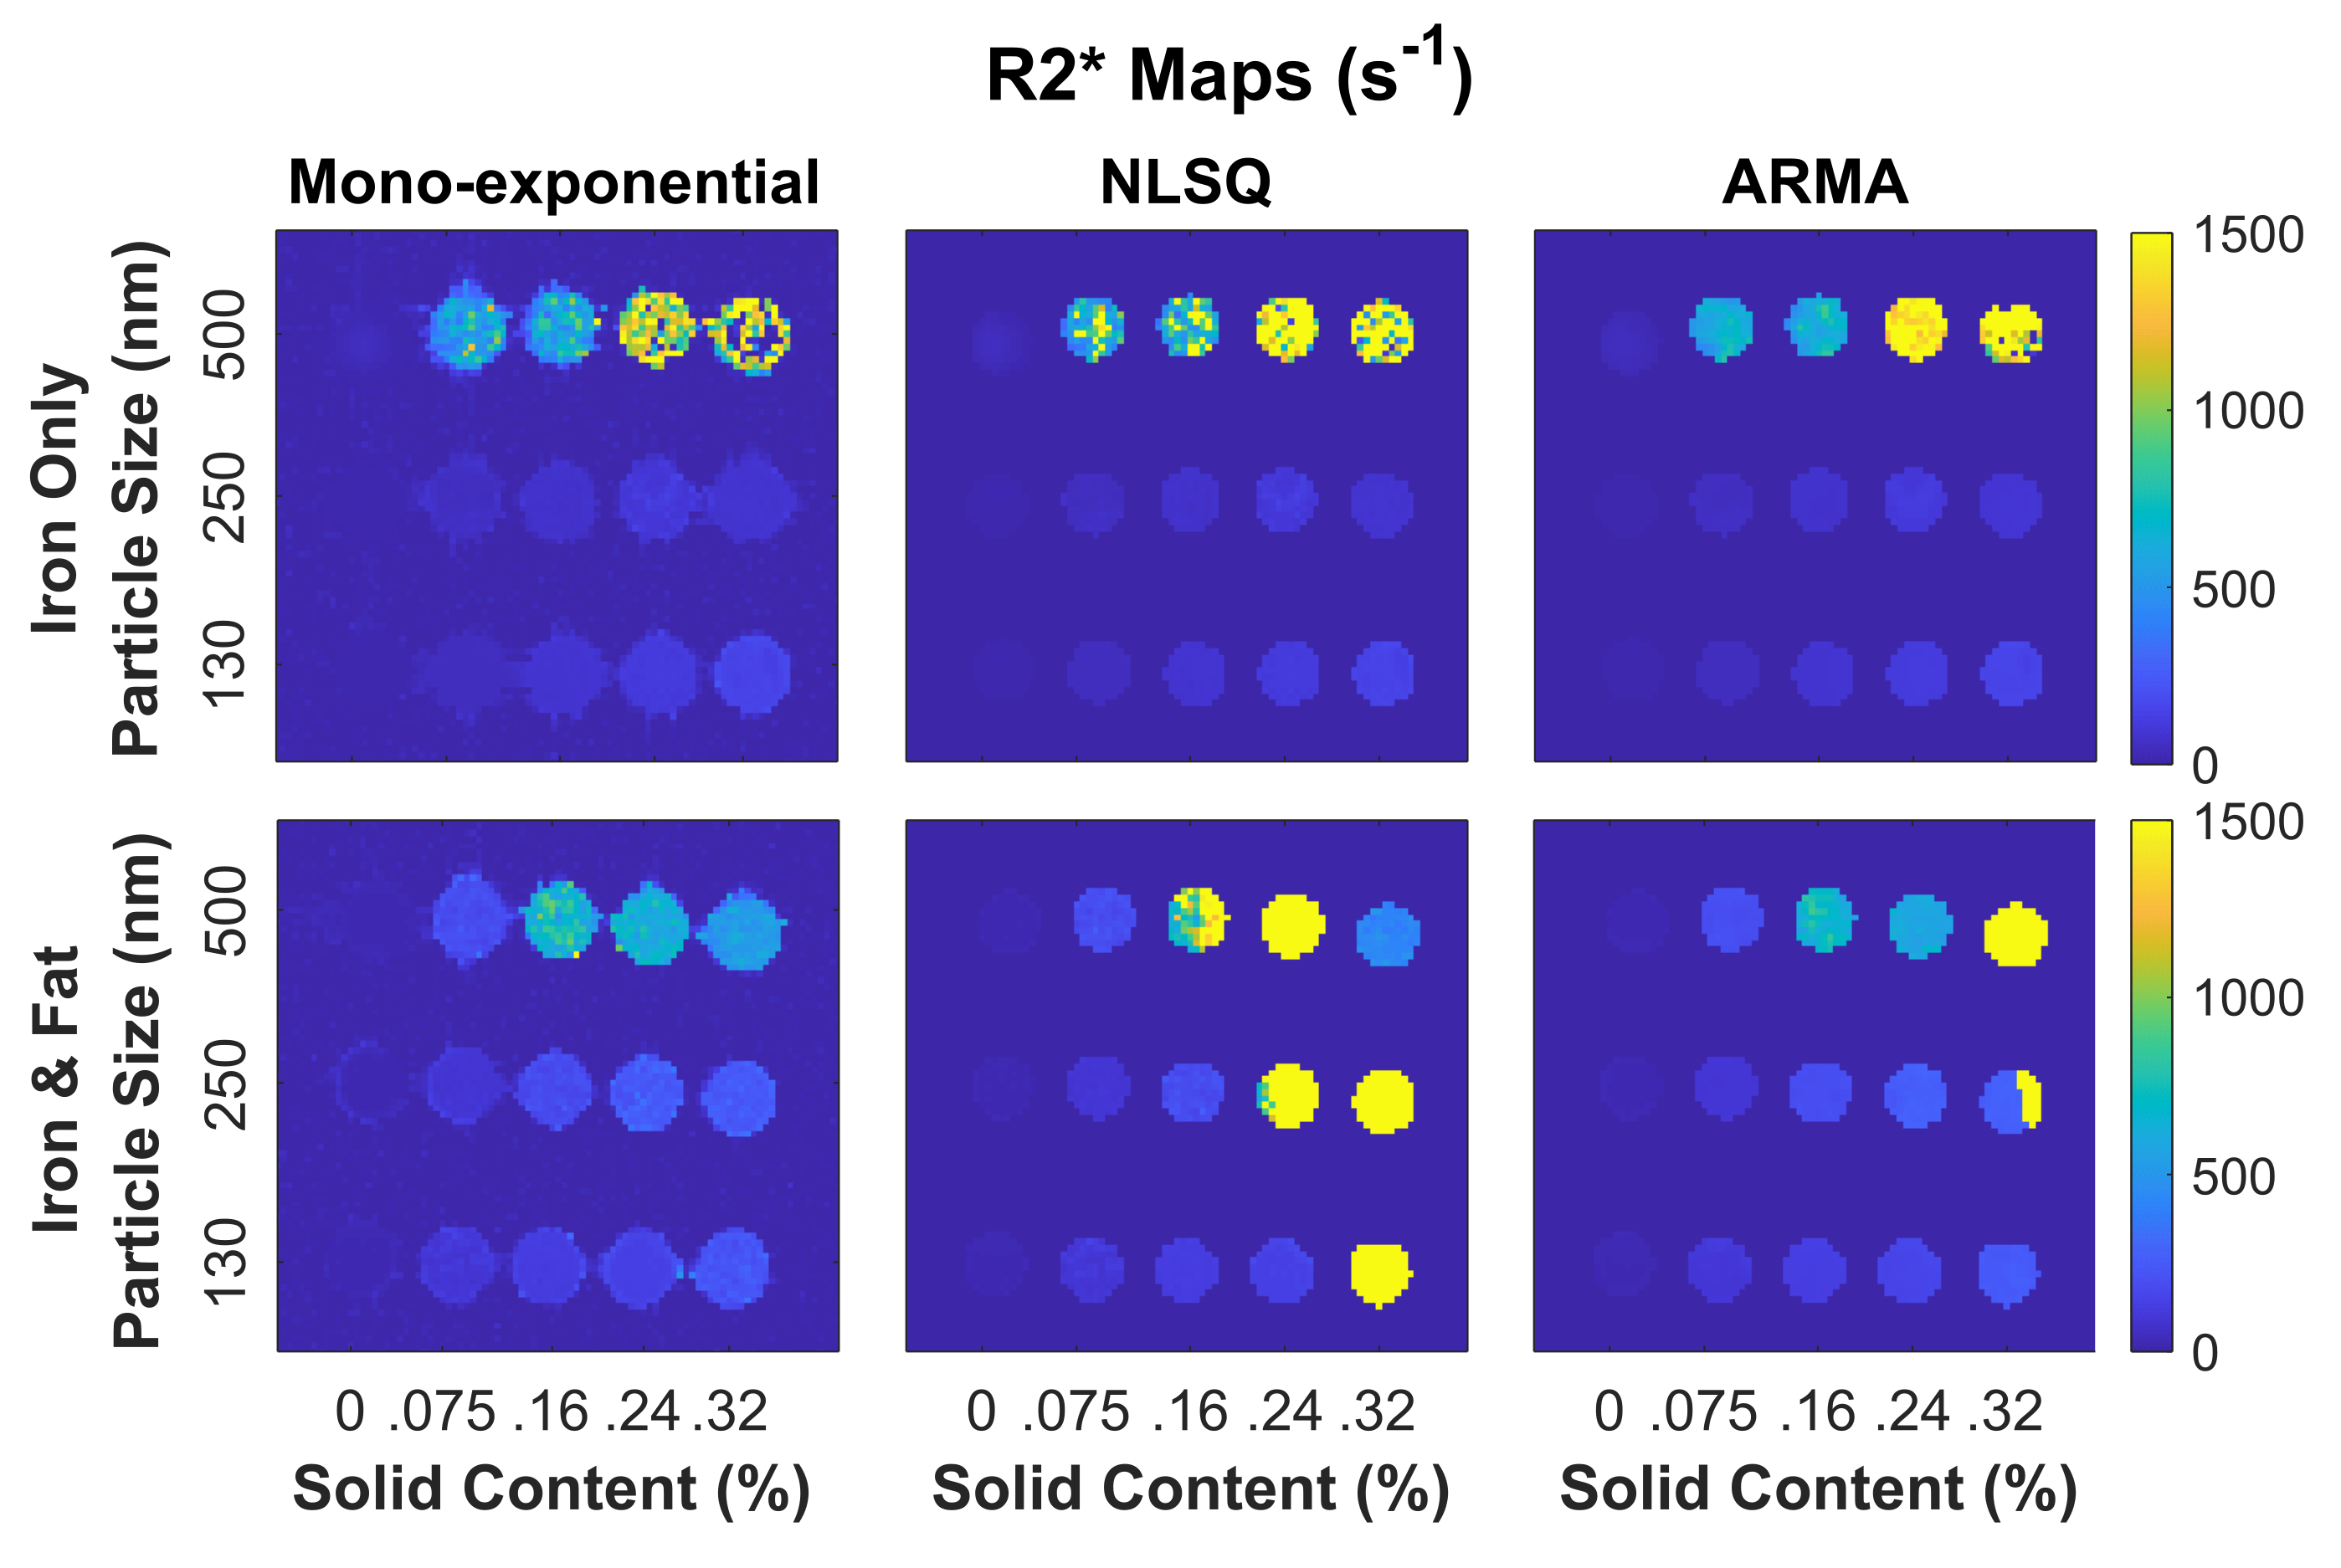
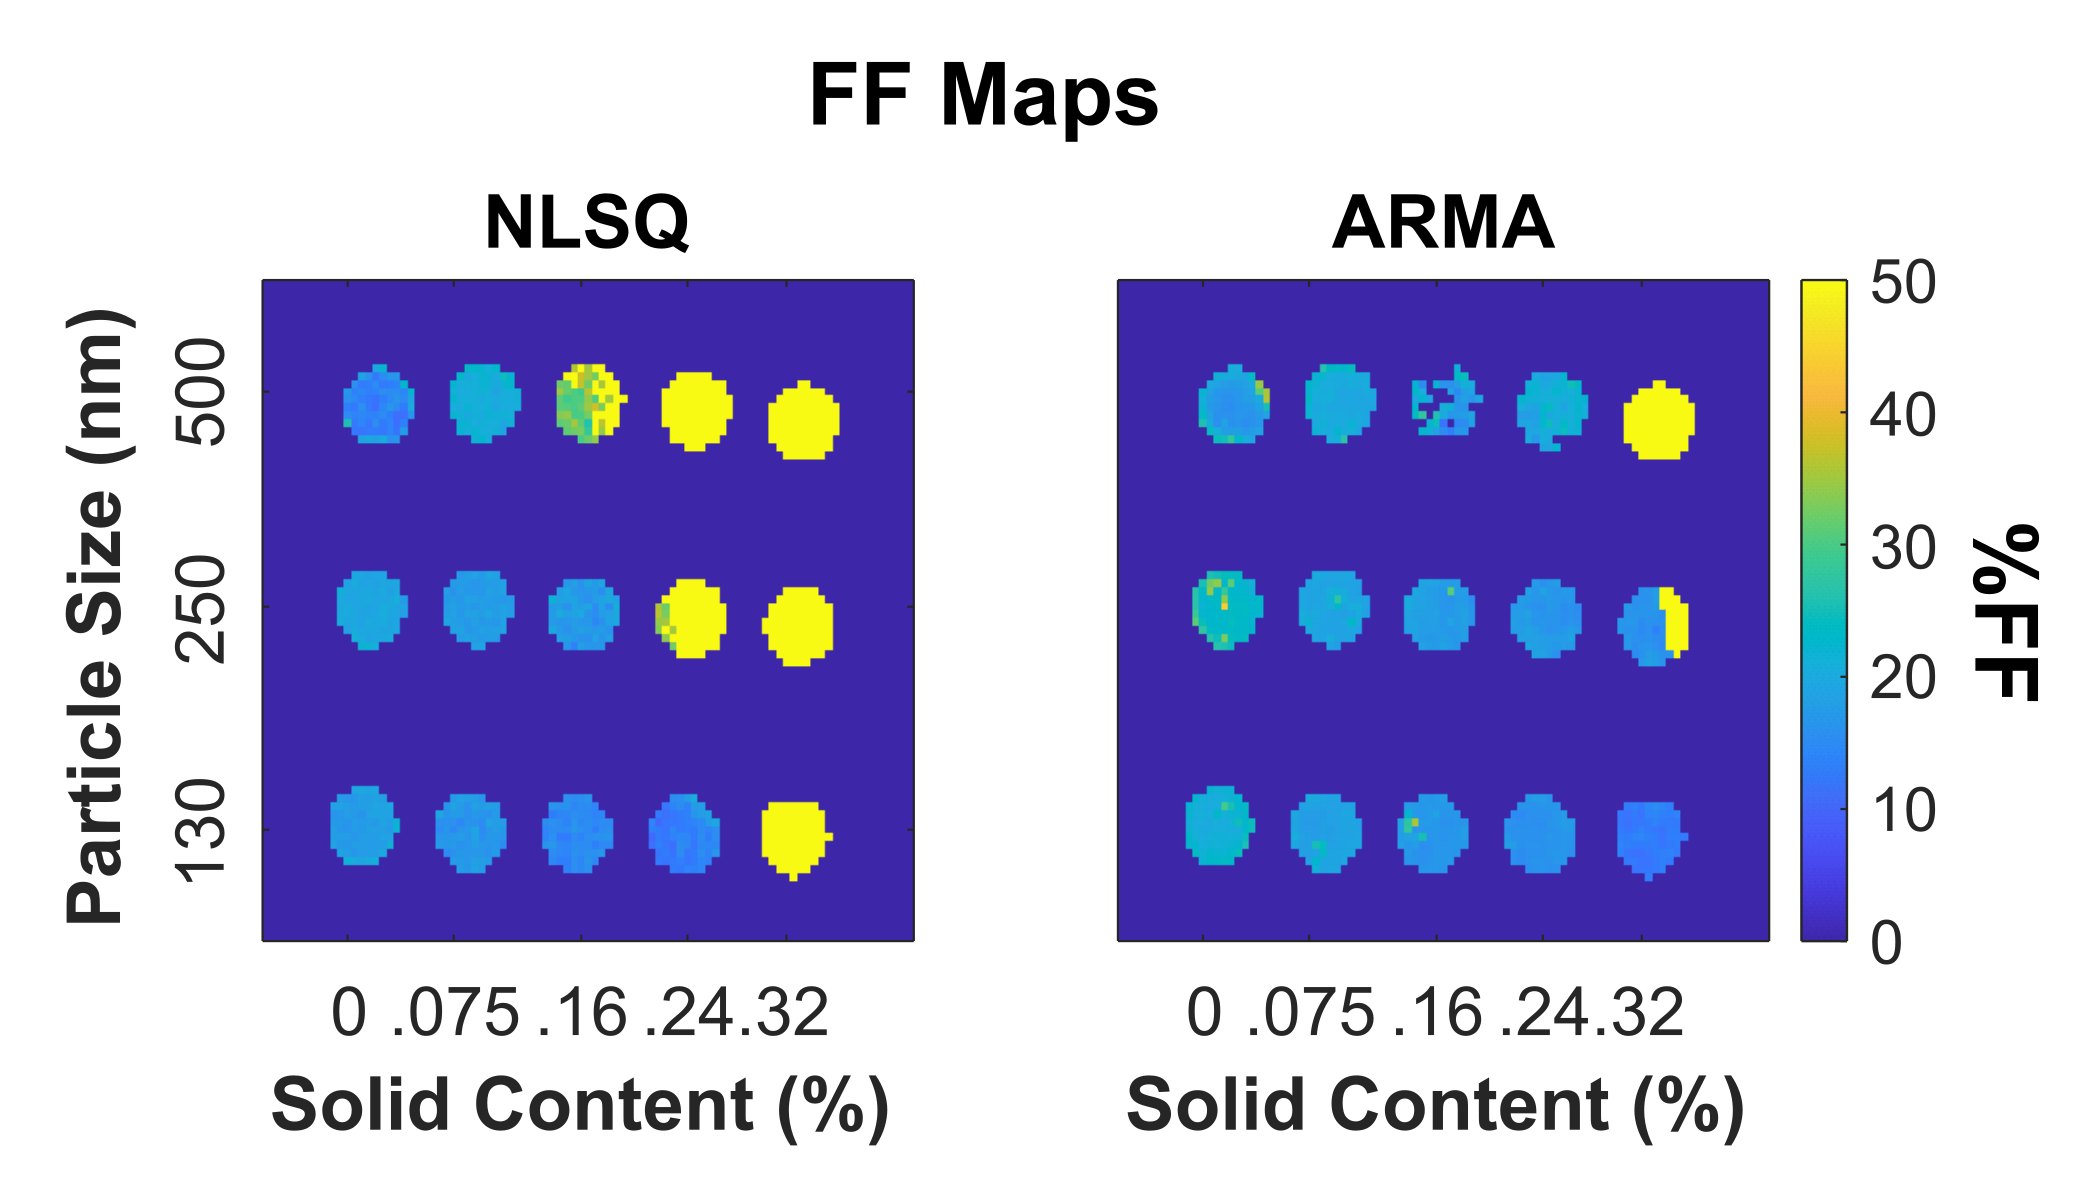
All three iron nanoparticle sizes tended to cluster larger than the manufacturer specifications, but the 130nm and 250nm nanoparticles clustered less as seen on Figure 1. However, the 500nm iron clusters were visibly larger and more condensed than 130nm and 250nm counterparts, and this clustering has resulted in a heterogenous MRI signal in these phantoms.As shown on Figure 2, increasing iron concentrations from 0% to 0.32% showed an increase in R2* for all particle sizes with iron-fat phantoms having a higher R2* than iron only phantoms on average. However, the 500nm nanoparticles were excluded from Figure 2 as the high inhomogeneity in the phantoms resulted in large standard deviations as evidenced in the R2* maps on Figure 3. Additionally, the 500nm phantoms produced larger R2* (32-2311s-1) than the values measured in the 250nm and 130nm iron-only and iron-fat phantoms for the same solid content as shown in Figure 3. This may be due to severe aggregation of the 500nm iron particles as clustering has been shown to increase R2*9. For the iron phantoms, all three R2* fitting models performed well; however, for the iron-fat phantoms, the NLSQ overestimated R2* at high iron concentrations. Figure 4 shows iron-fat phantoms with true FF values of 20%, but the difference in FF for some phantoms illustrates that higher concentrations and larger diameters of iron nanoparticles can confound FF quantification in the presence of fat, especially for the NLSQ model.
Limitations of this study include the limited range of R2* values (~0-300s-1) for the 130nm and 250nm iron phantoms despite matching the solid content concentrations with the 500nm iron particles. Previous studies on smaller iron particles (80nm) have been shown to generate clinical R2* values (0-1000 s-1)8, so future work should amplify the concentrations of 130nm and 250nm iron phantoms to cover the clinical R2* range.
Conclusion
Our study demonstrates that the size of iron nanoparticles, likely due to the degree of clustering, has profound effects on the MRI signal as well as on the magnitude of R2* values. Additionally, higher concentrations of iron and larger diameters of nanoparticles have been shown to confound FF values.Acknowledgements
This project was funded by the National Institutes of Health (NIH) grant #1R21EB031298.
The authors thank St. Jude Children’s Research Hospital for allowing the use of the MRI scanner.
References
1. Sirlin CB, Reeder SB. Magnetic resonance imaging quantification of liver iron. Magn Reson Imaging Clin N Am. 2010 Aug;18(3):359-81, ix. doi: 10.1016/j.mric.2010.08.014. PMID: 21094445; PMCID: PMC3430384.
2. Henninger, B. Demystifying liver iron concentration measurements with MRI. Eur Radiol 28, 2535–2536 (2018). https://doi.org/10.1007/s00330-017-5199-8
3. Wood JC, Fassler JD, Meade T. Mimicking liver iron overload using liposomal ferritin preparations. Magn Reson Med. 2004 Mar;51(3):607-11. doi: 10.1002/mrm.10735. PMID: 15004804; PMCID: PMC2892965.
4. Ghugre NR. “Calibration of iron-meditated MRI relaxation by Monte Carlo modeling”. 2008
5. Hines CD, Yu H, Shimakawa A, McKenzie CA, Brittain JH, Reeder SB. T1 independent, T2* corrected MRI with accurate spectral modeling for quantification of fat: validation in a fat-water-SPIO phantom. J Magn Reson Imaging. 2009 Nov;30(5):1215-22. doi: 10.1002/jmri.21957. PMID: 19856457; PMCID: PMC3205952.
6. Hankins, J. S., McCarville, M. B., Loeffler, R. B., Smeltzer, M. P., Onciu, M., Hoffer, F. A., Li, C. S., Wang, W. C., Ware, R. E., & Hillenbrand, C. M. (2009). R2* magnetic resonance imaging of the liver in patients with iron overload. Blood, 113(20), 4853–4855. https://doi.org/10.1182/blood-2008-12-191643
7. Hernando D, Liang ZP, Kellman P. Chemical shift-based water/fat separation: a comparison of signal models. Magn Reson Med. 2010 Sep;64(3):811-22. doi: 10.1002/mrm.22455. PMID: 20593375; PMCID: PMC2992842.
8. Tipirneni-Sajja, A., Krafft, A. J., Loeffler, R. B., Song, R., Bahrami, A., Hankins, J. S., & Hillenbrand, C. M. (2019). Autoregressive moving average modeling for hepatic iron quantification in the presence of fat. Journal of magnetic resonance imaging: JMRI, 50(5), 1620–1632. https://doi.org/10.1002/jmri.26682
9. Jeon M, Halbert MV, Stephen ZR, Zhang M. Iron Oxide Nanoparticles as T1 Contrast Agents for Magnetic Resonance Imaging: Fundamentals, Challenges, Applications, and Prospectives. Adv Mater. 2021 Jun;33(23):e1906539. doi: 10.1002/adma.201906539. Epub 2020 Jun 4. PMID: 32495404; PMCID: PMC8022883.
Figures