1855
The relationship between the prognosis of NAFLD and abdominal organ fat fraction1Department of Radiology, First Hospital of Jilin University, changchun, China, 2MR Scientific Marketing, Siemens Healthineers, Beijing, China
Synopsis
Keywords: Liver, Liver, NAFLD; prognosis; fat fraction; abdominal organ
The relationship between the prognosis of non-alcoholic fatty liver disease (NAFLD) treatment and the fat fraction or fat area of other abdominal organs has not been explored. In this study, we measured the proton density fat fraction of four subsegments of the liver, pancreas, renal cortex, thoracic 12 and lumbar 1 vertebral body, and the area of subcutaneous adipose tissue and visceral adipose tissue at the level of lumbar 3, and explored their relationship with the prognosis of NAFLD.Introduction
Non-alcoholic fatty liver disease (NAFLD) is a common chronic disease with a global prevalence averaging 25%, and is predicted to be the most common indication for liver transplantation by 2030.1,2 Most people with type 2 diabetes have NAFLD,3,4 and the strategies to manage diabetes will be evaluated based on the effectiveness in treating patients with NAFLD.5 Despite numerous clinical trials, the treatment of NAFLD remains a challenge.6 It is important to investigate factors related to the NAFLD prognosis. The relationship between the prognosis of NAFLD and the fat content of other abdominal organs are uncertain. Our aim was to analyze the significance of fat content in other anatomical sites of the abdomen as a predictor of NAFLD prognosis.Methods
A retrospective analysis of baseline MRI-PDFF scans was performed in NAFLD effective treatment group (greater than or equal to 30% relative reduction, n=10) and ineffective treatment group (n=10) in NAFLD with type 2 diabetes. The MRI-PDFF examinations were performed on a 3T system (MAGNETOM Vida, Siemens Healthineers Erlangen, Germany). MRI-PDFF scan parameters are as follows: FOV=360-380mm, slice thickness=4mm, matrix=160*136, TE=2.38ms, 4.76ms, 7.14ms, 9.52ms, 11.9ms, 14.28ms, TR=15.6 ms, flip angle=4ᵒ. MRI-PDFF measurements were obtained from liver, pancreas, renal cortex, and thoracic 12 (T12) and lumbar 1 (L1) vertebral body. In addition, the areas of subcutaneous adipose tissue (SAT) and visceral adipose tissue (VAT) were measured using sliceOmatic software. For statistical tests, Fisher exact test, t-test and Wilcoxon rank sum test were used as appropriate.Results
The mean age of all study patients was 54.7 years. The liver, pancreatic head, body and tail, renal cortex, T12 and L1 vertebral body PDFFs were 11.76%± 4.07, 3.80% (3.10, 13.35), 4.37% (2.60, 9.37), 5.45% ± 3.37, 1.76% ± 0.52 (Kidney-L), 1.34% (1.13, 1.74) (Kidney-R), 47.66% (41.52, 56.74), and 53.12% (39.96, 55.58), respectively. No correlation was observed between MRI-PDFF of the liver, pancreas, renal cortex, vertebral body in the effective group and the ineffective group, as well as the SAT and VAT area. The effective group had slightly lower pancreas PDFF (head: 3.80% (3.50, 6.64) vs. 5.12% (2.86, 17.79), P = 0.85; body: 3.78 (2.75, 10.44) vs. 5.54% (2.51, 7.98), P = 0.80). The effective group had slightly higher T12 and L1 vertebral body PDFF compared with noneffective group (53.49% (42.02, 57.91) vs. 46.59% (29.18, 49.52), P = 0.28; 53.92% (43.2, 56.12) vs. 52.52% (30.16, 54.86), P = 0.35). In addition, the effective group had slightly higher VAT (201.56cm3 ± 87.77 cm3 vs. 182.65 cm3 ± 48.90 cm3, P = 0.56).Discussion
This study is the first to investigate the relationship between the prognosis of NAFLD treatment and the fat fraction of the liver, pancreas, kidneys and vertebral bodies, and the area of SAT and VAT. The results showed that these abdominal organs PDFF was not associated with the prognosis of NAFLD. In the literature, no correlation was observed between liver PDFF and pancreas, kidney, and vertebral PDFF.7 We further verified the absence of association between them here. Meanwhile, this study also needs more sample size to increase the reliability of the results. There was slight increase in T12, L1 vertebral body and VAT PDFF and a decrease in pancreas PDFF in the effective group, although it was not statistically significant. In addition, it has also been reported that liver PDFF is positively correlated with serum alanine aminotransferase, total bilirubin, and triglyceride levels, and negatively correlated with serum high-density lipoprotein levels.7 In the future, we will continue to explore the relationship between NAFLD prognosis and clinical and laboratory results.Conclusion
The prognosis of NAFLD is not related to fat fraction or fat area of other abdominal organs. The NAFLD prognosis related factors need to be further explored.Acknowledgements
No acknowledgement found.References
1. Yki-Järvinen H. (2016). Diagnosis of non-alcoholic fatty liver disease (NAFLD). Diabetologia, 59(6), 1104–1111. https://doi.org/10.1007/s00125-016-3944-1
2. Byrne, C. D., & Targher, G. (2015). NAFLD: a multisystem disease. Journal of hepatology, 62(1 Suppl), S47–S64. https://doi.org/10.1016/j.jhep.2014.12.012
3. Browning, J. D., Szczepaniak, L. S., Dobbins, R., Nuremberg, P., Horton, J. D., Cohen, J. C., Grundy, S. M., & Hobbs, H. H. (2004). Prevalence of hepatic steatosis in an urban population in the United States: impact of ethnicity. Hepatology (Baltimore, Md.), 40(6), 1387–1395. https://doi.org/10.1002/hep.20466
4. Wong, S. W., & Chan, W. K. (2020). Epidemiology of non-alcoholic fatty liver disease in Asia. Indian journal of gastroenterology : official journal of the Indian Society of Gastroenterology, 39(1), 1–8. https://doi.org/10.1007/s12664-020-01018-x
5. Rahimi Naini, S., & Fuchs, M. (2014). Non-alcoholic fatty liver disease in patients with diabetes mellitus. Expert review of endocrinology & metabolism, 9(5), 503–514. https://doi.org/10.1586/17446651.2014.938053
6. Federico, A., Zulli, C., de Sio, I., Del Prete, A., Dallio, M., Masarone, M., & Loguercio, C. (2014). Focus on emerging drugs for the treatment of patients with non-alcoholic fatty liver disease. World journal of gastroenterology, 20(45), 16841–16857. https://doi.org/10.3748/wjg.v20.i45.16841
7. Idilman, I. S., Tuzun, A., Savas, B., Elhan, A. H., Celik, A., Idilman, R., & Karcaaltincaba, M. (2015). Quantification of liver, pancreas, kidney, and vertebral body MRI-PDFF in non-alcoholic fatty liver disease. Abdominal imaging, 40(6), 1512–1519. https://doi.org/10.1007/s00261-015-0385-0
Figures
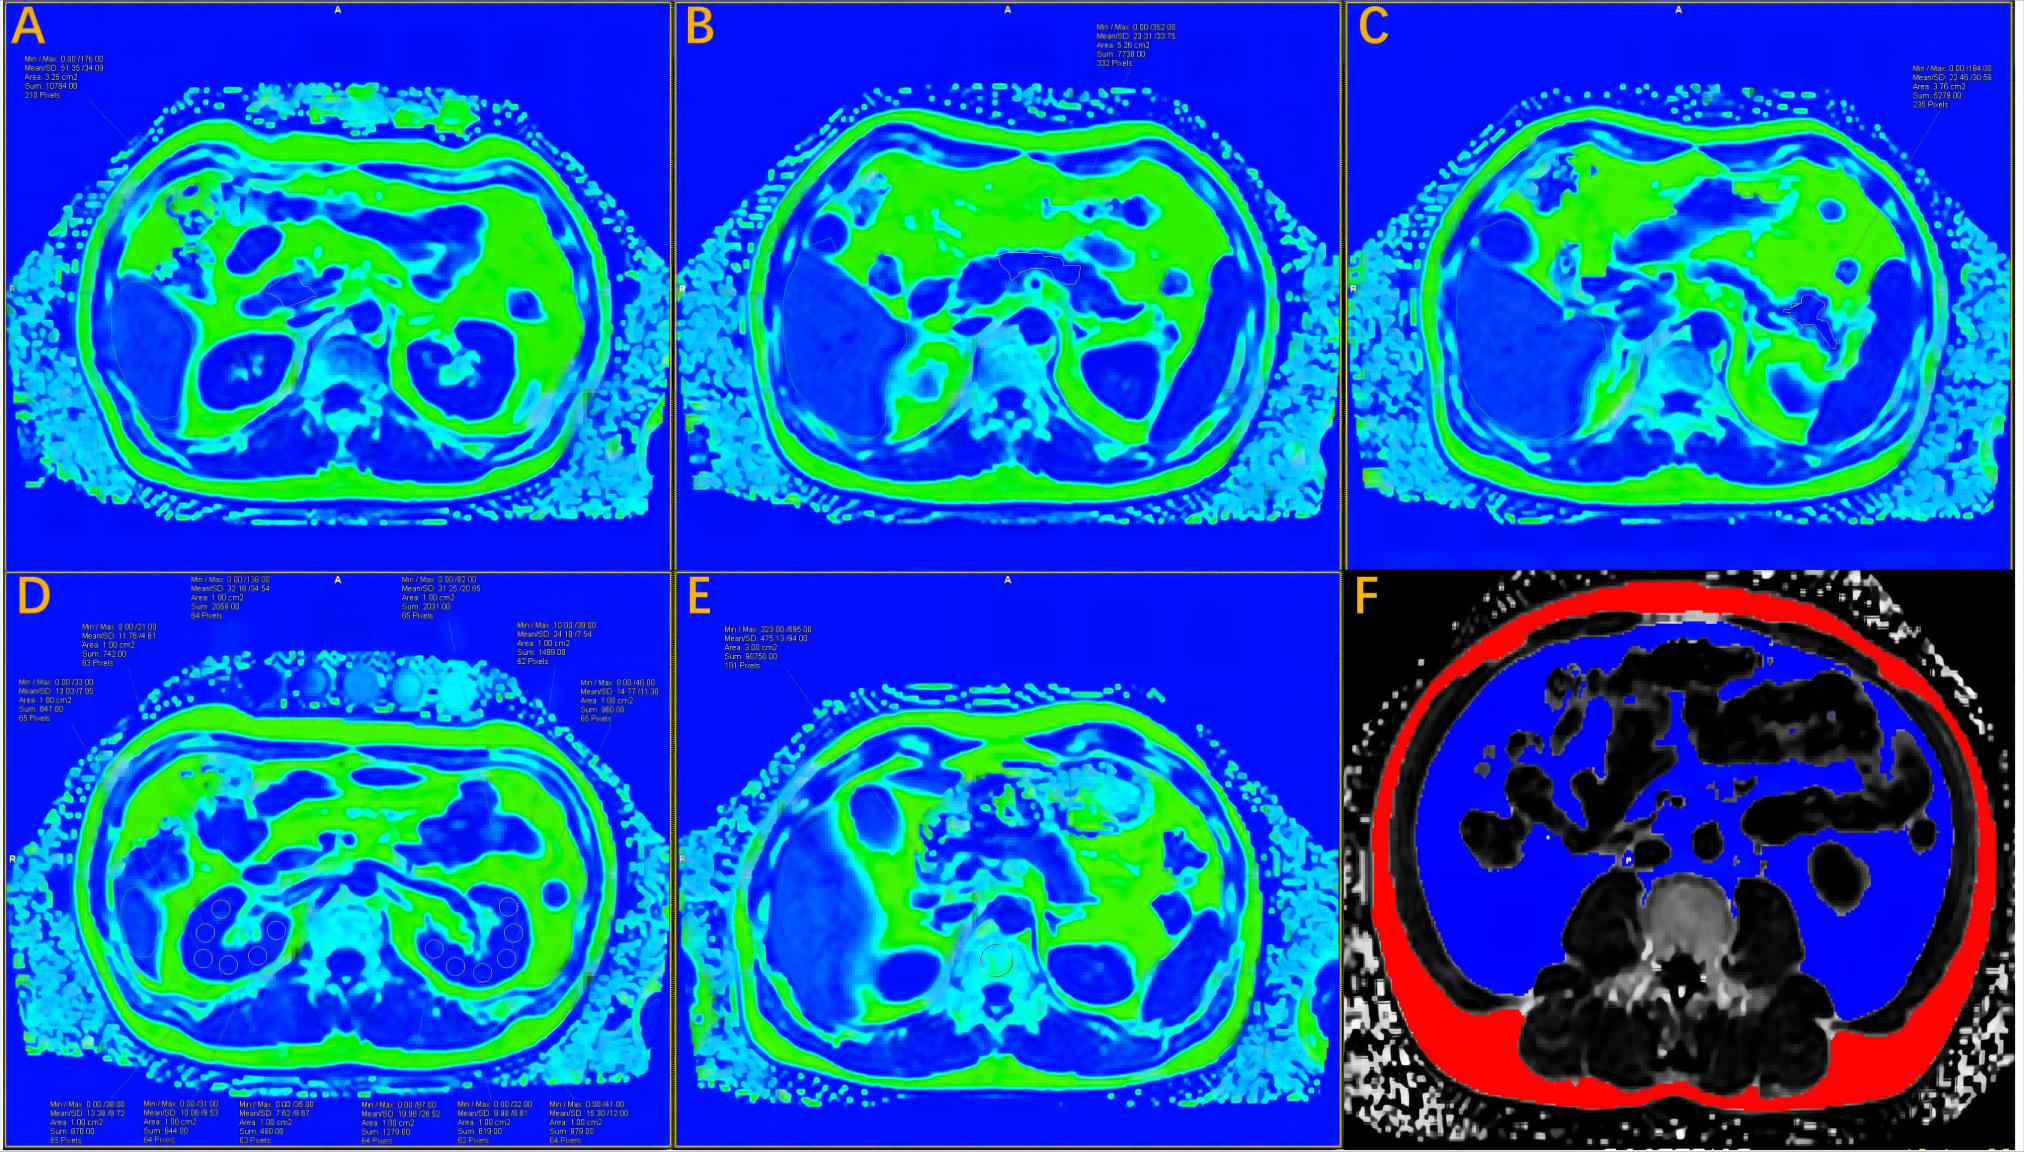
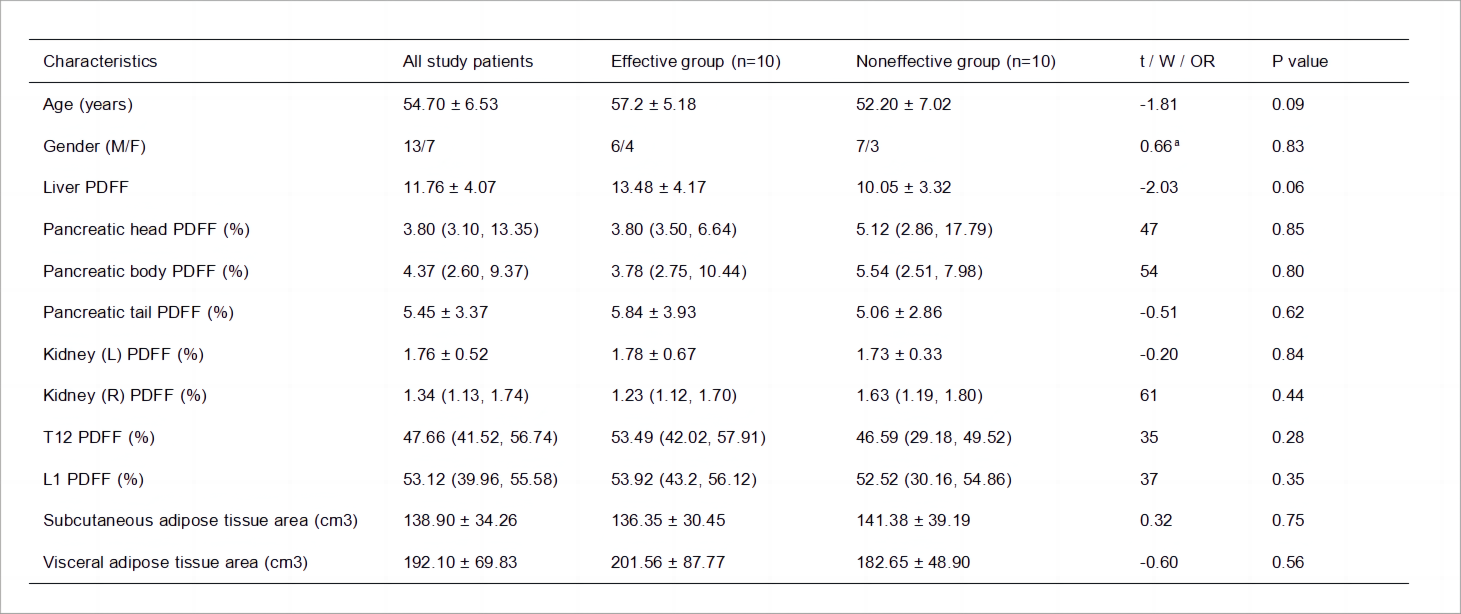
Table1 The characteristics of 20 patients.
a odds ratio (OR) from Fisher's exact test