1854
In Vivo Evaluation of a Novel Deep Learning-based MR Image Reconstruction for Liver Fat Quantification1Department of Radiology, University of Wisconsin-Madison, Madison, WI, United States, 2Department of Radiology and Nuclear Medicine, Universität zu Lübeck, Lübeck, Germany, 3GE Healthcare, Waukesha, WI, United States, 4Department of Medical Physics, University of Wisconsin-Madison, Madison, WI, United States, 5Department of Biomedical Engineering, University of Wisconsin-Madison, Madison, WI, United States, 6Department of Departments of Electrical & Computer Engineering, University of Wisconsin-Madison, Madison, WI, United States, 7Department of Radiology, University of California San Diego, San Diego, CA, United States, 8Department of Medicine, University of Wisconsin-Madison, Madison, WI, United States, 9Department of Emergency Medicine, University of Wisconsin-Madison, Madison, WI, United States
Synopsis
Keywords: Liver, Quantitative Imaging
Deep learning (DL)-based MR reconstruction methods show promise to reduce image noise compared to conventional image reconstruction while maintaining quantitative accuracy. The purpose of this work is to apply and evaluate the performance of DL reconstruction to chemical shift-encoded MRI for quantification of proton density fat-fraction (PDFF) in the liver. We compared quantitative PDFF results, test-retest repeatability, and standard deviation within regions of interest in nine patients with a wide range of PDFF (1-31%), for different levels of DL denoising. PDFF between reconstructions showed excellent agreement and constant test-retest repeatability. Standard deviation decreased with increasing DL denoising levels.
Introduction
Chemical shift-encoded MRI (CSE-MRI) is today’s standard quantitative imaging technique for the measurement of proton density fat fraction (PDFF) in the liver1. New developments in this area focus on shorter acquisition times and improved motion robustness 2,3. These improvements generally come at the cost of a lower signal-to-noise ratio (SNR), so denoising strategies are critical.A novel commercial deep learning reconstruction algorithm4 has been shown to provide improved denoising. It has been evaluated with conventional 2D methods6,7. However, this approach has yet to be applied to 3D CSE-MRI for quantitative PDFF mapping in the liver. Therefore, the purpose of this work is to evaluate the performance of a deep learning denoising reconstruction algorithm on 3D PDFF mapping in the liver.
Methods
Study populationThe study cohort consisted of subjects from two IRB-approved ongoing prospective multicenter studies. One study recruited consecutive adult patients undergoing routine MRI of the liver, the other enrolled patients with obesity undergoing weight loss surgery.
Image acquisition and reconstruction
CSE-MRI was acquired to quantify PDFF (IDEAL IQ, GE, USA) at 1.5T or 3.0T (GE Signa Artist/Architect, USA) in a test-retest paradigm (Table 1). Raw source echo data were reconstructed using a conventional image reconstruction pipeline. The same raw data were also reconstructed using an investigational 3D version of a commercial deep learning-based MR image reconstruction pipeline4 with three denoising factors (low: 30%, medium: 50%, high: 75%; AIR Recon DL, GE, USA). Fitting was performed using a combination of complex and magnitude-based non-linear least squares as provided in an investigational version of a 3D multi-echo CSE-MRI prototype8,9 (IronQuant, GE Healthcare).
Analysis
Reconstructed PDFF maps were analyzed in OsiriX (v12.5.3, Pixmeo, Switzerland) by placing largest possible ROIs in each Couinaud segment, avoiding large vessels, bile ducts, and obvious artifacts10 (Figure 1). ROIs were colocalized using copy/paste functionality, across the four image reconstructions. ROIs were not strictly colocalized between test and retest acquisitions to account for subtle differences in anatomical coverage. All analyses were performed by an experienced radiologist.
For each reconstruction, mean and standard deviation (SD) of the pixel-wise PDFF values were calculated for each ROI separately and across all Couinaud segments combined. SD was used to evaluate the impact of the DL denoising, noting that biological variability across the voxel would be identical between reconstructions since the underlying raw data were identical.
Regression analysis and Bland-Altman plots were generated for the median PDFF values to investigate the correlation and agreement between 1) the conventional reconstruction and each of the three DL reconstructions as well as 2) test-retest acquisitions. The hypothesis of a reduction in SD for measurements on DL-reconstructed PDFF maps compared to conventionally reconstructed PDFF maps was tested with a one-tailed paired t-test with a significance level of 0.05.
Results
We included 9 patients (5 female; age: 36-64 years; weight: 58-50kg; BMI: 20-50kg/m2) with a median PDFF between 1-31%. The 2 subjects with highest PDFF had no repeat exam.PDFF results from DL reconstructions were highly correlated with the conventional reconstruction (R²=0.997) and showed excellent agreement with narrow limits of agreement of ±0.8 PDFF% (Figure 2). Test-retest exams showed good correlation (R²≥0.869) with limits of agreement of ±3.2 PDFF% (Figure 3). SD was significantly lower in the DL-med and DL-high reconstruction compared to conventional reconstruction (p≤0.018, Figure 4).
Discussion
We successfully combined and evaluated a deep learning denoising reconstruction algorithm with 3D CSE-MRI for PDFF mapping in the liver. Specifically, DL reconstruction did not introduce bias, generally reduced noise, and did not affect test-retest repeatability.Interestingly, the variability of PDFF within ROIs, as measured by the SD, decreased with increasing denoising levels but was only significant for the two higher denoising settings. This may be due to excellent underlying image quality with high SNR in the original data as well as expected physiological variability of PDFF in the liver.
The performance of the tested DL reconstruction has been preliminarily evaluated in multiple organs such as the brain4, heart6, and uterus7. One study focusing on the liver showed improvement of signal-to-noise and contrast-to-noise in SSFSE T2, DWI and ADC maps. However, they did not evaluate the agreement of quantitative biomarker results between different reconstructions11. In contrast, we focused on the equivalence of quantitative PDFF measurements after DL and conventional reconstruction of CSE-MRI as has been done in the past for other DL reconstructions12.
Limitations of this study include the small study cohort and a lack of test-retest data for high PDFF values. This is a preliminary study that suggests non-inferiority of DL reconstruction in quantitative CSE-MRI with excellent image quality. In future work we will evaluate the combination of DL reconstruction and CSE-MRI with low-SNR data, higher PDFF values, and compare this combination with conventionally reconstructed high-SNR images to demonstrate the added value of DL reconstruction with CSE-MRI.
Conclusion
In this preliminary study, we successfully combined and demonstrated the feasibility of a DL denoising reconstruction in combination with 3D CSE-MRI for estimation of PDFF in the liver. Our results demonstrate successful implementation of this approach, which shows an absence of any introduced bias. Further, improvements in the apparent noise of PDFF estimates and constant test-retest repeatability were observed.Acknowledgements
This work was supported by the NIH (R01 DK088925 and R01EB031886) and Pfizer Inc. The authors also acknowledge GE Healthcare who provides research support to the University of Wisconsin-Madison, as well as clinical research support from Pfizer. Dr. Oechtering receives funding from the German Research Foundation (OE 746/1-1). Finally, Dr. Reeder is the Fred Lee Sr. Endowed Chair of Radiology.
References
1. Starekova J, Reeder SB. Liver fat quantification: where do we stand? Abdom Radiol (NY) 2020;45:3386-99.
2. Zhao R, Zhang Y, Wang X, et al. Motion-robust, high-SNR liver fat quantification using a 2D sequential acquisition with a variable flip angle approach. Magn Reson Med 2020;84:2004-17.
3. Starekova J, Zhao R, Colgan TJ, et al. Improved free-breathing liver fat and iron quantification using a 2D chemical shift-encoded MRI with flip angle modulation and motion-corrected averaging. Eur Radiol 2022;32:5458-67.
4. Lebel RM. Performance characterization of a novel deep learning-based MR image reconstruction pipeline. arXiv preprint arXiv:200806559 2020.
5. Shafique A, Cao G, Khan Z, Asad M, Aslam M. Deep Learning-Based Change Detection in Remote Sensing Images: A Review. Remote Sensing 2022;14:871.
6. Muscogiuri G, Martini C, Gatti M, et al. Feasibility of late gadolinium enhancement (LGE) in ischemic cardiomyopathy using 2D-multisegment LGE combined with artificial intelligence reconstruction deep learning noise reduction algorithm. International journal of cardiology 2021;343:164-70.
7. Tsuboyama T, Onishi H, Nakamoto A, et al. Impact of Deep Learning Reconstruction Combined With a Sharpening Filter on Single-Shot Fast Spin-Echo T2-Weighted Magnetic Resonance Imaging of the Uterus. Investigative radiology 2022;57:379-86.
8. Yu H, Shimakawa A, Hines CDG, et al. Combination of complex-based and magnitude-based multiecho water-fat separation for accurate quantification of fat-fraction. Magnetic Resonance in Medicine 2011;66:199-206.
9. Hernando D, Hines CDG, Yu H, Reeder SB. Addressing phase errors in fat-water imaging using a mixed magnitude/complex fitting method. Magnetic Resonance in Medicine 2012;67:638-44.
10. Campo CA, Hernando D, Schubert T, Bookwalter CA, Pay AJV, Reeder SB. Standardized Approach for ROI-Based Measurements of Proton Density Fat Fraction and R2* in the Liver. AJR American journal of roentgenology 2017;209:592-603.
11. Zerunian M, Pucciarelli F, Caruso D, et al. Artificial intelligence based image quality enhancement in liver MRI: a quantitative and qualitative evaluation. La Radiologia medica 2022;127:1098-105.
12. Zhu A, Zhang Y, McMillan A, et al. Deep Learning-based Quantification of Proton Density Fat Fraction and R2* in the Liver. ISMRM. virtual, Abstract #05142020.
Figures
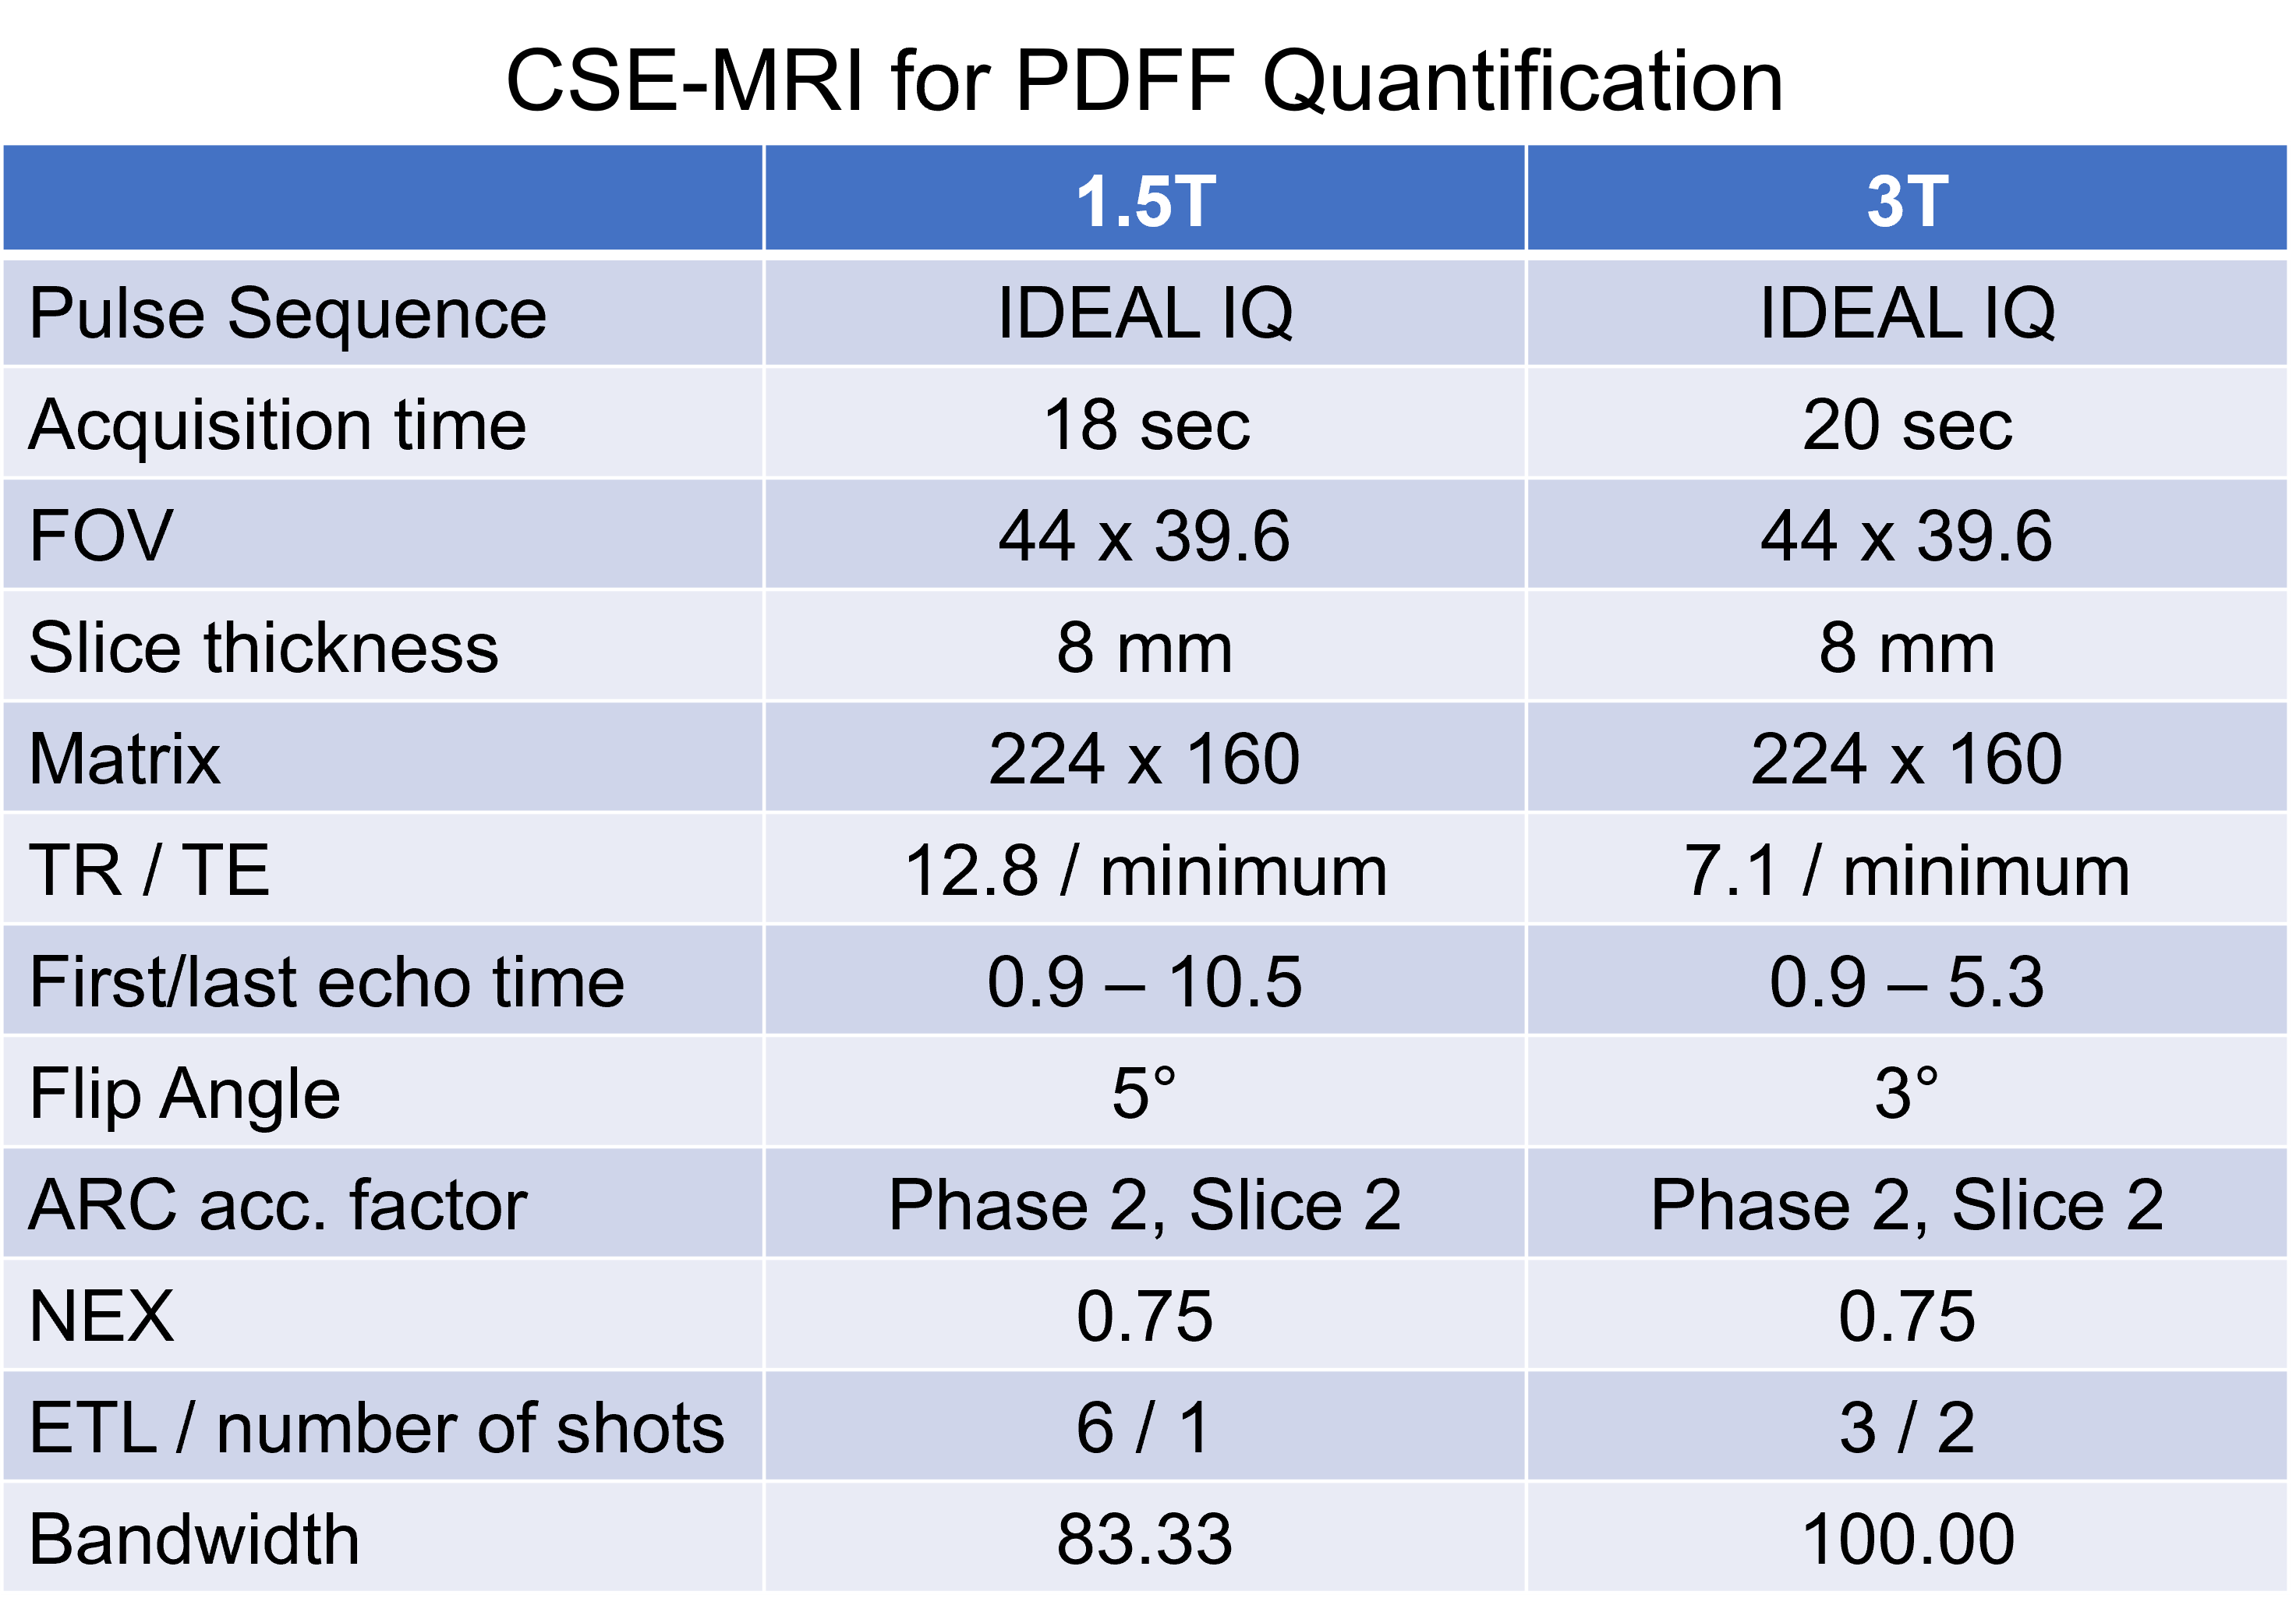
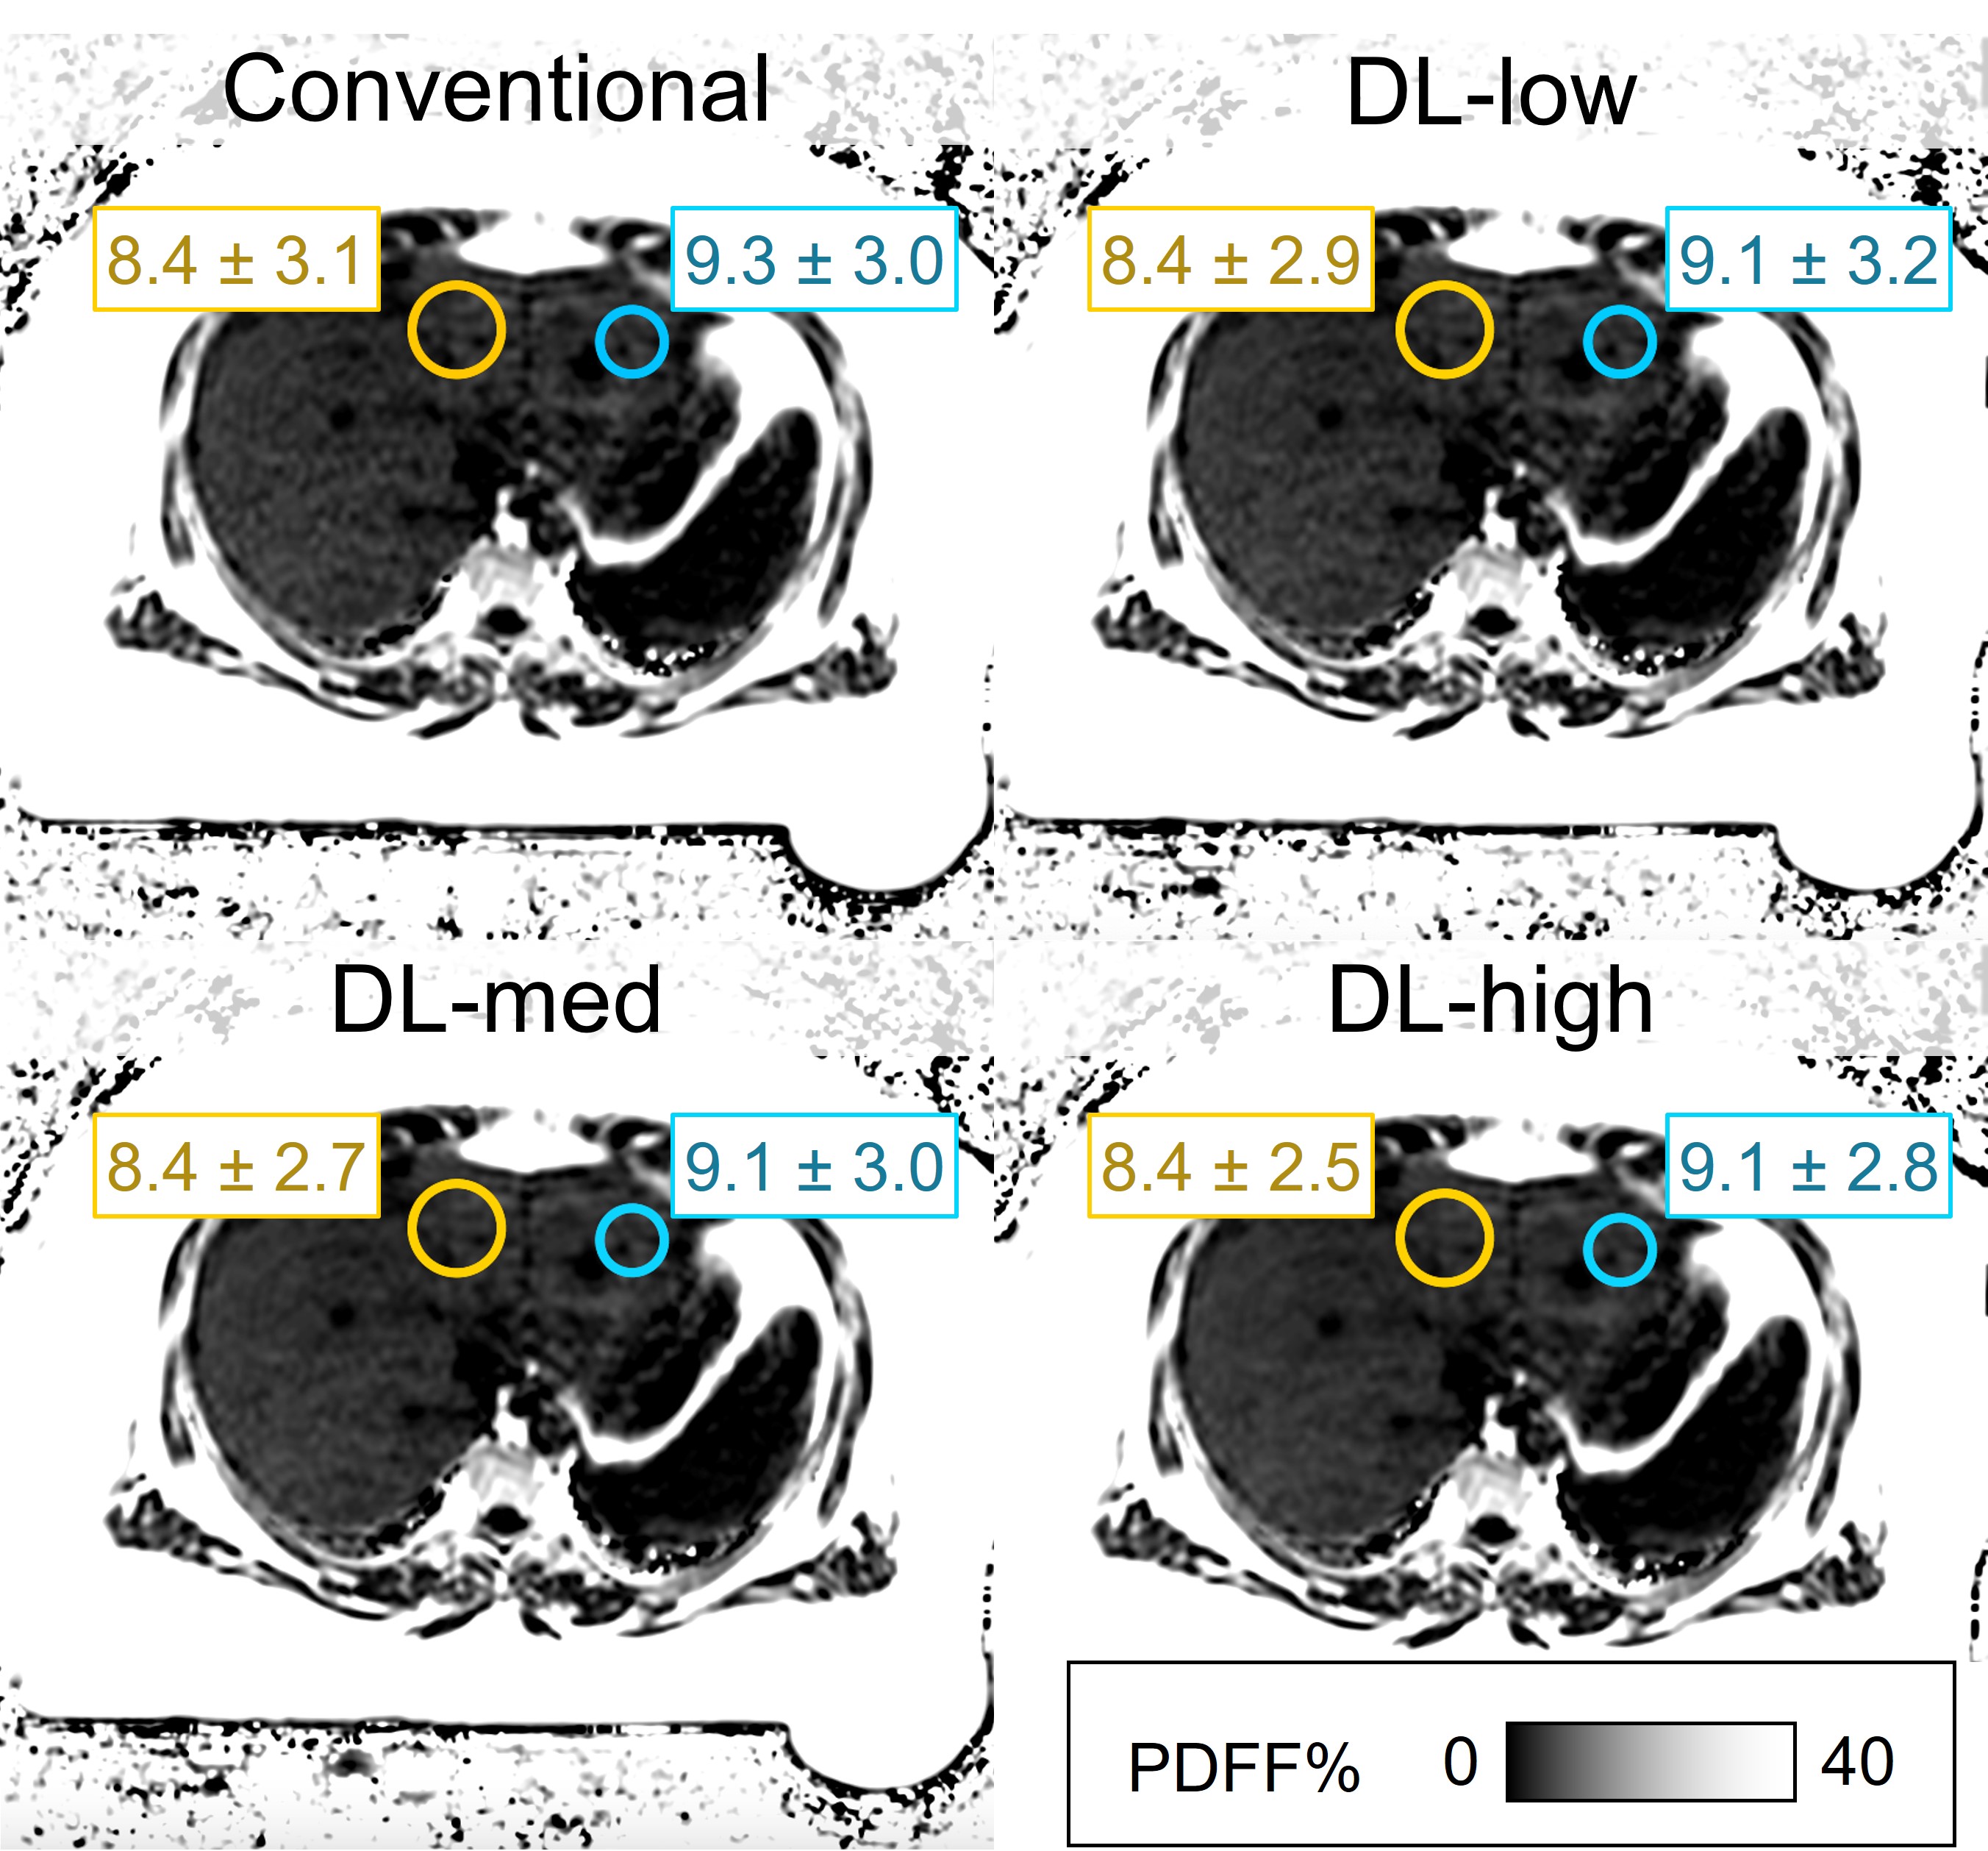
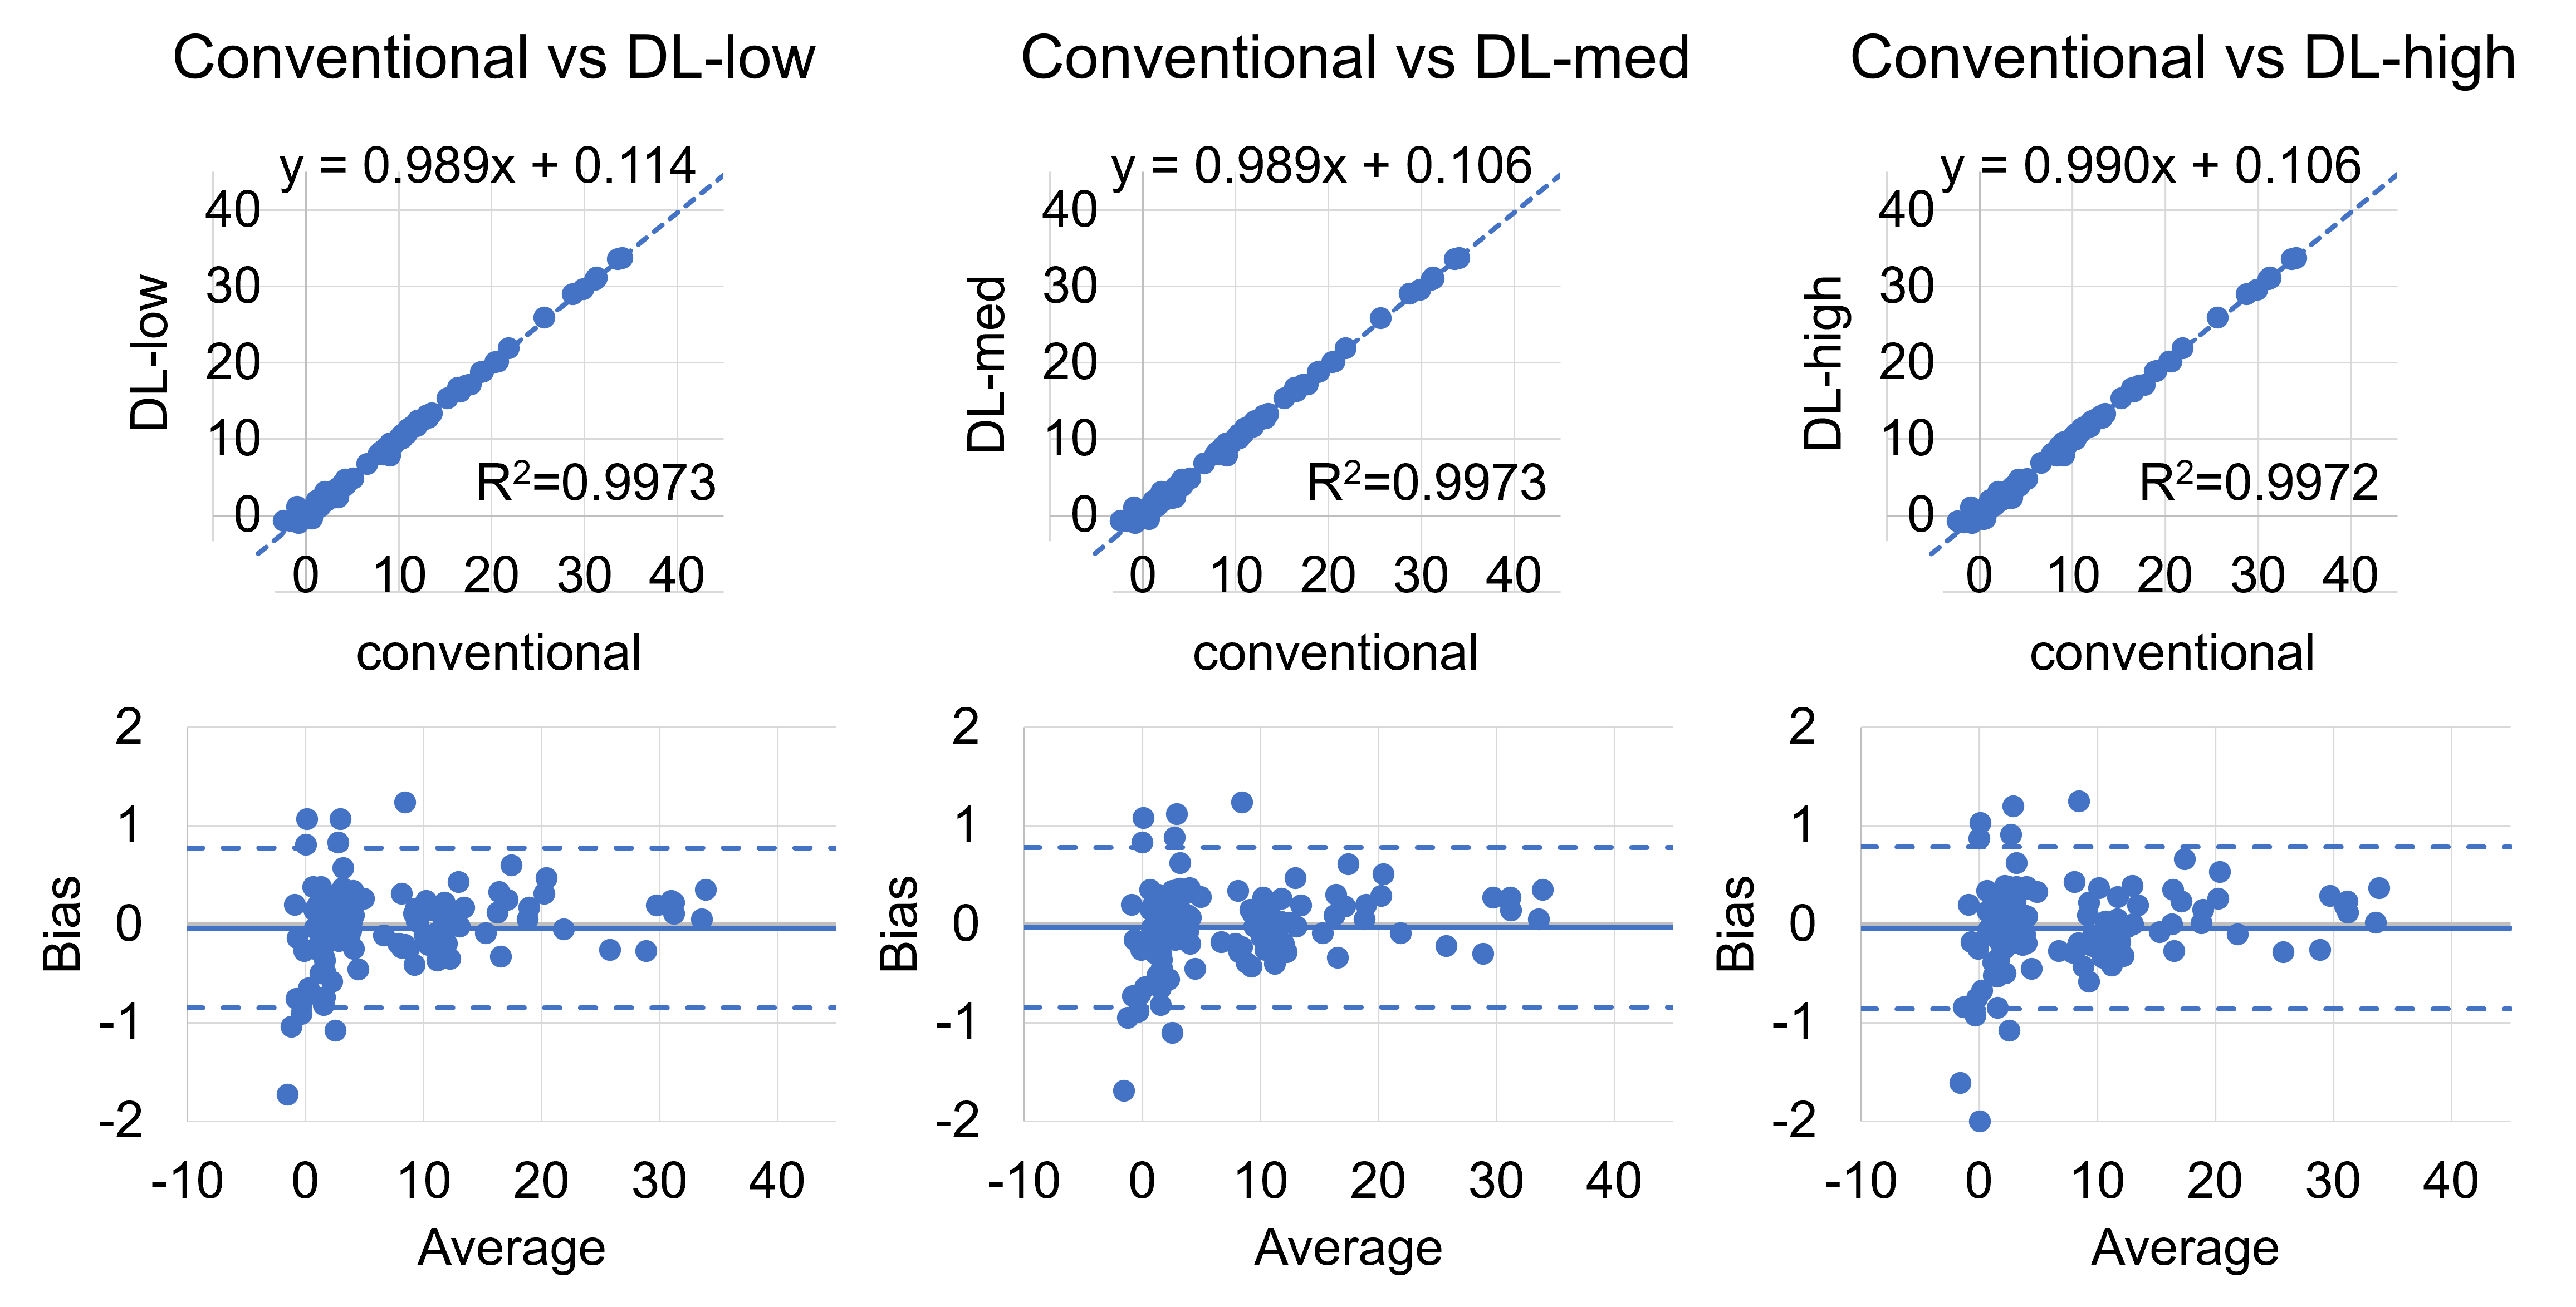
Figure 2: No bias in PDFF estimation is introduced with the DL reconstruction. Shown are comparisons between the conventional reconstruction and three different settings of the novel deep learning-based image reconstruction pipeline (denoising factors: low: 30%, medium: 50%, high: 75%). Linear regression shows high correlation (R2=0.997; upper row). Bland-Altman plots show minimal bias between the conventionally reconstructed images and all DL-reconstructions (ULA ≤ 0.79 PDFF%; LLA ≥ -0.86 PDFF%; lower row).
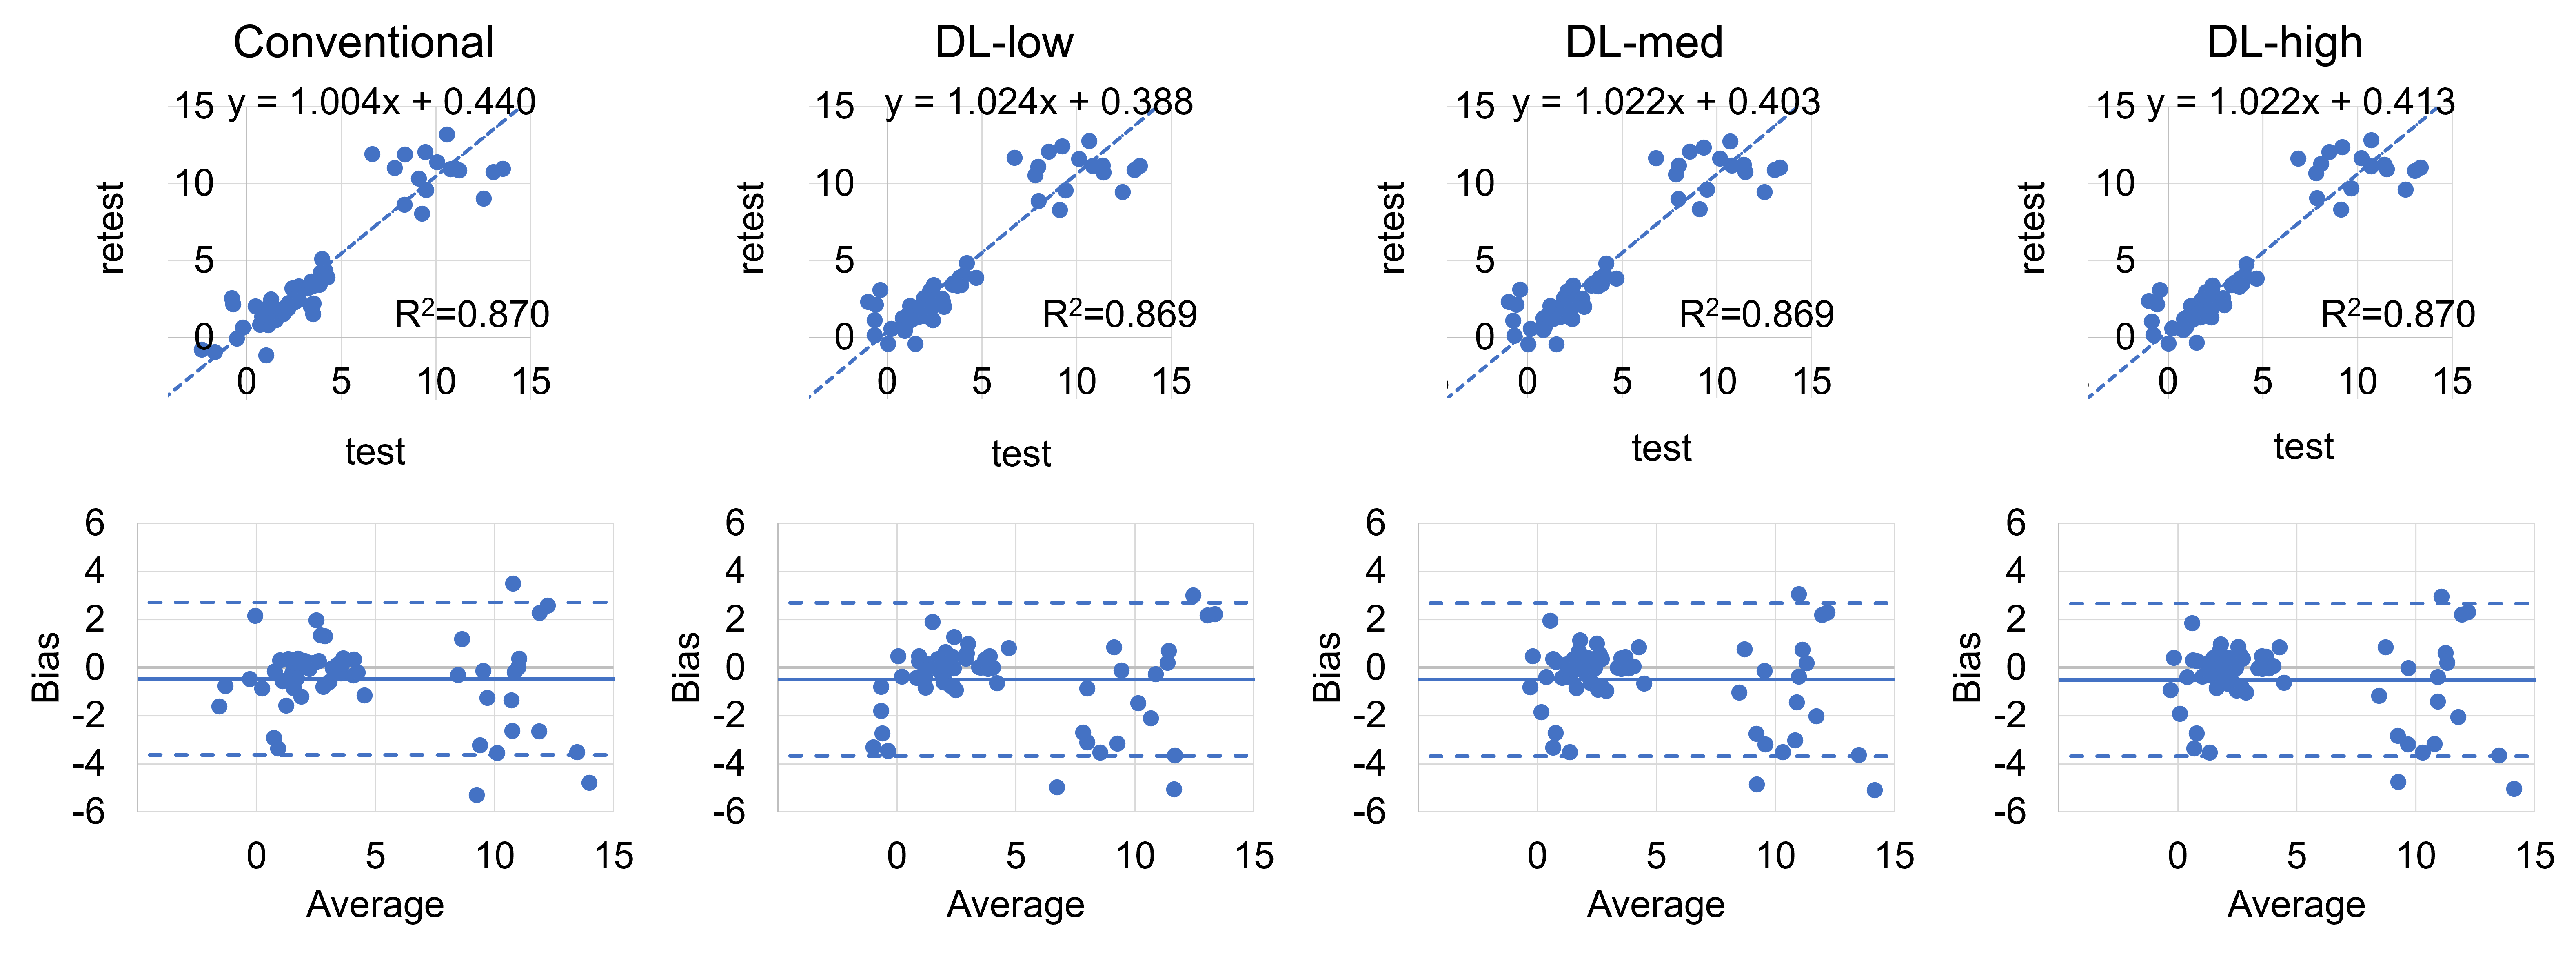
Figure 3: Test-retest repeatability of PDFF measurements was comparable between all reconstruction pipelines - conventional, and deep learning-based. Linear regression shows high correlation (R2=0.87; top row). Bland-Altman plots show small bias between measurements (ULA ≤ 2.72 PDFF%; LLA ≥ -3.68 PDFF%; bottom row). Broader limits of agreement compared with measurements of the same acquisition (Figure 2) are most likely due to ROI placement avoiding large vessels, bile ducts, and artifacts, but no strict colocalization between test and retest.
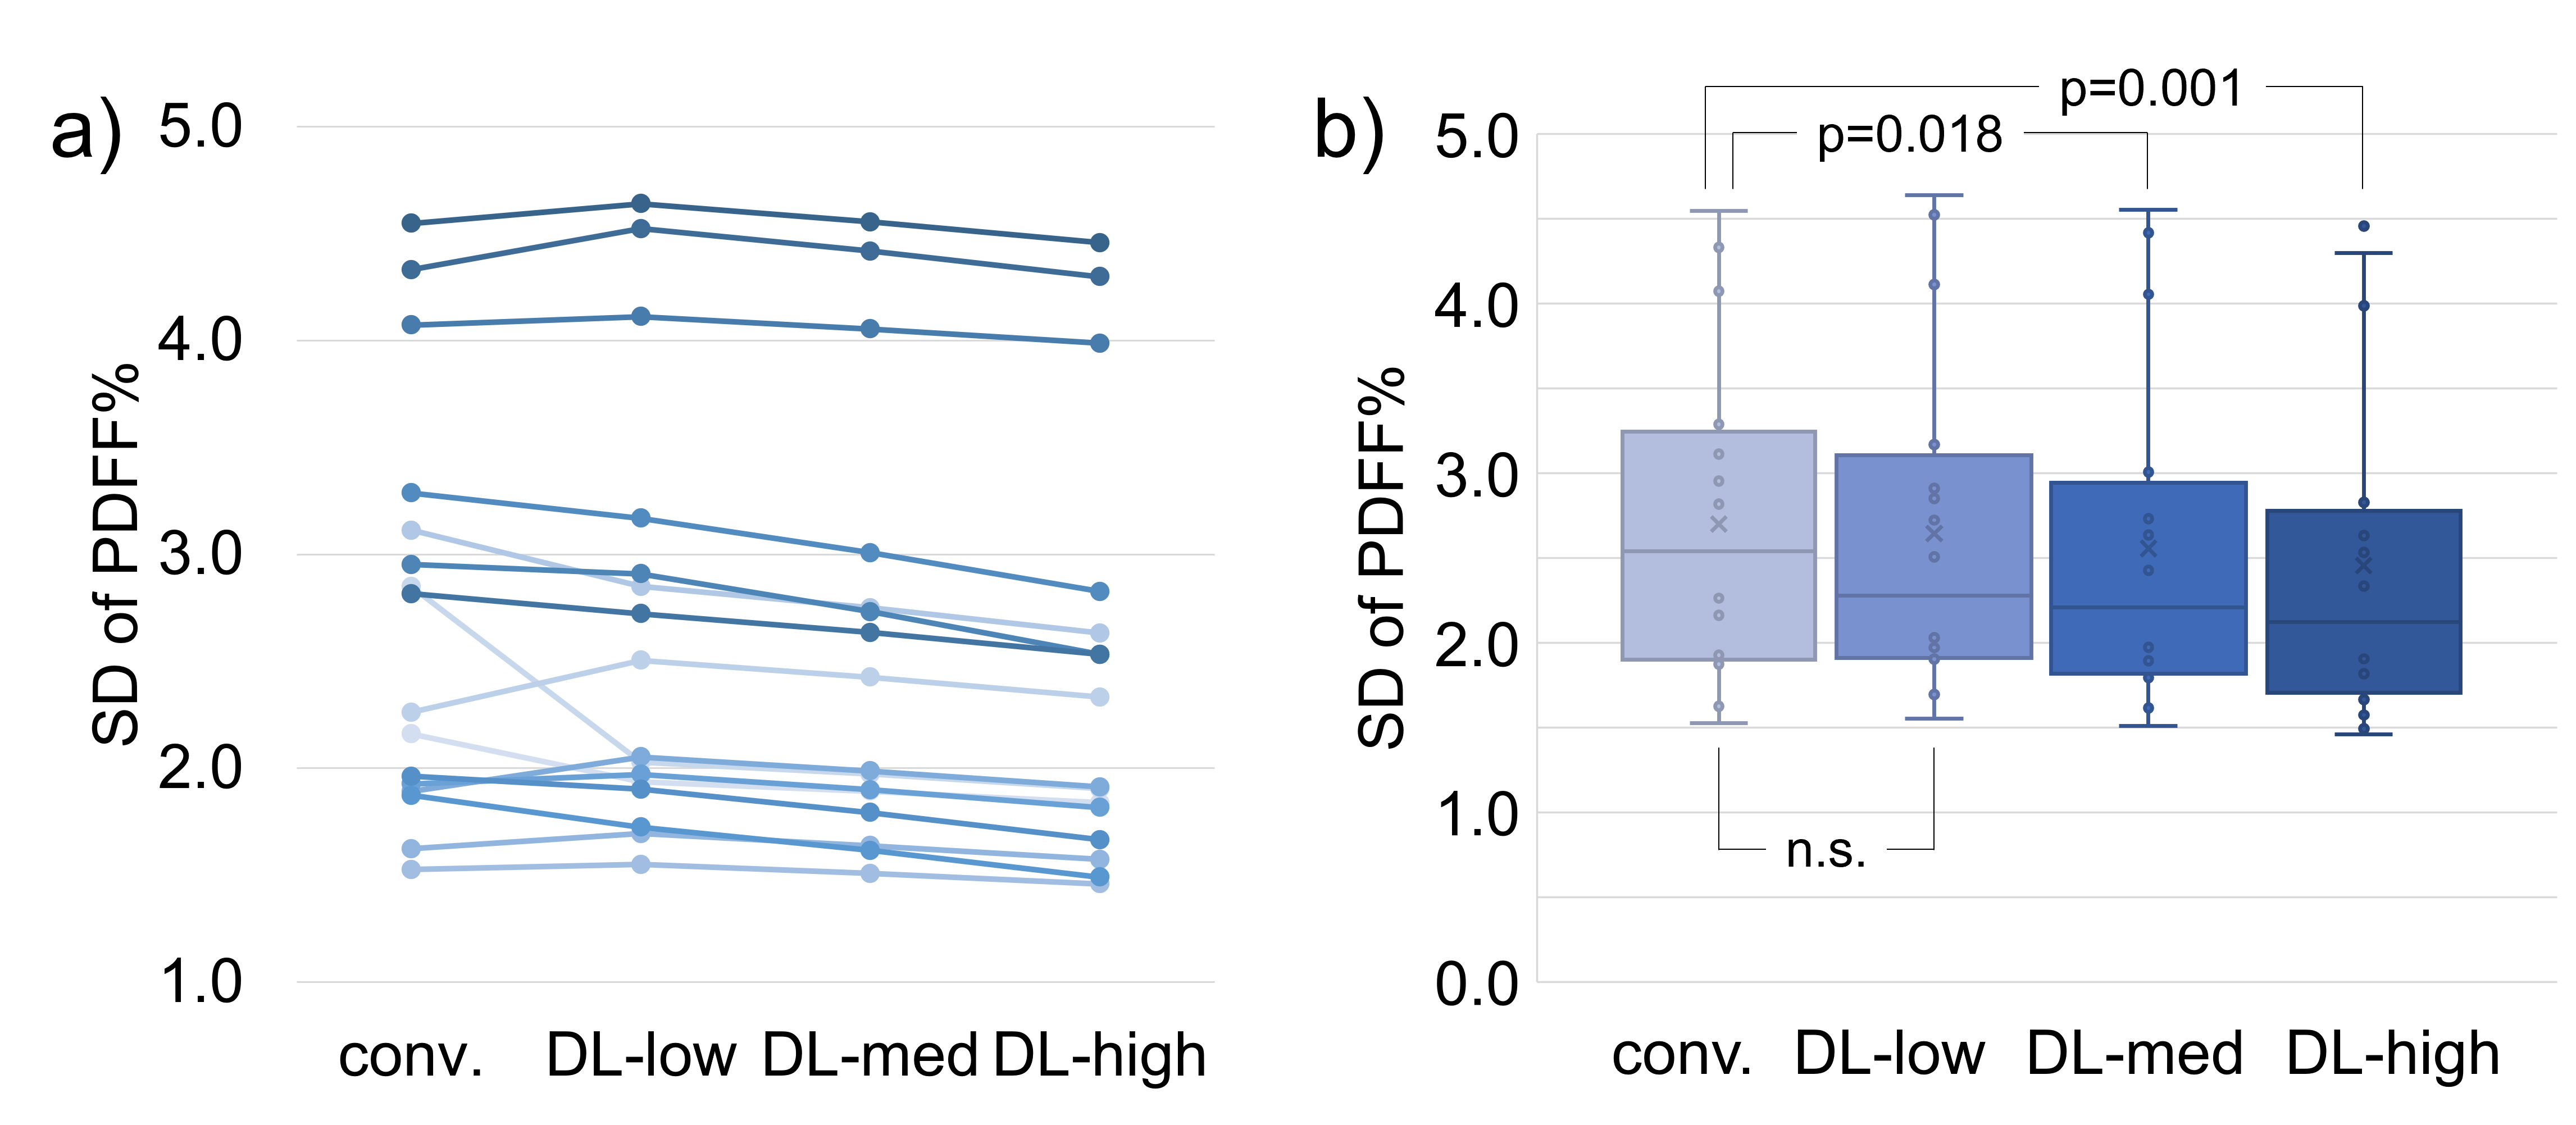
Figure 4: Mean standard deviation of PDFF measurements per patient decreased slightly with increasing deep learning reconstruction settings. This decrease was statistically significant in the group-wise paired t-test analysis performed between conventional reconstruction (conv.) and the medium and high denoising settings of the DL-based reconstruction (DL-med and DL-high). a) Each line represents one acquisition with differing reconstruction settings. b) The diagram shows the aggregate standard deviation for each reconstruction pipeline.