1853
Evaluation of Confounding Influence of Fat on Hepatic Quantitative Parametric Mapping1Radiology, Cincinnati Children's Hospital Medical Center, Cincinnati, OH, United States, 2Radiology, University of Cincinnati College of Medicine, Cincinnati, OH, United States
Synopsis
Keywords: Liver, Quantitative Imaging, Relaxometry
Quantitative parametric mapping is an increasingly important tool for non-invasive assessment of liver disease. The extent of change in both water and fat content in the liver is dependent on the type and stage of the disease. Thus, proton density fat fraction (PDFF%) can have a confounding influence on the longitudinal change in estimated hepatic T1, T2, and T2* measurements. In 14 research participants, T1 was proportionately underestimated (4.70 (2.85, 6.54) ms/PDFF%) and T2 was proportionately overestimated (-0.60 (-0.76, -0.43) ms/PDFF%) with non-fat-suppressed parametric map compared to analogous estimates with fat-suppressed parametric maps, while T2* estimates were insensitive to PDFF.INTRODUCTION
MR relaxometry or parameter mapping provides unique data relevant to the non-invasive evaluation and longitudinal monitoring of chronic conditions in liver including in the setting of non-alcoholic fatty liver disease in children[1-3]. Hepatic relaxation parameters are predominantly composed of water and fat components which have distinctly different T1 and T2 values. Proton density fat fraction (PDFF %) changes with progression of the liver disease [4], this change in liver fat component confounds the longitudinal change in relaxation parameters [5]. Recently, the chemical shift encoded imaging with variable flip-angle multi-echo gradient echo sequences has been proposed to estimate the T1 value of the water component (water-specific T1) to address the interference of fat signal to the T1 quantification[6-9]. In this study, the confounding influence of PDFF on T1, T2, and T2* estimation for the liver was evaluated using Modified Look-Locker Inversion Recovery (MOLLI, T1 mapping), Gradient Spin Echo (GRASE, T2 mapping), and multiple Gradient Echo (mGRE, T2* mapping) sequences with and without fat suppression.METHODS
Participants with and without known chronic liver disease were prospectively recruited under an IRB- approved, HIPAA-compliant protocol. All imaging was performed on a 1.5T scanner (Ingenia, Philips Healthcare) using a 28-element coil. Research participants underwent liver imaging including six-echo confounder-corrected chemical shift encoded MRI (mDixon Quant®), MOLLI, MOLLI with fat suppression, GRASE, GRASE with fat suppression, mGRE, and mGRE with fat suppression. Imaging parameters for these sequences are provided in Table 1. The liver PDFF, T1 estimates with fat suppression (T1_wFS) and without fat suppression (T1_nFS), T2 estimates with fat suppression (T2_wFS) and without fat suppression (T2_nFS), T2* estimates with fat suppression (T2*_wFS) and without fat suppression (T2*_nFS) were obtained by manually drawing co-localized regions-of-interest (ROIs) in the right hepatic lobe on the scanner-generated parametric maps, avoiding any visible vessels and excluding the liver capsule (The MathWorks™ Inc., Natick, MA, USA). The obtained relaxation estimates were analyzed using Pearson’s correlation coefficients (r), student’s t-tests (2-sided), and Bland-Altman analyses. The relationship between PDFF and the difference in relaxation times of T1, T2, and T2* estimates due to fat suppression was evaluated using linear regression.RESULTS
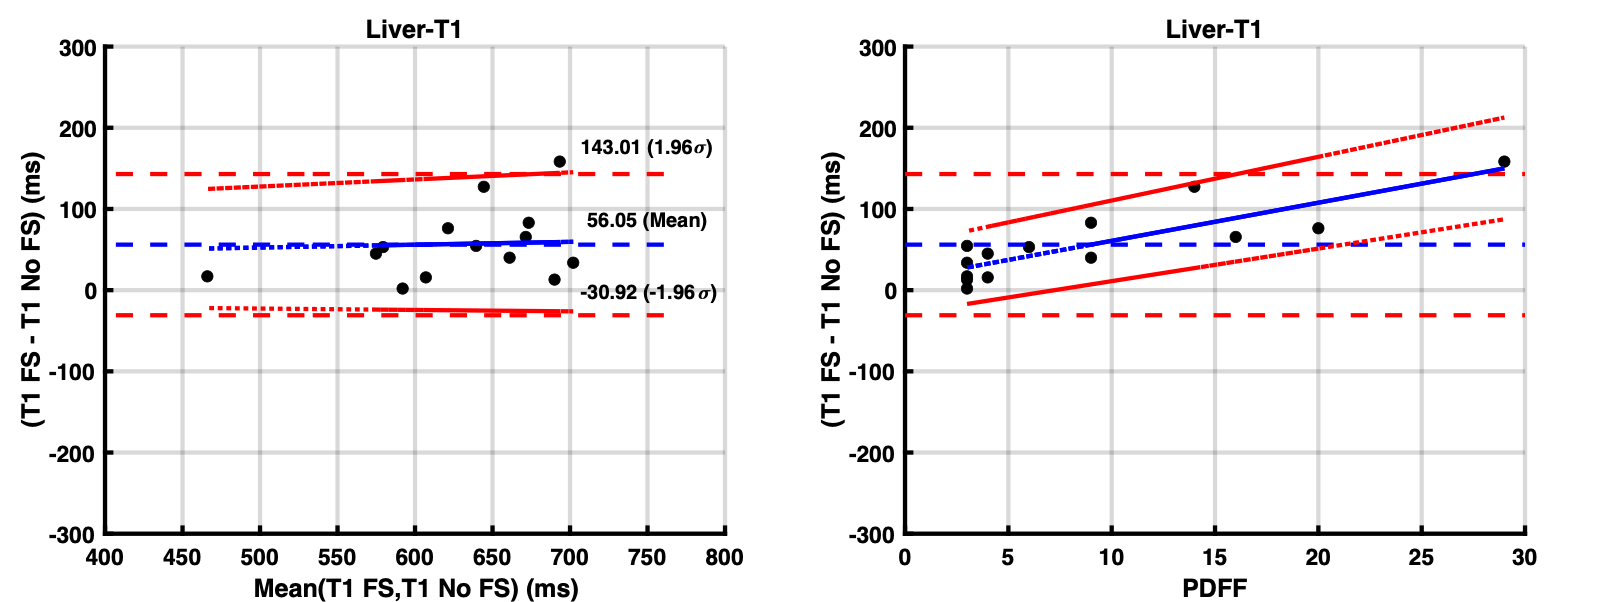
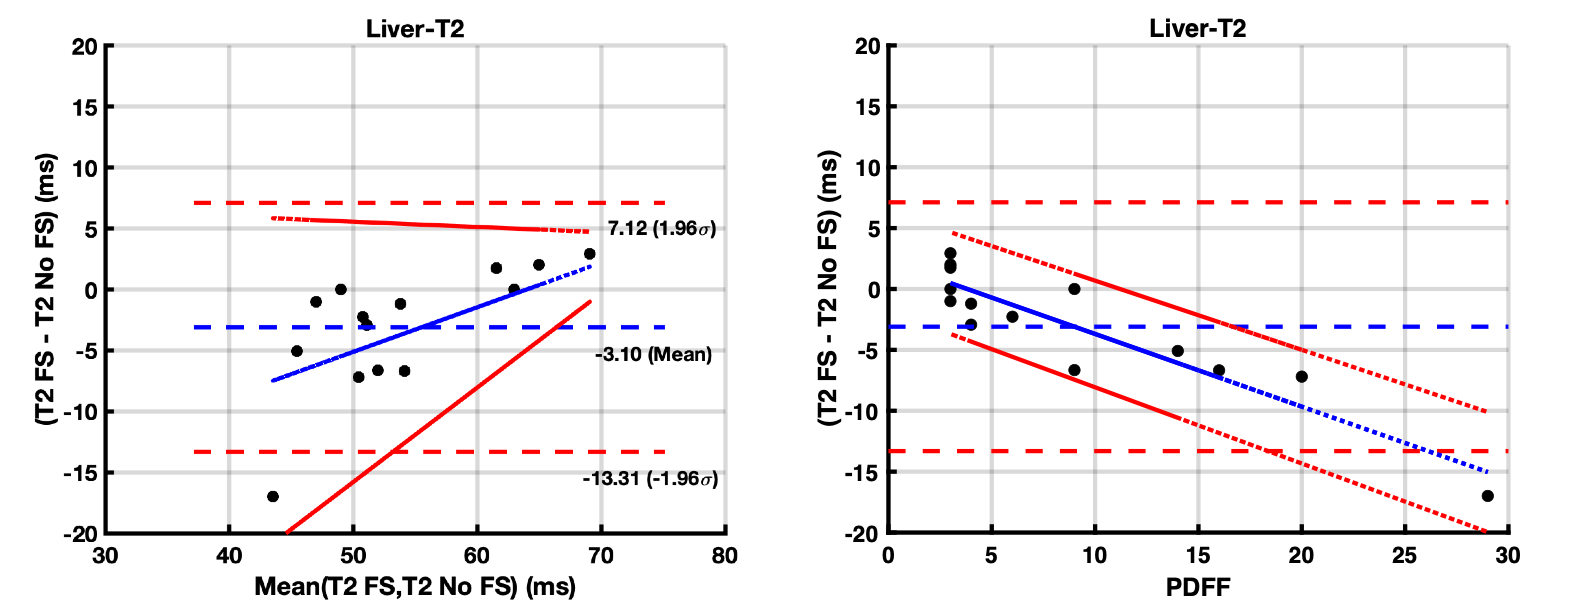
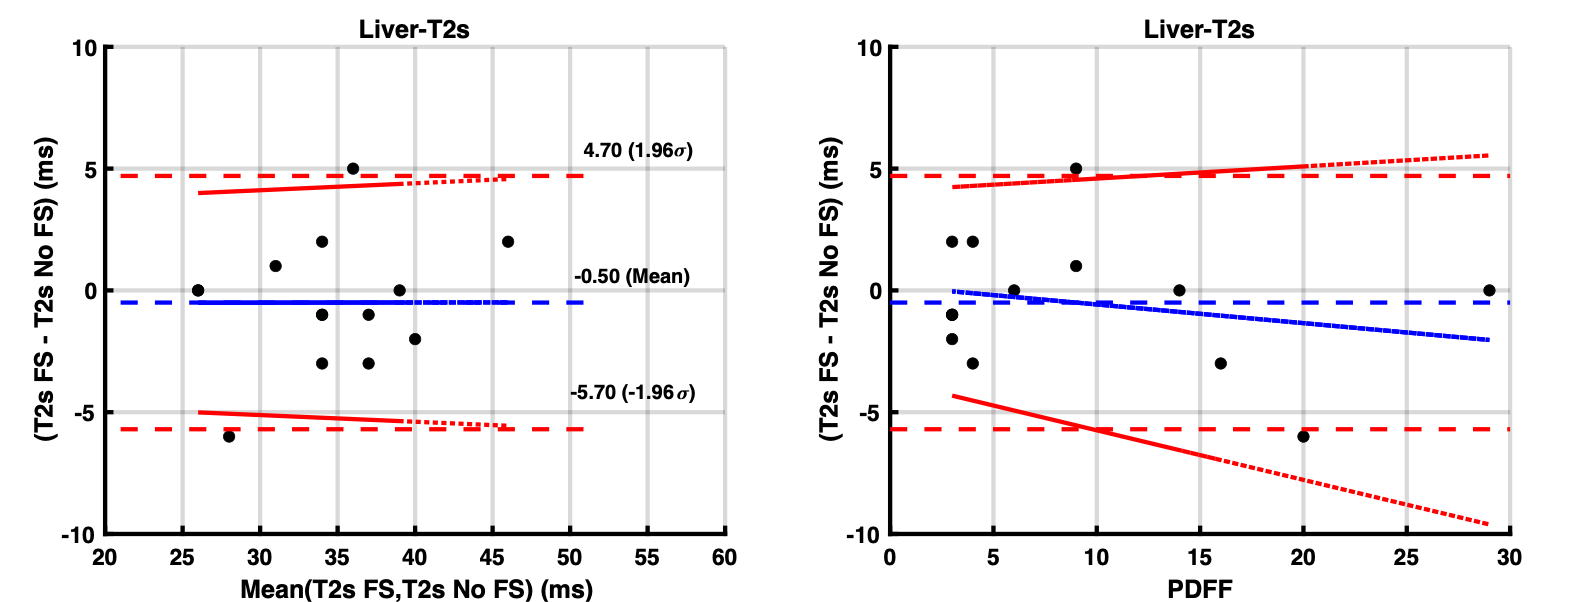
The 14 study participants ranged from 9-25 years old (mean age: 18.4 years; 5 males) and PDFF ranged from 3-29% (mean PDFF: 9%). There was a strong correlation (r = 0.75) between T1_wFS and T1_nFS values. The T1_nFS (574 ms ± 24 ms) estimates were significantly (p = 0.003) shorter than T1_wFS (630 ms ± 26 ms) estimates with a mean bias of 56 ms (95% Limits of Agreement (LoA): -31 to 143 ms) (Figure 1A). There was a significant (p = 0.0001) proportional bias (4.70 (2.85, 6.54) ms/PDFF%) between T1_wFS and T1_nFS values dependent on PDFF (Figure 1B). Similarly, there was a strong correlation (r = 0.74) between T2_wFS and T2_nFS values. The T2_nFS (57 ms ± 2 ms) estimates were significantly (p = 0.04) longer than T2_wFS (54 ms ± 2 ms) estimates with a mean bias of -7 ms (LoA: 7 to -13 ms) (Figure 2A). There was a significant (p < 0.0001) proportional bias (-0.60 (-0.76, -0.43) ms/PDFF%) between T2_wFS and T2_nFS values dependent on PDFF (Figure 2B). In the case of T2* values, there was a very strong correlation (r = 0.84) between T2*_wFS and T2*_nFS values. The T2*_nFS (35 ms ± 2 ms) estimates were comparable (p = 0.49) to T2*_wFS (34 ms ± 2 ms) estimates with a very small mean bias of -0.5 ms (LoA: 5 to -6 ms) (Figure 3A). The proportional bias between T2*_wFS and T2*_nFS values dependent on PDFF was very not statistically significant (p = 0.42) (Figure 3B).DISCUSSION
There is a proportionate underestimation of liver T1 with increasing PDFF (4.70 (2.85, 6.54) ms/PDFF%) when estimated using non-fat-suppressed MOLLI compared to fat-suppressed MOLLI. There is some proportionate overestimation of liver T2 values with increasing PDFF (-0.60 (-0.76, -0.43) ms/PDFF%) when estimated using non-fat-suppressed GRASE compared to fat-suppressed GRASE. This confounding influence of fat on liver T1 and T2 estimation can potentially be corrected to estimate water-specific T1 and T2 in patients with liver disease. T2* estimates were not sensitive to PDFF.Acknowledgements
No acknowledgement found.References
1. Banerjee, R., et al., Multiparametric magnetic resonance for the non-invasive diagnosis of liver disease. J Hepatol, 2014. 60(1): p. 69-77.
2. Hernando, D., et al., Quantification of liver iron with MRI: state of the art and remaining challenges. J Magn Reson Imaging, 2014. 40(5): p. 1003-21.
3. Cassinotto, C., et al., MR relaxometry in chronic liver diseases: Comparison of T1 mapping, T2 mapping, and diffusion-weighted imaging for assessing cirrhosis diagnosis and severity. Eur J Radiol, 2015. 84(8): p. 1459-1465.
4. Dennis, A., et al., Correlations Between MRI Biomarkers PDFF and cT1 With Histopathological Features of Non-Alcoholic Steatohepatitis. Front Endocrinol (Lausanne), 2020. 11: p. 575843.
5. Ahn, J.H., et al., Effect of hepatic steatosis on native T1 mapping of 3T magnetic resonance imaging in the assessment of T1 values for patients with non-alcoholic fatty liver disease. Magn Reson Imaging, 2021. 80: p. 1-8.
6. Mozes, F.E., et al., Mapping tissue water T(1) in the liver using the MOLLI T(1) method in the presence of fat, iron and B(0) inhomogeneity. NMR Biomed, 2019. 32(2): p. e4030.
7. Feng, L., et al., Magnetization-prepared GRASP MRI for rapid 3D T1 mapping and fat/water-separated T1 mapping. Magn Reson Med, 2021. 86(1): p. 97-114.
8. Thompson, R.B., et al., Simultaneous proton density fat-fraction and R2∗ imaging with water-specific T(1) mapping (PROFIT(1) ): application in liver. Magn Reson Med, 2021. 85(1): p. 223-238.
9. Peng, H., et al., Fast multi-parametric imaging in abdomen by B1+ corrected dual-flip angle sequence with interleaved echo acquisition. Magn Reson Med, 2022. 87(5): p. 2194-2208.
Figures
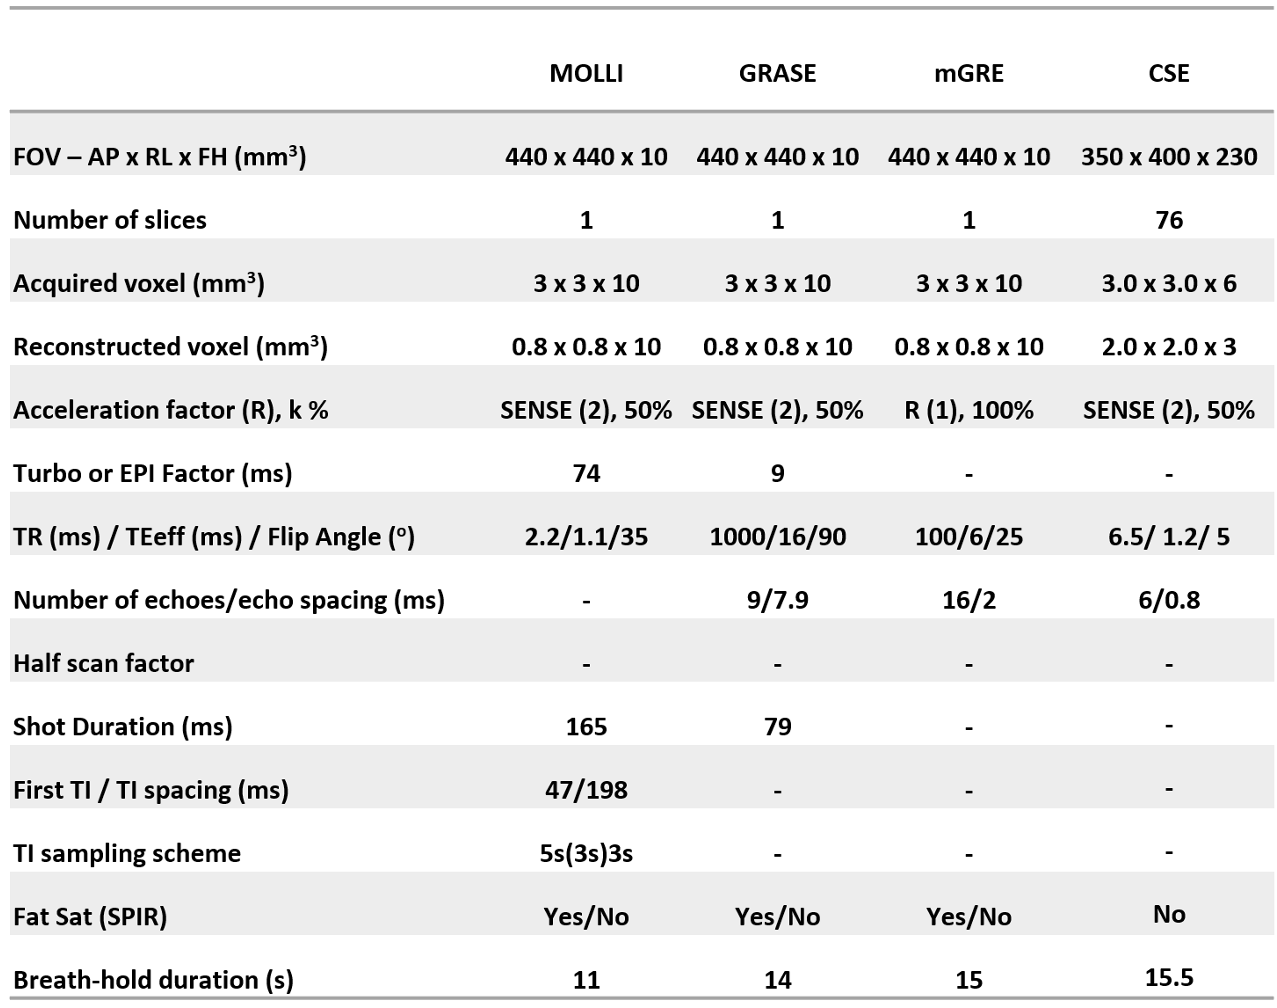
Table 1. Imaging and Pulse Sequence Parameters.
CSE = Chemical shift encoded (mDixon Quant ®; Philips Healthcare) with 6 echoes, Fat Sat (SPIR) = fat saturation with spectral presaturation, MOLLI = Modified Look-Locker Inversion Recovery, GRASE = Gradient Spin Echo, and mGRE = multiple Gradient Echo.