1852
Effect of isocaloric ketogenic diet on fat content in the liver and muscle and volume of adipose tissue
Petr Sedivy1, Barbora Setinova1, Martin Burian1, Dita Pajuelo1, Milan Hajek1, Viktor Sebo2, Michal Koc2, Michaela Siklova2, Marina Henikova2, Eva Krauzova3, Jan Gojda2, Lenka Rossmeislova2, Jan Kovar4, and Monika Dezortova1
1MR-Unit, Institute for Clinical and Experimental Medicine, Prague, Czech Republic, 2Department of Pathophysiology, Third Faculty of Medicine, Charles University, University Hospital Královské Vinohrady, Prague, Czech Republic, 3Department of Internal Medicine, Third Faculty of Medicine, Charles University, University Hospital Královské Vinohrady, Prague, Czech Republic, 4Centre for Experimental Medicine, Institute for Clinical and Experimental Medicine, Prague, Czech Republic
1MR-Unit, Institute for Clinical and Experimental Medicine, Prague, Czech Republic, 2Department of Pathophysiology, Third Faculty of Medicine, Charles University, University Hospital Královské Vinohrady, Prague, Czech Republic, 3Department of Internal Medicine, Third Faculty of Medicine, Charles University, University Hospital Královské Vinohrady, Prague, Czech Republic, 4Centre for Experimental Medicine, Institute for Clinical and Experimental Medicine, Prague, Czech Republic
Synopsis
Keywords: Liver, Metabolism, fat fraction, liver steatosis, intra- and extramyocellular fat, calf muscle
The effect of a 28-day isocaloric ketogenic diet followed by a 2-day carbohydrate realimentation on adipose tissue and fat content in the liver and calf muscle in 22 obese women was studied using MRS and MRI methods. During the ketogenic diet, there was a significant decrease in liver fat volume (69±20 ml, i.e. decrease 43±4% of basal value) and liver fat content (2.7±0.6 %, i.e. 35±5% of basal value) and reduction cross-section in both subcutaneous (6 %) and visceral (7 %) fat. Contrary, the intramyocellular fat increased during the diet.INTRODUCTION
The ketogenic diet (KD) has been extensively studied in the context of metabolic health. KD effectively reduces not only adipose tissue [1] but also hepatic steatosis [2]. However, most studies with KD have been conducted with reduced caloric intake, therefore it is not clear yet whether reduction of volume of adipose tissue and lipid content in the liver and muscle is due to ketosis induction or to low caloric intake.METHODS
Twenty-two obese women (age = 36.5±1.2 years, BMI = 36.4±0.74 kg/m2) underwent 28 days of isocaloric KD (<50 g carbohydrates/day, i.e. 6-12% of daily intake). The KD diet was provided by a delivery food service and caloric intake was calculated individually for each woman. The KD was followed by 48h of isocaloric high carbohydrate refeeding (60-65% of daily intake).All women underwent three MR sessions on 3T MR system VIDA (Siemens Healthineers, Germany) - before diet (baseline), on the last day of KD, and on the day of the end of realimentation. The MR examination consisted of MRI and MRS of the liver and calf muscle and MR volumetry of adipose tissue. The study was conducted in compliance with the principles of the Declaration of Helsinki and with the approval of local ethics committee.
Hepatic fat evaluation
Hepatic fat fraction (FF) was measured by LiverLab engine consisted of T1 VIBE e-Dixon and single voxel spectroscopic technique HISTO (STEAM sequence with parameters: TR = 3000 ms, 5 spectra during one breath-hold with TE = 12, 24, 36, 48, and 72 ms, voxel size 40x30x25 mm). Automatic and manual shimming were combined to reach water line width below 50 Hz. Volume of interest position in liver segments V/VIII was carefully controlled during follow-up examinations.
To calculate hepatic fat volume (HFV), the hepatic FF value from the HISTO protocol was first recalculated to the hepatic fat content (HFC) according to Longo [3] and then HFC was multiplied by total liver volume (TLV). The TLV value was obtained from the automatic segmentation routine which processes images from e-Dixon VIBE sequence.
Intra- and extramyocellular fat in the calf muscle and MRI volumetry fat tissue
Spectra from m. tibialis anterior (STEAM, TE=20, 33, 50, 68, 80, 100, 135,180, 270; 20 acquisitions, VOI=15x15x25 mm, see Figure 1) were processed by LCModel and integral values of water and extra/intra-myocellular lipids (EMCL/IMCL) were corrected for T2 relaxation times using custom script in MATLAB.
MRI volumetry of visceral and subcutaneous fat was performed from one HASTE image (5 mm slice thickness) measured at the level of the 3rd lumbar vertebra by manual segmentation in ITK-SNAP software.
Statistical evaluation
Results were statistically evaluated by one-way repeated measures ANOVA and Sidak’s multiple comparison test. P value <0.05 was considered statistically significant.
RESULTS
After the KD, the volume of visceral adipose tissue decreased by 7% (p=0.005), that of subcutaneous adipose tissue by 6% (p<0.001) and also volume of muscle decreased by 3% (p=0.002). HFC, TLV and HFV also decreased significantly during KD (ΔHFC = -2.7±0.6%, p<0.001; ΔTLV = -223±27 ml, p<0.0001; and ΔHFV = -69±20 ml, p<0.001, respectively). Both HFC and HFV values remained reduced after realimentation (see Table 1) but TLV increased by 105±21 ml (p<0.001). In 10 women who had hepatic steatosis (above 5% HFC), the decrease in liver steatosis was more pronounced (ΔHFC = 4.8±1.1% and ΔHFV = 132±34 ml) compared to those with normal liver fat (ΔHFC = 0.9±0.3% and ΔHFV = 16±4 ml). The total amount of lipids deposited in the muscle increased only slightly (increase in fat fraction by 0.34±0.15%, p=0.02) after KD. A more detailed analysis of the MR spectra showed that this increase resulted mainly due to an intramyocellular component (see Table 1).DISCUSSION
In our group of obese women, the administration of isocaloric KD resulted in reduction of visceral and subcutaneous adipose tissue and a decrease in hepatic fat content. The decrease and then subsequent increase in liver volume during realimentation can be explained by a decrease in lipid volume (significant decrease in HFV during KD) and, more importantly, by changes in hepatic glycogen, which was likely to be diminished on KD and resynthesized after realimentation with carbohydrates. Excessive release of lipids from adipose tissue and liver probably causes an adverse increase in IMCL during KD.CONCLUSION
In our interventional metabolic study we demonstrated a positive metabolic effect of ketosis induction on adipose and hepatic tissue in obese women. Importantly, the results are not biased by a reduction in caloric intake that is common in other ketogenic diet trials.Acknowledgements
Supported by Ministry of Health of the Czech Republic, grant numbers: NU20J-01-00005 and DRO („Institute for Clinical and Experimental Medicine – IKEM, IN 00023001“).References
1. Dyson PA. J Hum Nutr Diet 2008;21(6):530-538. doi: 10.1111/j.1365-277X.2008.00896.x.
2. Watanabe M, et al. Obes Rev 2020;21(8):e13024. doi: 10.1111/obr.13024.
3. Longo R, et al. J Magn Reson Imaging 1995;5(3):281-285. doi: 10.1002/jmri.1880050311.
Figures
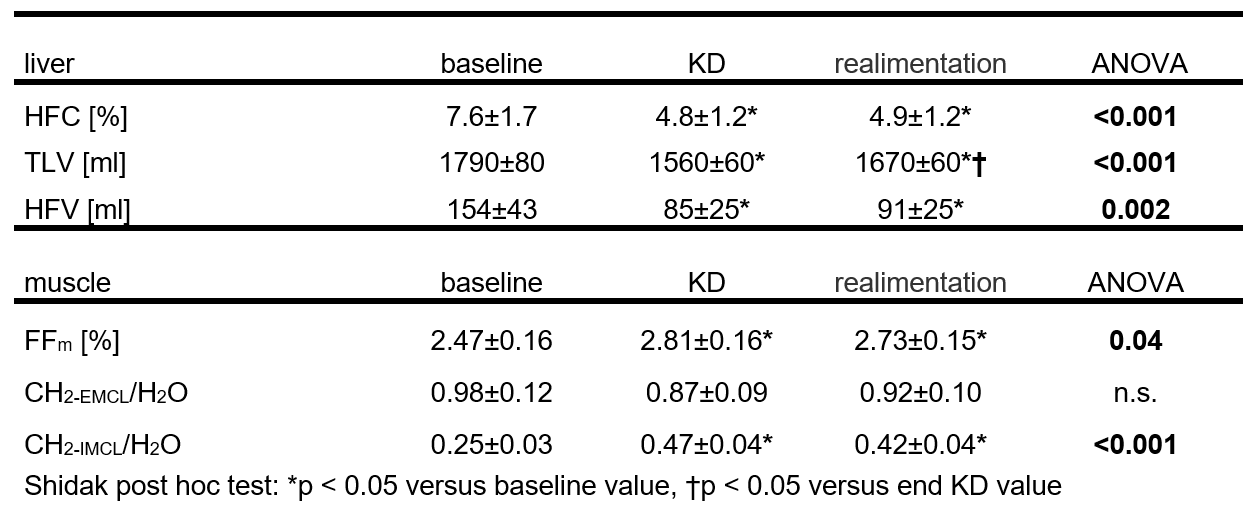
Table 1.
Values (mean ± standard error of the mean) of hepatic fat content (HFC), total liver volume (TLV), hepatic fat volume (HFV)
and fat fraction (FFm) of lipids in the m. tibialis anterior (total
lipid fraction and ratio of CH2 group signal from extramyocellular
(CH2-EMCL) and intramyocellular (CH2-IMCL)
lipids to water signal from the voxel) before ketogenic diet (baseline), at the
end of KD a after realimentation.
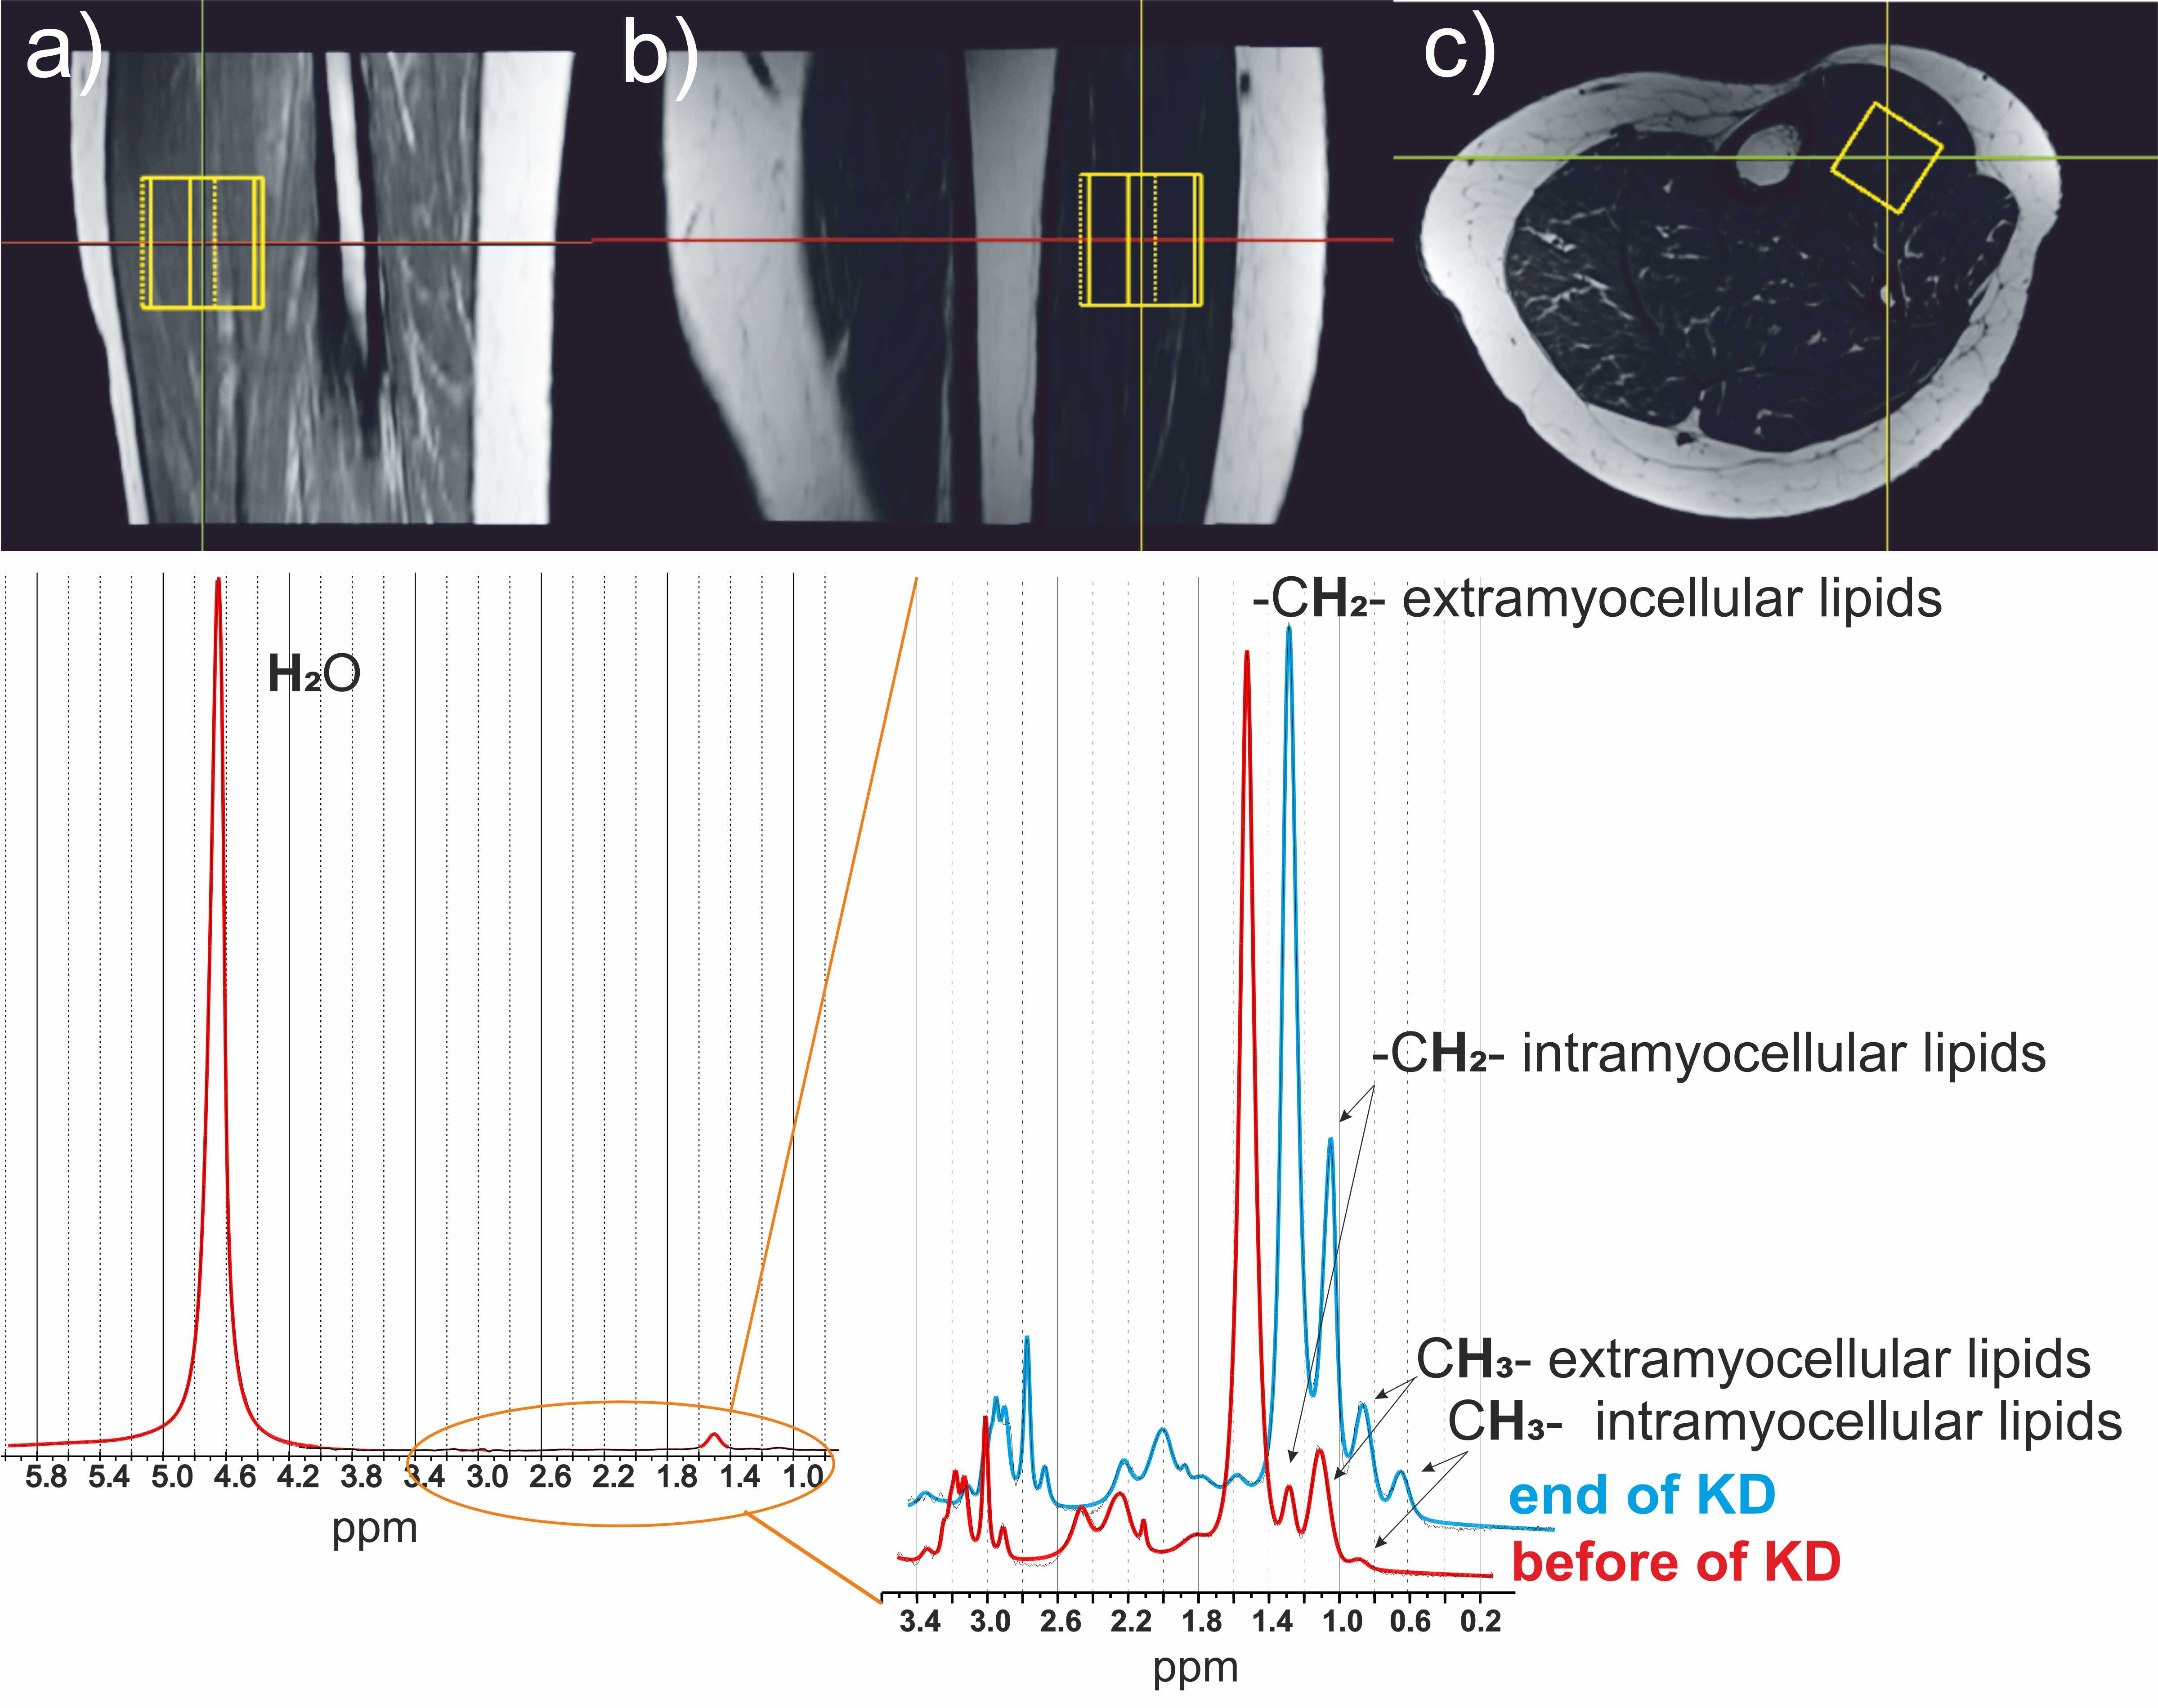
Figure 1. MR images of the
calf muscle in sagittal (a), coronal (b) and axial (c) plane with the position
of the measured voxel. An example of 1H MR spectrum of a calf muscle
(fat fraction 2%) with detail of the region between 3.4-0.2 ppm from the MR
spectrum with the suppress water signal before and after KD.
DOI: https://doi.org/10.58530/2023/1852