1851
Detecting Hepatic Flexibility in patients with Non-Alcoholic Fatty Liver Disease (NAFLD) using 1H Magnetic Resonance Spectroscopy1University of Oxford, Oxford, United Kingdom
Synopsis
Keywords: Liver, Liver, L-carnitine, acetylcarnitine
This study investigated serum carnitine species and in-vivo hepatic acetylcarnitine levels as measured with MRS in healthy volunteers, and patients with low-risk NAFLD and high-risk NAFLD. L-carnitine facilitates transport of fatty acids into the mitochondria. We show that a single injection of L-carnitine modulated acetylcarnitine levels in the liver in healthy volunteers and low-risk NAFLD, but that this mechanism was blunted in the high-risk NAFLD group. This was accompanied by changed serum medium-chain and long-chain carnitine species, but only in the high-risk NAFLD group. Further studies are needed to understand the plasma and hepatic metabolic changes of carnitine species.Introduction
The global prevalence of Non-alcoholic fatty liver disease (NAFLD) is 25% [1]. Patients with NAFLD have disturbed fatty acid (FA) metabolism. Free L-carnitine is critical for the transportation of FA to the mitochondria, but also for the modulation of intracellular acetyl-CoA/CoA ratio, controlling the balance between carbohydrate and FA oxidation (FAO). Acylcarnitine species are intermediates of FAO. Plasma acylcarnitine species (except acetylcarnitine(AC) and free L-carnitine) are elevated in patients with NAFLD and are associated with disease progression[2]. Treatments with L-carnitine have shown improved outcomes in NAFLD[3], but more studies are needed to understand tissue and plasma levels of AC and free L-carnitine. Muscle AC has been quantified previously[4], and we have also shown that liver AC can be quantified non-invasively using long echo time 1H-MRS in healthy volunteers[5]. The aim of this study was to establish hepatic acetylcarnitine levels in vivo using 1H-MRS and investigate serum carnitine species and sub-lipid species in healthy volunteers as well as low-risk and high-risk NAFLD.Methods
Eleven patients with low-risk NAFLD, six patients with high-risk NAFLD and ten healthy volunteers with no history of liver disease attended a research visit after an overnight fast. Baseline cardiac and liver 1H-MRS & MRI was acquired on a 3T imager (Prisma, Siemens Healthineers) using a 30-channel phased array coil and a spine coil. Proton-density fat fraction(PDFF) was quantified using a multi-echo spoiled GRE sequence (TEmin=1.1ms, DTE=1.1ms). Liver AC was quantified using a STEAM acquisition (64 averages, TE=90ms, TR=4s, voxel size: 30×30×30mm3) allowing for free breathing, and lipid species[6] were measured using a breath-held STEAM acquisition in both the heart and the liver (TE=10ms, TR=2s for water-suppressed spectra and TR=4s for non-water suppressed spectra, voxel size:20x20x20mm3). Following baseline MRI, all subjects were given intravenous injection of 50mg/kg body weight L-carnitine (Carnitor, Alfasigma, Italy) and two hours post-supplementation the MRI protocol was repeated (Figure 1). The OXSA toolbox in Matlab[7] was used to fit all spectral peaks. Hepatic and cardiac spectra were frequency-aligned (using the residual water signal), phased, and averaged before fitting with the OXSA toolbox. Blood samples were acquired at baseline (T0) and 3 hours (T3) after L-carnitine supplementation. Serum was analysed using standard laboratory methods(c16000 analyser) for biomarkers, while serum carnitine species were measured using a tandem mass spectrometer.Results
Results were obtained from low-risk NAFLD (n=11, age=50±17yrs, BMI=33±5kg/m2), from high-risk NAFLD (n=6, age=62±6yr, BMI=40±5kg/m2) and from ten volunteers (n=10, age=33±9yr, BMI=23±2kg/m2). Baseline Insulin resistance was higher in the NAFLD groups, while L-carnitine supplementation could improve HOMA-IR in both volunteers and both groups of NAFLD. TAG was elevated in the low-risk NAFLD compared to healthy volunteers but could not be changed with L-carnitine supplementation, although TAG was reduced in healthy volunteers following a single injection of L-carnitine (Figure 2).Serum carnitine species were measured at baseline, and medium-chain carnitine species were elevated in the low-risk NAFLD group (0.77±0.49 mmol/l, p = 0.03) and high-risk NAFLD group (0.88±0.28mmol/l, p =0.002) compared to healthy volunteers (0.36±0.23 mmol/l). Even though serum acetylcarnitine levels were not different between the groups at baseline, hepatic acetylcarnitine levels as measured with 1H-MRS were higher in the high-risk NAFLD group (0.63±0.56%, p = 0.005) compared to the healthy volunteers (0.053±0.035%). Following L-carnitine supplementation hepatic 1H-MRS revealed elevated acetylcarnitine levels in healthy volunteers (86% increase, p=0.04) and in low-risk NAFLD (268% increase, p =0.04), but there was no significant change in the high-risk NAFLD group (-24%, p=0.6). L-carnitine supplementation elevated serum free carnitine levels, serum acetylcarnitine levels, and serum short-chain carnitine species. L-carnitine could only elevate serum medium-chain carnitine species (50%, p =0.04) and serum long-chain carnitine species (75%, p=0.002) in high-risk NAFLD compared to healthy volunteers.
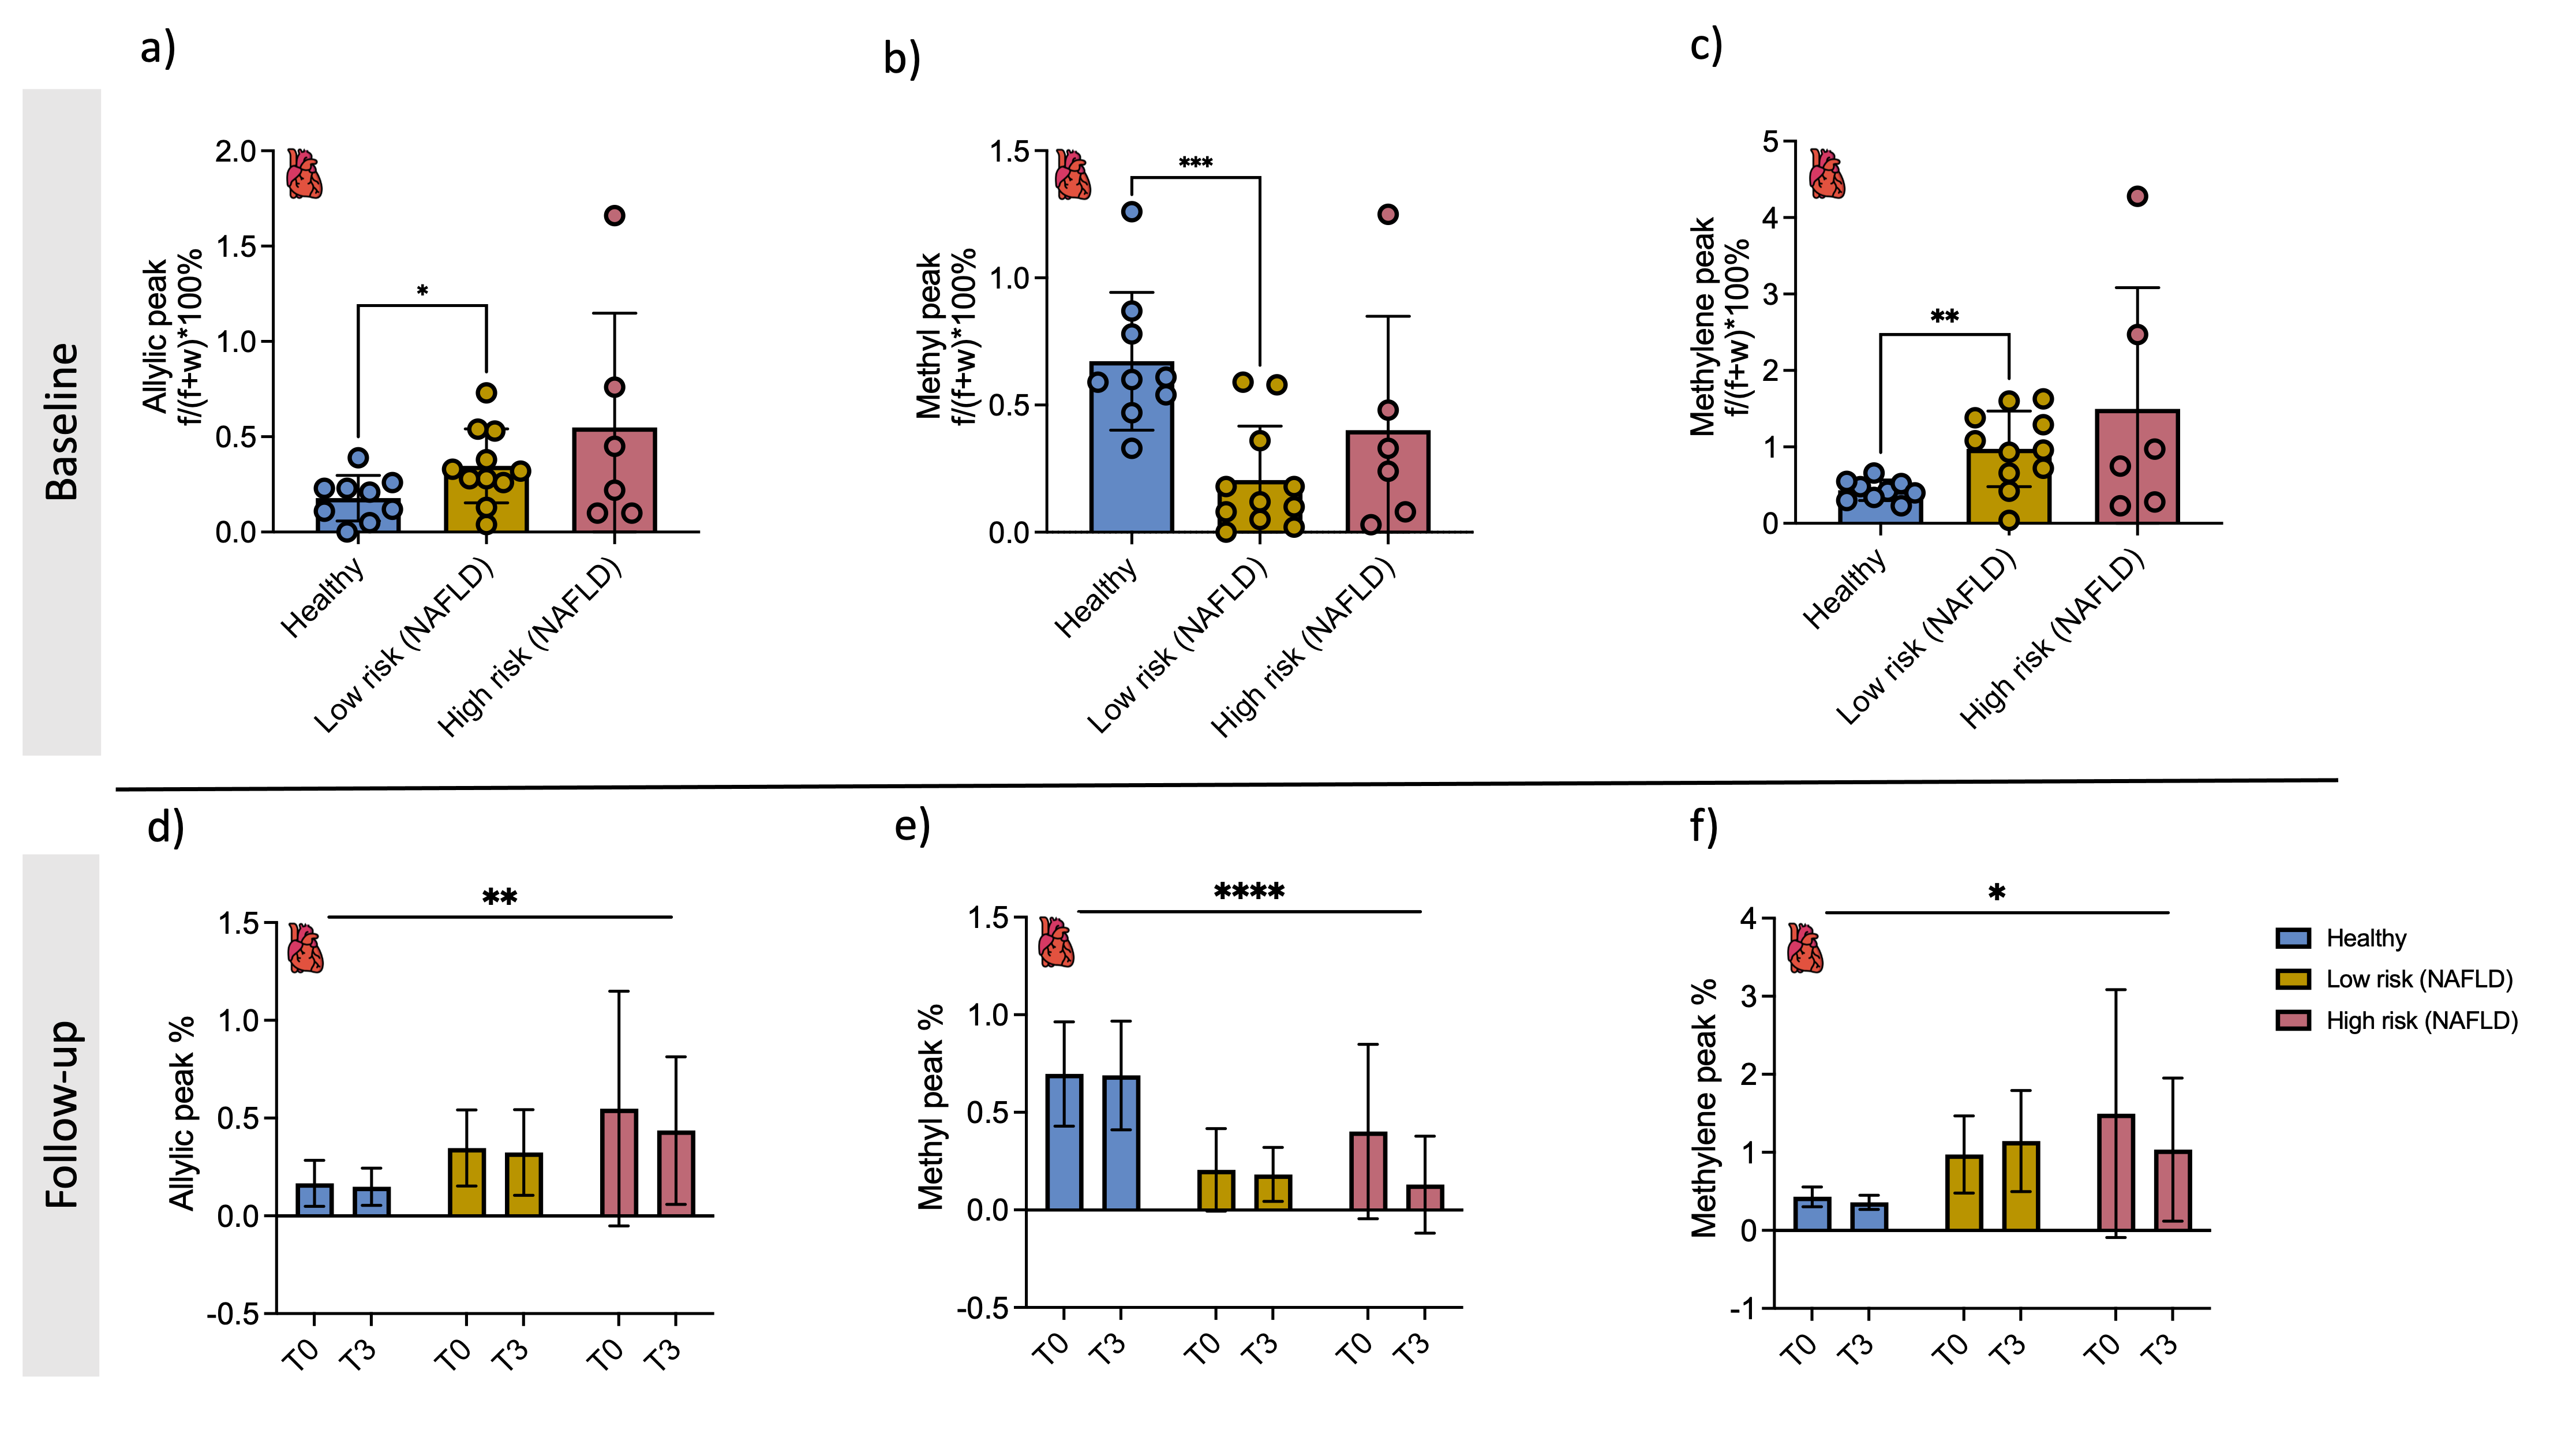
Hepatic sub-lipid species were higher in both low-risk NAFLD and high-risk NAFLD groups compared to healthy volunteers and were not changed with L-carnitine supplementation (Figure 4). Cardiac sub-lipids were not different between healthy volunteers and the high-risk NAFLD group. Allyl and methylene were significantly higher in low-risk NAFLD compared to healthy volunteers, but methyl peak was significantly lower in the low-risk NAFLD group (0.21±0.21%, p =0.0004) compared to the healthy volunteers (0.67±0.27%). Cardiac sub-lipid species could also not be altered with L-carnitine supplementation (Figure 5).
Discussion and Conclusion
Previous data have shown that NAFLD patients have elevated carnitine species [2], our study showed that only the medium-chain carnitine species were elevated in the two NAFLD groups, no other carnitine species could be distinguished at baseline using serum markers. Serum acetylcarnitine levels were not changed at baseline, but when measured in-vivo using MRS, the high-risk NAFLD group had significantly elevated hepatic acetylcarnitine levels. Following a single injection of L-carnitine, several of the serum carnitine species were elevated, but the in-vivo hepatic acetylcarnitine levels only increased following an L-carnitine injection in healthy volunteers and low-risk NAFLD, this mechanism was blunted in the high-risk NAFLD group. We demonstrate an association between NAFLD disease severity and hepatic acetylcarnitine levels both at baseline and after intravenous injection of L-carnitine. This can be relevant in studies using L-carnitine as part of the therapeutic intervention, firstly to identify those with low levels of hepatic acetylcarnitine who may benefit more from supplementation and secondly as a means of monitoring response to treatment.Acknowledgements
This study was funded by Novo Nordisk Fellowship (DS) and by a grant awarded to DS (Oxfordshire Health Services Research reference: 2019/1333). LV is supported by a Sir Henry Dale Fellowship of the Wellcome Trust and the Royal Society [#221805/Z/20/Z] and would also like to acknowledge the support of the Slovak Grant Agencies VEGA [2/0003/20] and APVV [#19–0032]. Furthermore, we would like to the support of mentor Dr. Mette Skalshøj Kjær for her expertise on liver metabolism, and Dr. Gabrielle Allen, Professor Timothy James, and Dr. Claire Hart (NHS) for their support and help with serum analysis. MP is supported by the Oxford NIHR Biomedical Research Centre.References
[1] Z. M. Younossi, A. B. Koenig, D. Abdelatif, Y. Fazel, L. Henry, and M. Wymer, “Global epidemiology of nonalcoholic fatty liver disease—Meta-analytic assessment of prevalence, incidence, and outcomes,” Hepatology, vol. 64, no. 1, pp. 73–84, Jul. 2016, doi: 10.1002/HEP.28431.
[2] K. Enooku et al., “Altered serum acylcarnitine profile is associated with the status of nonalcoholic fatty liver disease (NAFLD) and NAFLD-related hepatocellular carcinoma,” Scientific Reports 2019 9:1, vol. 9, no. 1, pp. 1–9, Jul. 2019, doi: 10.1038/s41598-019-47216-2.
[3] M. Malaguarnera et al., “L-Carnitine Supplementation to Diet: A New Tool in Treatment of Nonalcoholic Steatohepatitis—A Randomized and Controlled Clinical Trial,” American Journal of Gastroenterology, vol. 105, no. 6, pp. 1338–1345, Jun. 2010, doi: 10.1038/ajg.2009.719.
[4] R. Klepochová et al., “Detection and Alterations of Acetylcarnitine in Human Skeletal Muscles by 1H MRS at 7 T,” Invest Radiol, vol. 52, no. 7, p. 412, 2017, doi: 10.1097/RLI.0000000000000355.
[5] D. Savic et al., “ L-carnitine Supplementation used as a Tool for Detecting Hepatic Flexibility of Acetylcarnitine using 1H Magnetic Resonance Spectroscopy,” London, 2022. Accessed: Nov. 09, 2022. [Online]. Available: https://submissions.mirasmart.com/ISMRM2022/Itinerary/ConferenceMatrixEventDetail.aspx?ses=D-96
[6] R. Banerjee et al., “Multiparametric magnetic resonance for the non-invasive diagnosis of liver disease,” J Hepatol, vol. 60, no. 1, pp. 69–77, Jan. 2014, doi: 10.1016/J.JHEP.2013.09.002.
[7] L. A. B. Purvis, W. T. Clarke, L. Biasiolli, L. Valkovič, M. D. Robson, and C. T. Rodgers, “OXSA: An open-source magnetic resonance spectroscopy analysis toolbox in MATLAB,” PLoS One, vol. 12, no. 9, p. e0185356, Sep. 2017, doi: 10.1371/journal.pone.0185356.
Figures