1850
Quantitative Digital Histological Analysis and Comparison to Proton Density Fat Fraction in Patients Undergoing Weight Loss Surgery1Surgery, University of Wisconsin - Madison, Madison, WI, United States, 2Radiology, University of Wisconsin - Madison, Madison, WI, United States, 3Radiology, Liver Imaging Group, University of California San Diego, La Jolla, CA, United States, 4Medicine, University of California San Diego, La Jolla, CA, United States, 5Pathology, University of Wisconsin - Madison, Madison, WI, United States, 6Surgery, University of California San Diego, La Jolla, CA, United States, 7Emergency Medicine, University of Wisconsin - Madison, Madison, WI, United States, 8Medicine, University of Wisconsin - Madison, Madison, WI, United States, 9Biomedical Engineering, University of Wisconsin - Madison, Madison, WI, United States, 10Medical Physics, University of Wisconsin - Madison, Madison, WI, United States
Synopsis
Keywords: Liver, Fat
The goal of our study was to correlate quantitative digital microscopic histological markers of hepatic steatosis with MRI-PDFF and demonstrate that microenvironment characterization can be used to evaluate hepatic microstructure in NAFLD for future MRI-based studies. Patients were recruited to undergo weight loss surgery during which a liver biopsy was performed. The biopsies were analyzed for steatosis proportionate area (SPA) and characterization of fat droplets. The SPA strongly correlated to the pathologist grading and MRI-PDFF and the liver fat content strongly correlated with the number of fat droplets. Our work demonstrated the feasibility of using MRI to characterize liver microstructure.
Introduction
Nonalcoholic fatty liver disease (NAFLD) is the most common liver disorder in Western industrialized countries. Abnormal accumulation of intracellular vacuoles of fat (hepatic steatosis), is the earliest and hallmark feature of NAFLD.1 In some patients, isolated steatosis may progress to hepatocyte injury and inflammation (non-alcoholic steatohepatitis or “NASH”) and eventually cirrhosis.2Liver biopsy has been the reference standard but is invasive with high sampling variability.3 Therefore, non-invasive modalities were developed to diagnosis and monitor hepatic steatosis.4 MRI has emerged as a safe alternative to liver biopsies for some contexts.5 Specifically, MRI-estimated proton density fat fraction (MRI-PDFF) has been shown to be an accurate and precise imaging biomarker of liver fat content in patients with NAFLD.6 The purpose of this study was to correlate quantitative digital microscopic histological markers of hepatic steatosis with MRI-PDFF from patients undergoing weight loss surgery. Further, we aimed to demonstrate the feasibility of quantitative digital histological analysis to characterize fat droplets, necessary for future MRI-based studies aimed at evaluating hepatic microstructure in NAFLD.
Methods
Subjects: Subjects scheduled to undergo weight loss surgery (WLS) were recruited from two centers (University of Wisconsin, University of California San Diego). Exclusion criteria included contraindications to MRI and pre-existing liver disease other than NAFLD. Age, gender, and body mass index (BMI) were recorded. IRB-approved informed consent was obtained from all subjects.Study Protocol: All subjects underwent a low-calorie liquid diet for 1-3 weeks prior to WLS. 1-7 days prior to WLS, MRI was performed at 3.0T (HDxt or MR750, GE Healthcare) using an 8- or 32-channel phased-array coil. Subjects at UCSD were scanned on a 3T MRI system (MR750, GE Healthcare). Subjects at UW-Madison were scanned on a 3T widebore MRI system (Premier, GE Healthcare). Each MRI exam included complex 3D-multi-echo spoiled gradient-echo CSE-MRI (“Complex-MRI”).
Acquisition parameters are similar to that reported previously.7-9 Complex MRI was acquired with low flip angles to avoid T1-bias, and PDFF maps were reconstructed to account for spectral complexity of fat10-11, R2* decay10-12, eddy currents13 and noise-related bias.14 PDFF maps were analyzed by placing one ROI in each of the nine Couinaud segments of the liver, avoiding large vessels, bile ducts, and major artifacts. The average from the nine Couinaud segments was calculated.
Biopsy: During WLS, a wedge biopsy or multiple core biopsies containing ~2-3g of tissue were obtained from the anterior surface of the left lateral hepatic lobe. Two expert hepatopathologists in consensus performed conventional histological analysis of the formalin-fixed samples, known as Steatosis Actual Percentage (SAP). Steatosis was graded based on the percentage of hepatocytes containing intracellular vacuoles of fat.15
Digital Histologic Analysis: Using ImagePro, we performed semi-automated segmentation on high-resolution digitized histological slides to determine the “Steatosis Proportionate Area” (SPA), the average diameter of each fat droplet, and the number of fat droplets. We defined the SPA as the sum of the area of all the fat droplets within each pathology slide. (ImagePro Plus v10.0, Media Cybernetics, Rockville, MD).16
Statistical Analysis
Linear regression analysis was used to analyze the relationships between SPA, MRI-PDFF, SAP, and fat droplet size.
Results
Digital histologic analysis was performed on the biopsy specimen of 12 patients who participated in our WLS study. Conventional histological analysis, digital histological analysis and MRI-PDFF was performed in all subjects.Figure 1A shows a representative MRI-PDFF map from one subject, while Figure 1B, shows the corresponding wedge biopsy specimen in H&E stain. Images 1 and 2 within Figure 1B shows the corresponding unsegmented slides, while images 3 and 4 show the fat droplet segmentation.
Figure 2 compares the SPA with both MRI-PDFF and SAP, showing very strong correlation. When comparing SPA with MRI-PDFF, the Pearson Correlation Coefficient (r) was 0.94, and p=8.1*10-6. SPA compared to SAP displayed a similar relationship with r=0.94, and p=8.1x10⁻⁶.
Figure 3 compares MRI-PDFF with the SAP with r=0.9, and p=2.9x10⁻¹⁵ also showing very strong correlation.
Figure 4 displays the relationship between the number of fat droplets and the average diameter size of the fat droplets to the MRI-PDFF. The number of fat droplets and MRI-PDFF had r=0.9, and p=4.4x10⁻⁵. The relationship between average diameter size with MRI-PDFF resulted in r=0.6, and p=0.03.
Discussion/Conclusion
In this work, we successfully compared digital histologic analysis of the SPA with MRI-PDFF and SAP, demonstrating strong correlation with statistical significance. Interestingly, we demonstrated that liver fat content (MRI-PDFF) strongly correlated with the number of fat droplets, but weakly with the droplet size. However, both relationships displayed statistical significance, implying a relationship to the liver fat content relies on both.Importantly, this work demonstrates the feasibility of using quantitative digital histological analysis to characterize the size distribution, and potentially the spatial clustering of fat droplets. This has important implications for future work aiming to use MRI to characterize the microstructure of the liver in patients with NAFLD. For example, it is well known that R2* increases with liver fat content, likely due to effects of susceptibility from fat droplets.17 Bloch equation Monte Carlo computer simulations aimed at explaining relaxometry data in the liver and the relationship to liver microstructure require an understanding of histology-based microstructure such as the size and distribution of fat droplets.18
Acknowledgements
Dr. Joshi is supported by the National Cancer Institute of the National Institutes of Health under Award T32CA090217. This work was also supported by the NIH (R01 DK088925) and Pfizer Inc. The authors also acknowledge GE Healthcare who provides research support to the University of Wisconsin-Madison. Dr. Reeder is the Fred Lee Sr. Endowed Chair of Radiology.References
- Younossi, Zobair M., et al. "Changes in the prevalence of the most common causes of chronic liver diseases in the United States from 1988 to 2008." Clinical gastroenterology and hepatology 9.6 (2011): 524-530.
- Poonawala, Asma, Satheesh P. Nair, and Paul J. Thuluvath. "Prevalence of obesity and diabetes in patients with cryptogenic cirrhosis: a case‐control study." Hepatology 32.4 (2000): 689-692.
- Bedossa, Pierre, and Fabrice Carrat. "Liver biopsy: the best, not the gold standard." Journal of hepatology 50.1 (2009): 1-3.
- Rinella, Mary E., et al. "Report on the AASLD/EASL joint workshop on clinical trial endpoints in NAFLD." Journal of hepatology 71.4 (2019): 823-833.
- Jayakumar, Saumya, et al. "Longitudinal correlations between MRE, MRI-PDFF, and liver histology in patients with non-alcoholic steatohepatitis: analysis of data from a phase II trial of selonsertib." Journal of hepatology 70.1 (2019): 133-141.
- Di Martino, Michele, et al. "Comparison of magnetic resonance spectroscopy, proton density fat fraction and histological analysis in the quantification of liver steatosis in children and adolescents." World journal of gastroenterology 22.39 (2016): 8812.
- Rehm JL, Wolfgram PM, Hernando D, Eickhoff JC, Allen DB, Reeder SB, “Proton density fat-fraction is an accurate biomarker of hepatic steatosis in adolescent girls and young women.” Eur Radiol 2015 25(10):2921-30.
- Artz NS, Haufe WM, Hooker CA, Hamilton G, Wolfson T, Campos GM, Gamst AC, Schwimmer JB, Sirlin CB, Reeder SB. “Reproducibility of MR-based liver fat quantification across field strength: Same-day comparison between 1.5T and 3T in obese subjects.” J Magn Reson Imaging 2015 42(3):811-7.
- Hamilton G, Yokoo T, Bydder M, Cruite I, Schroeder ME, Sirlin CB, Middleton MS, “In vivo characterization of the liver fat ¹H MR spectrum.” NMR Biomed 2011 24(7):784-90.
- Yu H, Shimakawa A, McKenzie CA, Brodsky E, Brittain JH, Reeder SB, “Multiecho water-fat separation and simultaneous R2* estimation with multifrequency fat spectrum modeling.” Maagn Reson Med 2008 60(5):1122-34
- Bydder M, Yokoo T, Hamilton G, Middleton MS, Chavez AD, Schwimmer JB, Lavine JE, Sirlin CB, “Relaxation effects in the quantification of fat using gradient echo imaging.” Magn Reson Imaging. 2008 26(3):347-59.
- Yu H, McKenzie CA, Shimakawa A, Vu AT, Brau AC, Beatty PJ, Pineda AR, Brittain JH, Reeder SB, “Multiecho reconstruction for simultaneous water-fat decomposition and T2* estimation.” J Magn Reson Imaging. 2007 26(4):1153-61.
- Hernando D, Hines CD, Yu H, Reeder SB, “Addressing phase errors in fat-water imaging using a mixed magnitude/complex fitting method.” Magn Reson Med. 2012 67(3):638-44.
- Liu CY, McKenzie CA, Yu H, Brittain JH, Reeder SB, “Fat quantification with IDEAL gradient echo imaging: correction of bias from T1 and noise.” Magn Reson Med 2007 58(2):354-64.
- Brunt EM, Janney CG, Di Bisceglie AM, Neuschwander-Tetri BA, Bacon BR, “Nonalcoholic steatohepatitis: a proposal for grading and staging the histological lesions.” Am J Gastroenterol. 1999 Sep;94(9):2467-74.
- Marsman H, Matsushita T, Dierkhising R, Kremers W, Rosen C, Burgart L, Nyberg SL, “Assessment of donor liver steatosis: pathologist or automated software?” Hum Pathol 2004 35(4):430-435.
- Bashir, Mustafa R., et al. "Hepatic R2* is more strongly associated with proton density fat fraction than histologic liver iron scores in patients with nonalcoholic fatty liver disease." Journal of Magnetic Resonance Imaging 49.5 (2019): 1456-1466.
- Wang, Changqing, Scott B. Reeder, and Diego Hernando. "Relaxivity‐iron calibration in hepatic iron overload: Reproducibility and extension of a Monte Carlo model." NMR in Biomedicine 34.12 (2021): e4604.
Figures
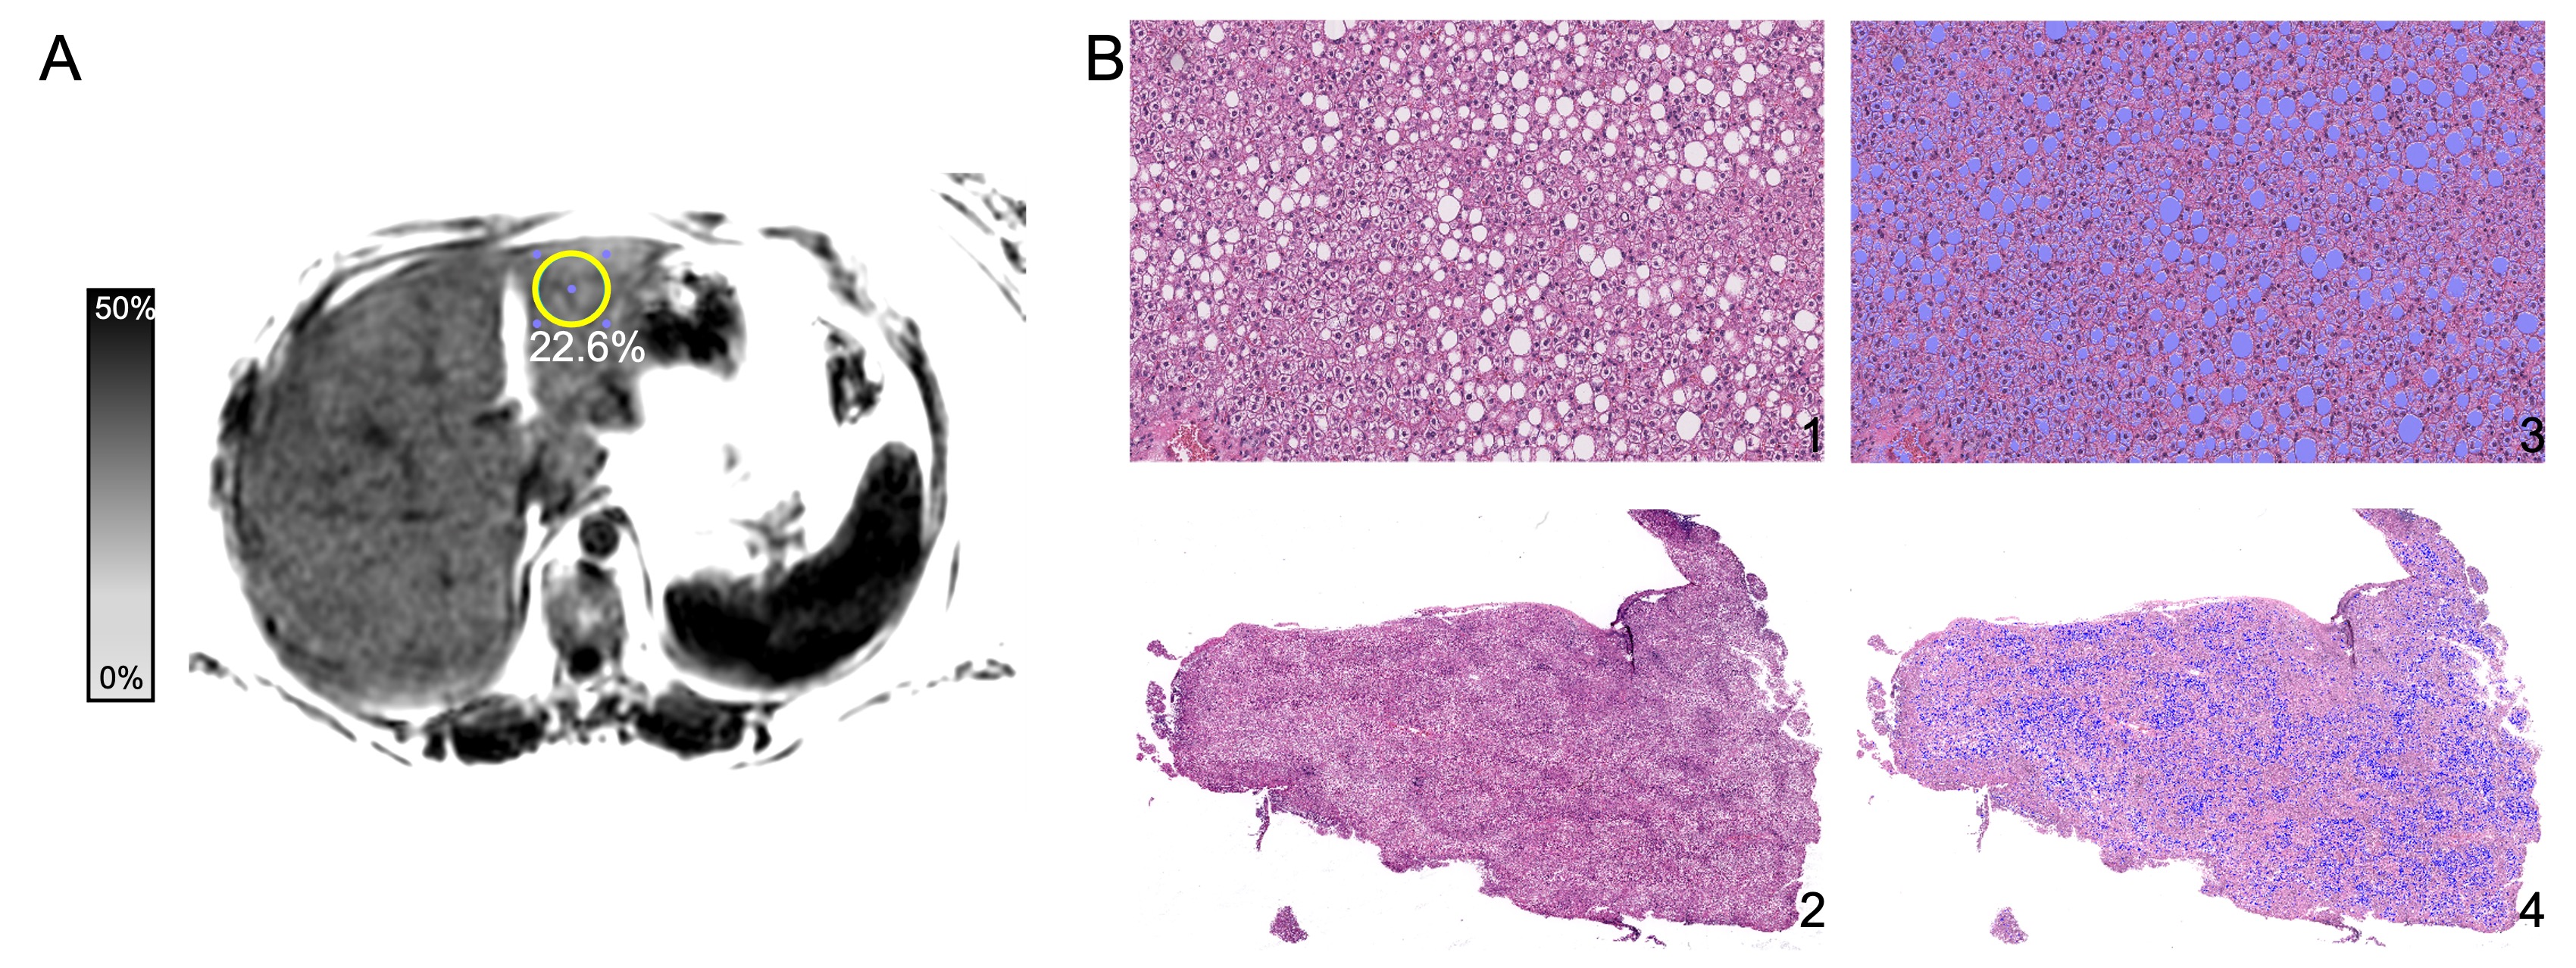
Figure 1: A) Mean PDFF in the ROI in Couinaud segment 3 was 22.6% with a standard deviation of 3.8% in a (female patient, 41 years old, 135.8kg, BMI 49.9). B) The corresponding wedge biopsy specimen in H&E stain shows high amounts of fat droplets as segmented using Image Pro v10. Images 1 and 2 within Figure 1B shows the corresponding unsegmented slides, while images 3 and 4 show the fat droplet segmentation.
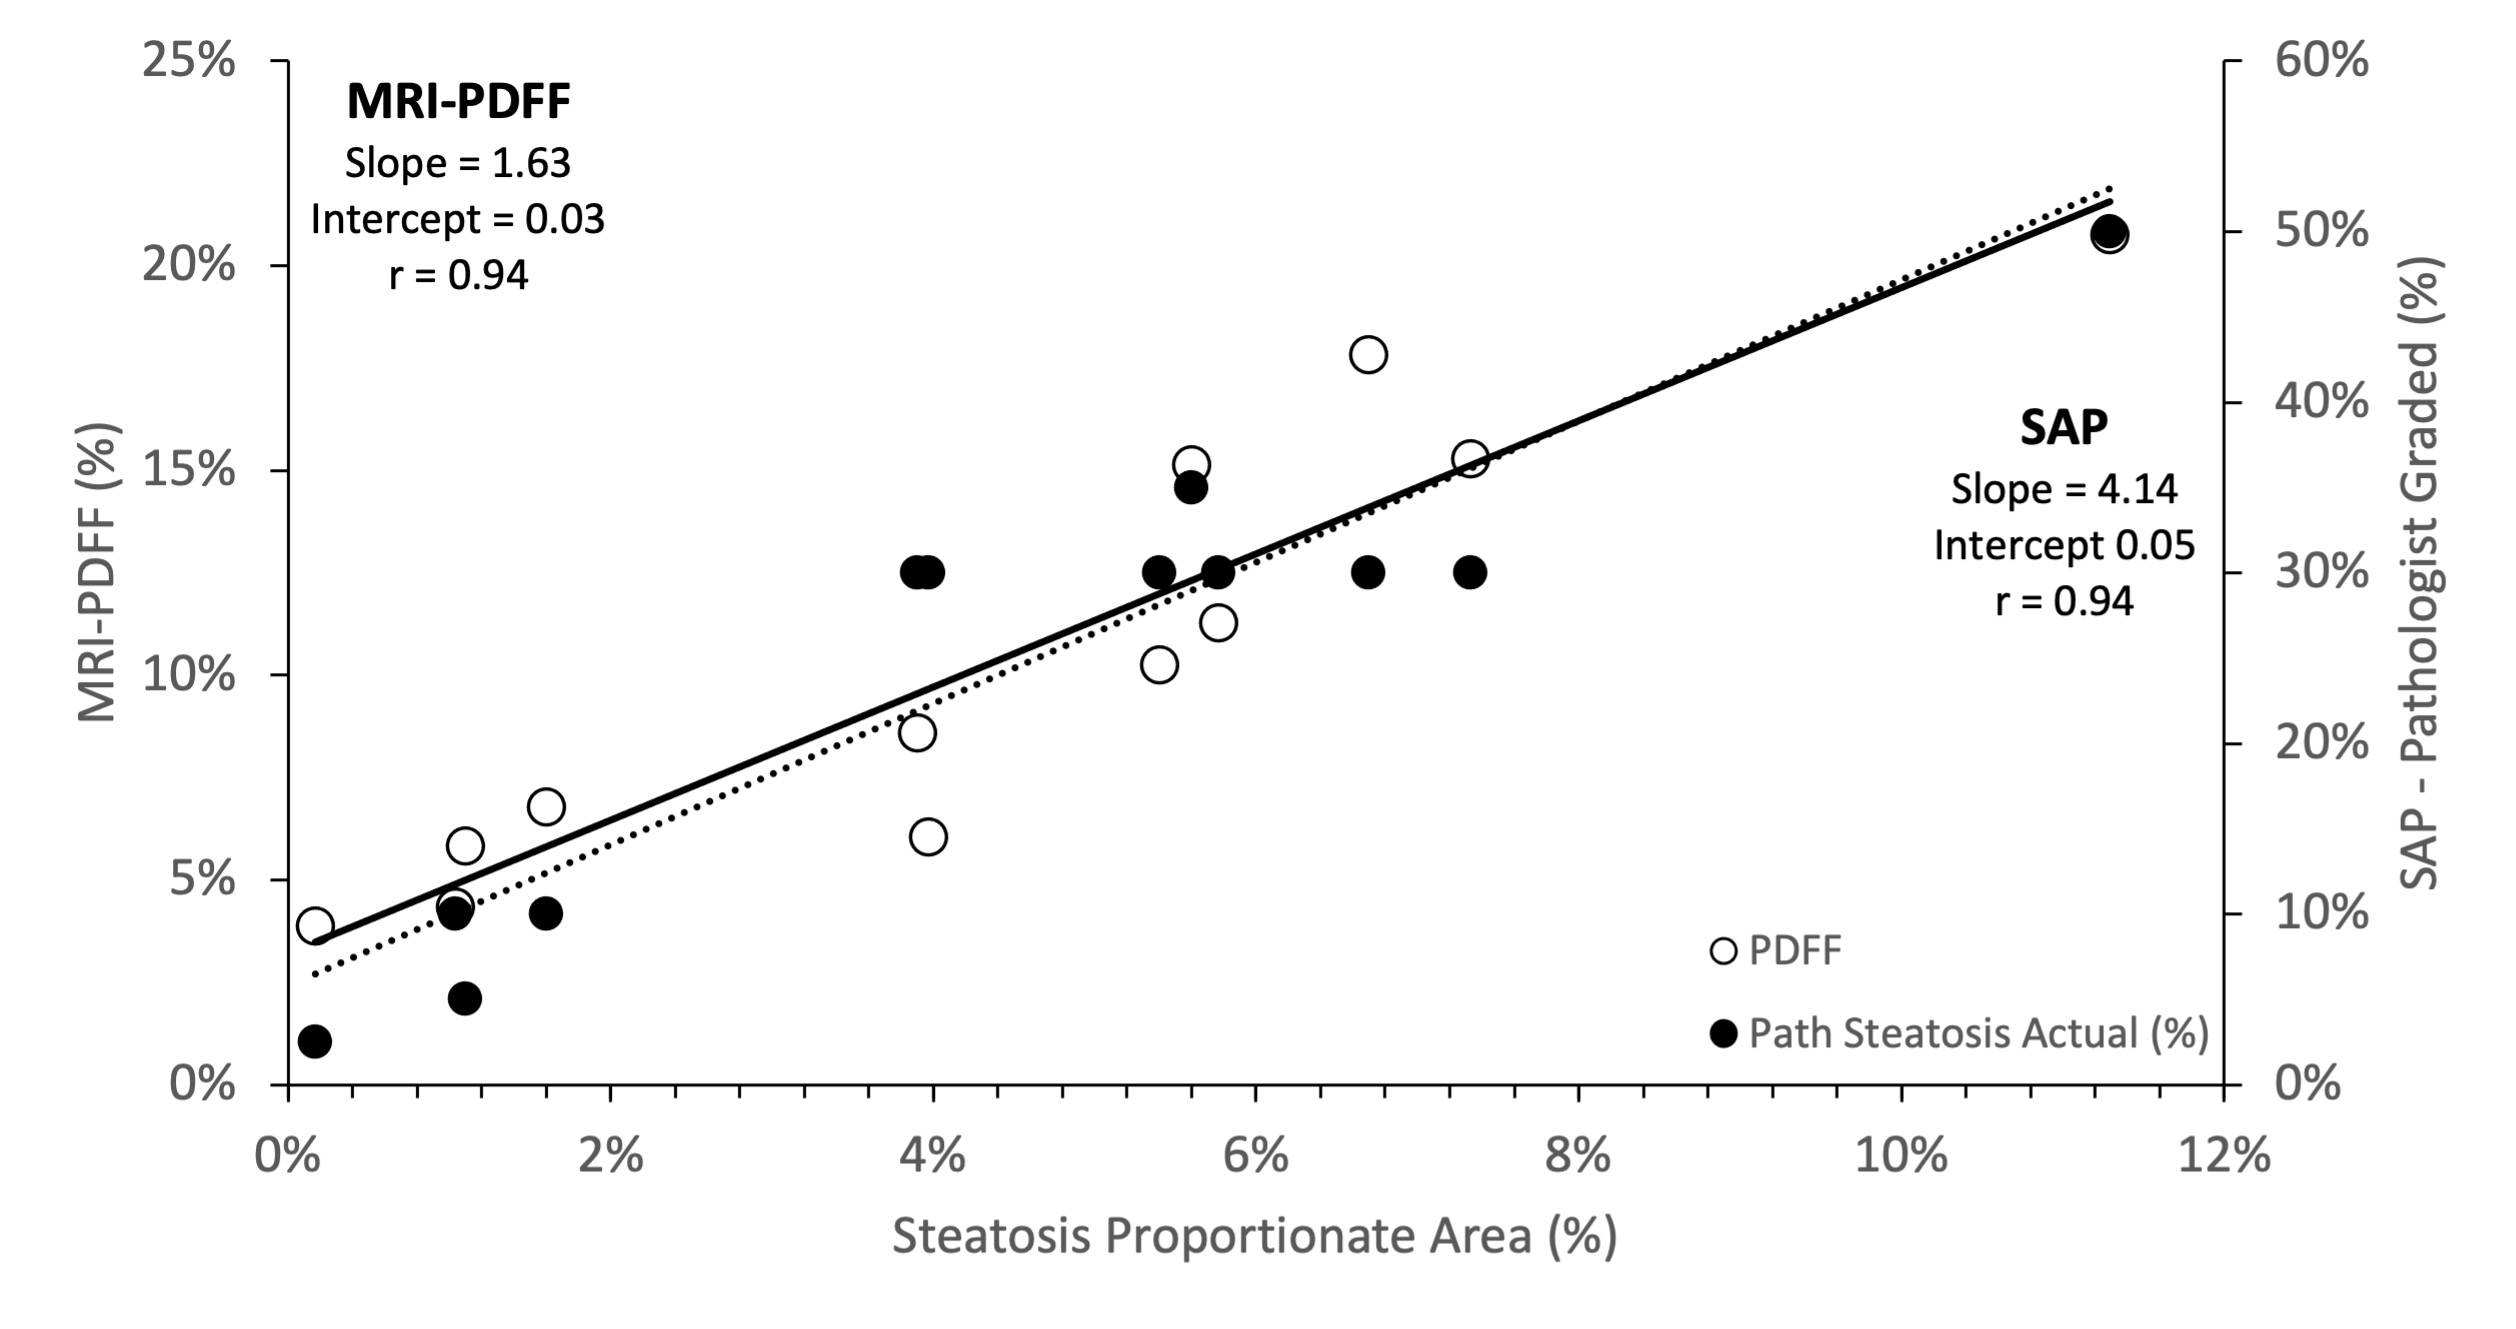
Figure 2: Our analysis showed a strong correlation when comparing SPA to both MRI-PDFF and SAP, displaying that SPA is an appropriate reference standard for MRI-PDFF and characterizing the microstructure. Liver steatosis is graded based on the percentage of fat within the hepatocytes: grade 0 (healthy, <5%), grade 1 (mild, 5%-33%), grade 2 (moderate, 34%-66%), and grade 3 (severe, >66%).
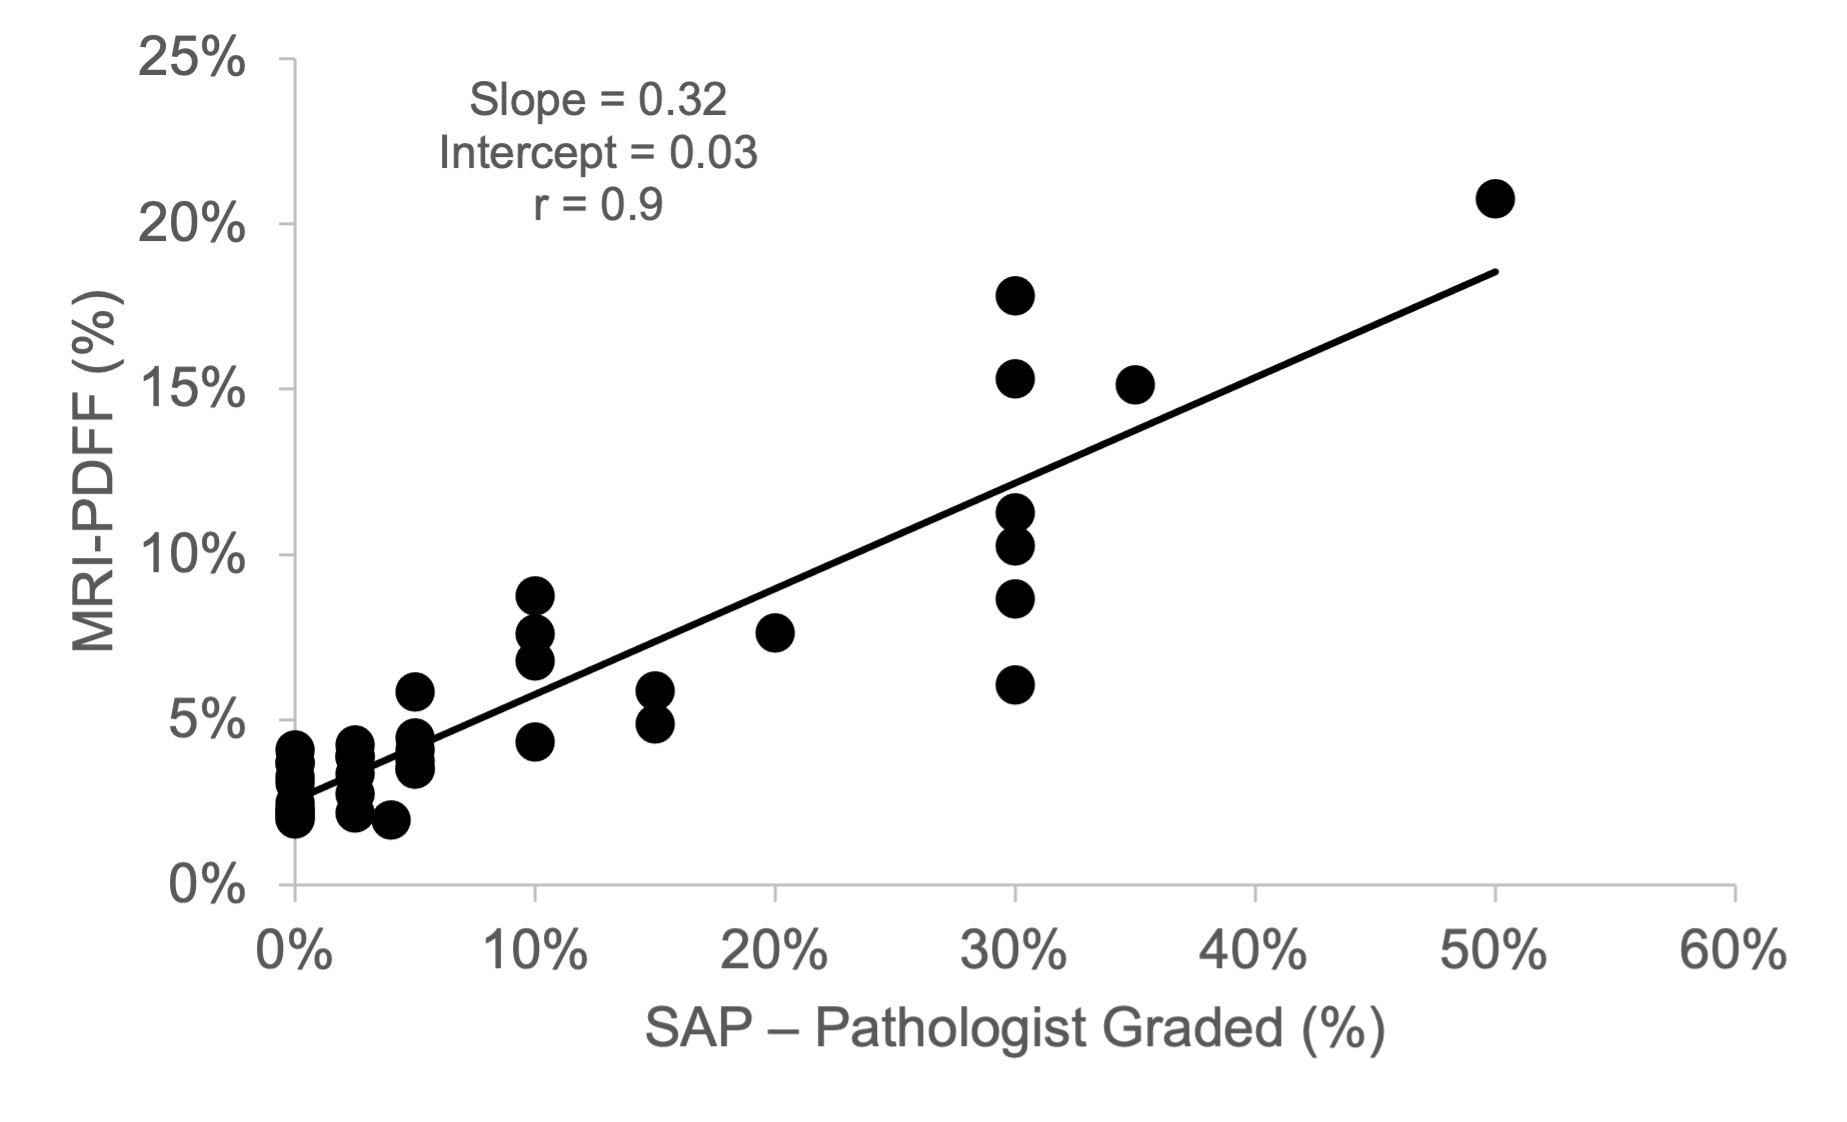
Figure 3: MRI-PDFF shows strong correlation to the conventional histology-derived steatosis percentage by pathologists (SAP). Again, liver steatosis is graded based on the percentage of fat within the hepatocytes: grade 0 (healthy, <5%), grade 1 (mild, 5%-33%), grade 2 (moderate, 34%-66%), and grade 3 (severe, >66%).
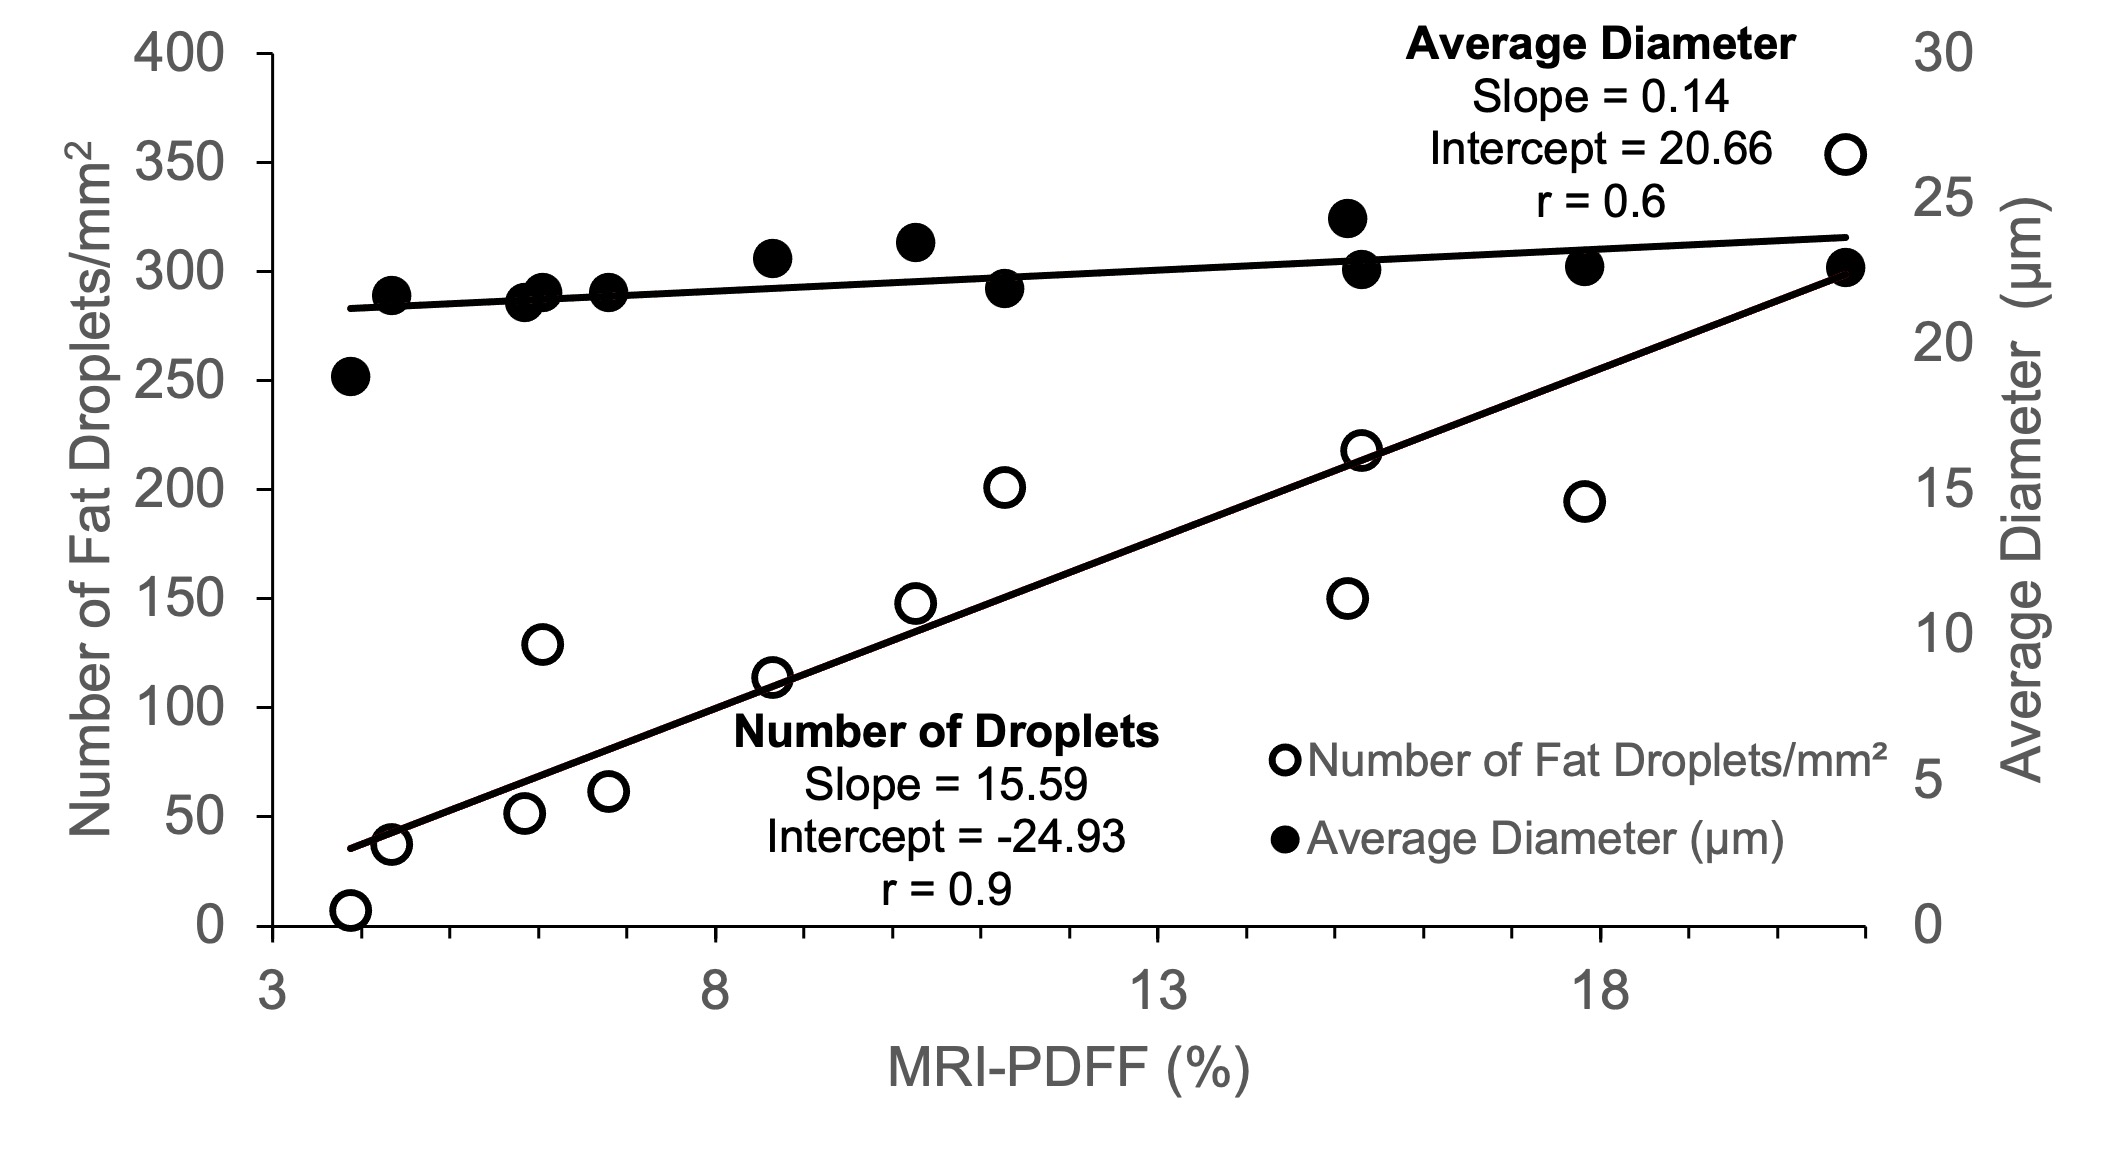
Figure 4: The severity of steatosis correlates strongly with the number of fat droplets but not fat droplet size. MRI-PDFF compared to both number of fat droplets (left y-axis) and average fat droplet diameter (right y-axis).