1846
Test-Retest Repeatability and Cross-Platform Reproducibility of Optimized 2D MRE and 3D MRE Liver Protocols with Automated Analysis
Bogdan Dzyubak1, Kay M Pepin1, Jun Chen1, Yuan Le1, Kyle Kalutkiewicz2, Roger Grimm1, Jeremy A Heilman1, Scott Kruse1, Jennifer Kugel1, Meng Yin1, Kevin J Glaser1, and Ehman L. Richard1
1Radiology, Mayo Clinic, Rochester, MN, United States, 2Engineering, Resoundant, Rochester, MN, United States
1Radiology, Mayo Clinic, Rochester, MN, United States, 2Engineering, Resoundant, Rochester, MN, United States
Synopsis
Keywords: Liver, Elastography
Magnetic Resonance Elastography is a technique used to effectively stage liver fibrosis by measuring tissue stiffness. This work optimized several acquisition and processing parameters, and performed a comprehensive repeatability/reproducibility validation across the three types of MRE (GRE, EPI, 3DEPI), 1.5T and 3T field strengths, and the three major manufacturers (GE, Siemens, Philips). When using the optimized methods and automated analysis, the repeatability coefficients were 11.8% for GRE, 10.8% for EPI, and 7.7% for 3DEPI, all superior to QIBA’s 19% benchmark. Agreement between manufacturers was within 2%.Introduction
Regulatory-approved implementations of MR Elastography (MRE) are now widely deployed at more than 2000 locations globally. The main clinical application is for diagnosis and staging of liver fibrosis and MRE is now regarded as the most accurate non-invasive technique for this important clinical task 1. MRE is increasingly being used longitudinally in patients to follow the progression of disease and to monitor treatment. The repeatability coefficient (RC) 2 is used to indicate the level at which a biomarker change is 95% likely to be caused by biology rather than measurement variation. A test with a small RC can be used to detect a smaller biological change. The Consensus Profile for MRE of the liver, developed by the Quantitative Imaging Biomarker Alliance (QIBA) is an international standard protocol, and the resulting repeatability performance that can be achieved 3. Based on a meta-analysis of multiple studies, the QIBA profile indicates that if properly performed, the RC of 2D liver MRE is 19%. This is a very useful level of precision because fibrosis causes large changes in liver stiffness (liver stiffness can more than double with severe fibrosis). Given recent technical advances in sequences and protocols for 2D GRE and SE-EPI MRE, wider availability of 3D vector MRE, and the development and extensive testing of an automated analysis tools for MRE, the goal of this study was to re-evaluate the test-retest repeatability of liver MRE on multiple platforms. A second aim was to provide further evidence that if implemented in a consistent fashion, MRE-based liver stiffness measurements obtained at different field strengths and on MRI systems from different manufacturers will be comparable. In this study, Then, using the optimal parameter set, we used a comprehensive approach to investigate the repeatability across major manufacturers (GE, Siemens, and Philips), field strengths (1.5 and 3T), and acquisition strategies (2D GRE and EPI MRE, and 3D EPI MRE). All stiffness measurements were performed using an automated method which allowed us to eliminate the effects of reader variability and bias and narrow the study to technology-related effects.Methods
As a first step, we investigated parameter permutations for acquisition and processing methods to improve repeatability of MRE in phantoms and healthy volunteers. Parameters that were evaluated included resolution, slice thickness, fractional encoding, confidence threshold, and analysis volume for 3D MRE. When comparing sequence types, GRE MRE with QIBA profile settings was used as the baseline. The optimized acquisition parameters (Table 1) were then used for the cross-platform repeatability study. Five volunteers were scanned on each combination of the following: manufacturer (GE, Siemens, Philips), field strength (1.5T, 3T), and sequence type (GRE, EPI, 3D EPI). Each volunteer was scanned twice without repositioning on two separate days, for a total of 360 MRE exams. Liver stiffness values were calculated using an automated method without manual modification 4. The repeatability coefficient was calculated for each type of MRE sequence across all subjects and platforms 2. A percentage stiffness difference was calculated between manufacturers.Results
The results are summarized in Table 2. Automated analysis was successful in all exams. The repeatability coefficient was 11.8% for 2D GRE MRE, 10.8% for 2D SE-EPI MRE, and 7.7% for 3D vector SE-EPI MRE. The inter-platform agreement was excellent, systematic with bias values ranging between 0.2 % and 1.2% Calculating stiffness from ROIs in 4 slices spaced out to sample a 2D-like 4-cm volume yielded stiffness within 1% of 12-slice and 20-slice measurements. Confidence thresholding the 96x96 2D EPI data at 0.98, and 3D MRE at 0.92 was deemed by an expert reader to produce masks equivalent to the GRE threshold (Figure 4).Discussion
Ongoing incremental advances in clinical liver MRE protocols and analysis methods can be expected to steadily improve test-retest repeatability, which is a key performance factor for following the disease process and assessing the effect of treatment. The RC of 3D vector MRE demonstrated a further substantial improvement over 2D MRE, which likely reflects the superiority of fully processing the 3D wavefield. The repeatability results obtained in this study were obtained under ideal conditions - in healthy subjects and in short exams that that only included the MRE acquisitions. While it likely that the advances will boost the repeatability of liver MRE beyond the current QIBA profile claim, results obtained in patient exams and long protocols are not expected to achieve the same level of performance. The results obtained in this study should be regarded as a performance target and provide motivation for further studies to update the test-retest performance in clinical settings.Conclusions
Parameters for GRE, EPI, and 3D EPI MRE sequences were optimized and validated for repeatability and reproducibility on 3 platforms and 2 field strengths. When using the optimized parameters together with automated analysis, this study demonstrated progress in improving the repeatability of liver MRE and the opportunity to boost the repeatability claim of the current QIBA standard for liver MRE. The repeatability of 3D vector MRE was substantially higher than that of 2D MRE. The results also demonstrated excellent agreement in liver stiffness across field strengths and manufacturer platforms.Acknowledgements
NIH R37 EB001981. The authors gratefully acknowledge the assistance of Bradley Bolster of Siemens Heathineers, Sandeep Ganji of Philips Healthcare, and Daniel Rettmann of GE Healthcare in conducting this research.References
1.Pepin, K.M., Welle, C.L., Guglielmo, F.F., et al.: ‘Magnetic resonance elastography of the liver: everything you need to know to get started’, Abdom Radiol, 2022, 47, (1), pp. 94-114 2.Raunig, D.L., McShane, L.M., and Pennello, G.: ‘Quantitative imaging biomarkers: A review of statistical methods for technical performance assessment’, Statistical Methods in Medical Research, 2015, 24, (1), pp. 27-67 3.QIBA: ‘QIBA Profile: Magnetic Resonance Elastography of the liver’, 2018 4.Dzyubak, B., Venkatesh, S., Manduca, A., et al.: ‘Automated liver elasticity calculation for MR elastography’, J Magn Reson Imag, 2016, 43, (5), pp. 1055-1063 5.Trout, A.T., Serai, S., Mahley, A., et al.: ‘Liver stiffness Measurements with MR Elastography: Agreement and Repeatability across Imaging Systems, Field Strengths, and Pulse Sequences’, Radiology, 2016, 281, (3), pp. 793-804 6.Shire, N.J., Yin, M., Chen, J., et al.: ‘Test-retest repeatability of MR elastography for noninvasive liver fibrosis assessment in Hepatitis C’, Journal of Magnetic Resonance Imaging, 2011, 34, pp. 947-955 7.Serai, S., Yin, M., Wang, H., et al.: ‘Cross-vendor validation of liver magnetic resonance elastography’, Abdom Imaging, 2015, 40, (4), pp. 789-794 8.Kim, J.H., Kim, B., Yu, H.J., et al.: ‘Reproducibility of hepatic MR elastography across field strengths, pulse sequences, scan intervals, and readers’, Abdom Radiol, 2020, 45, (1), pp. 107-115Figures
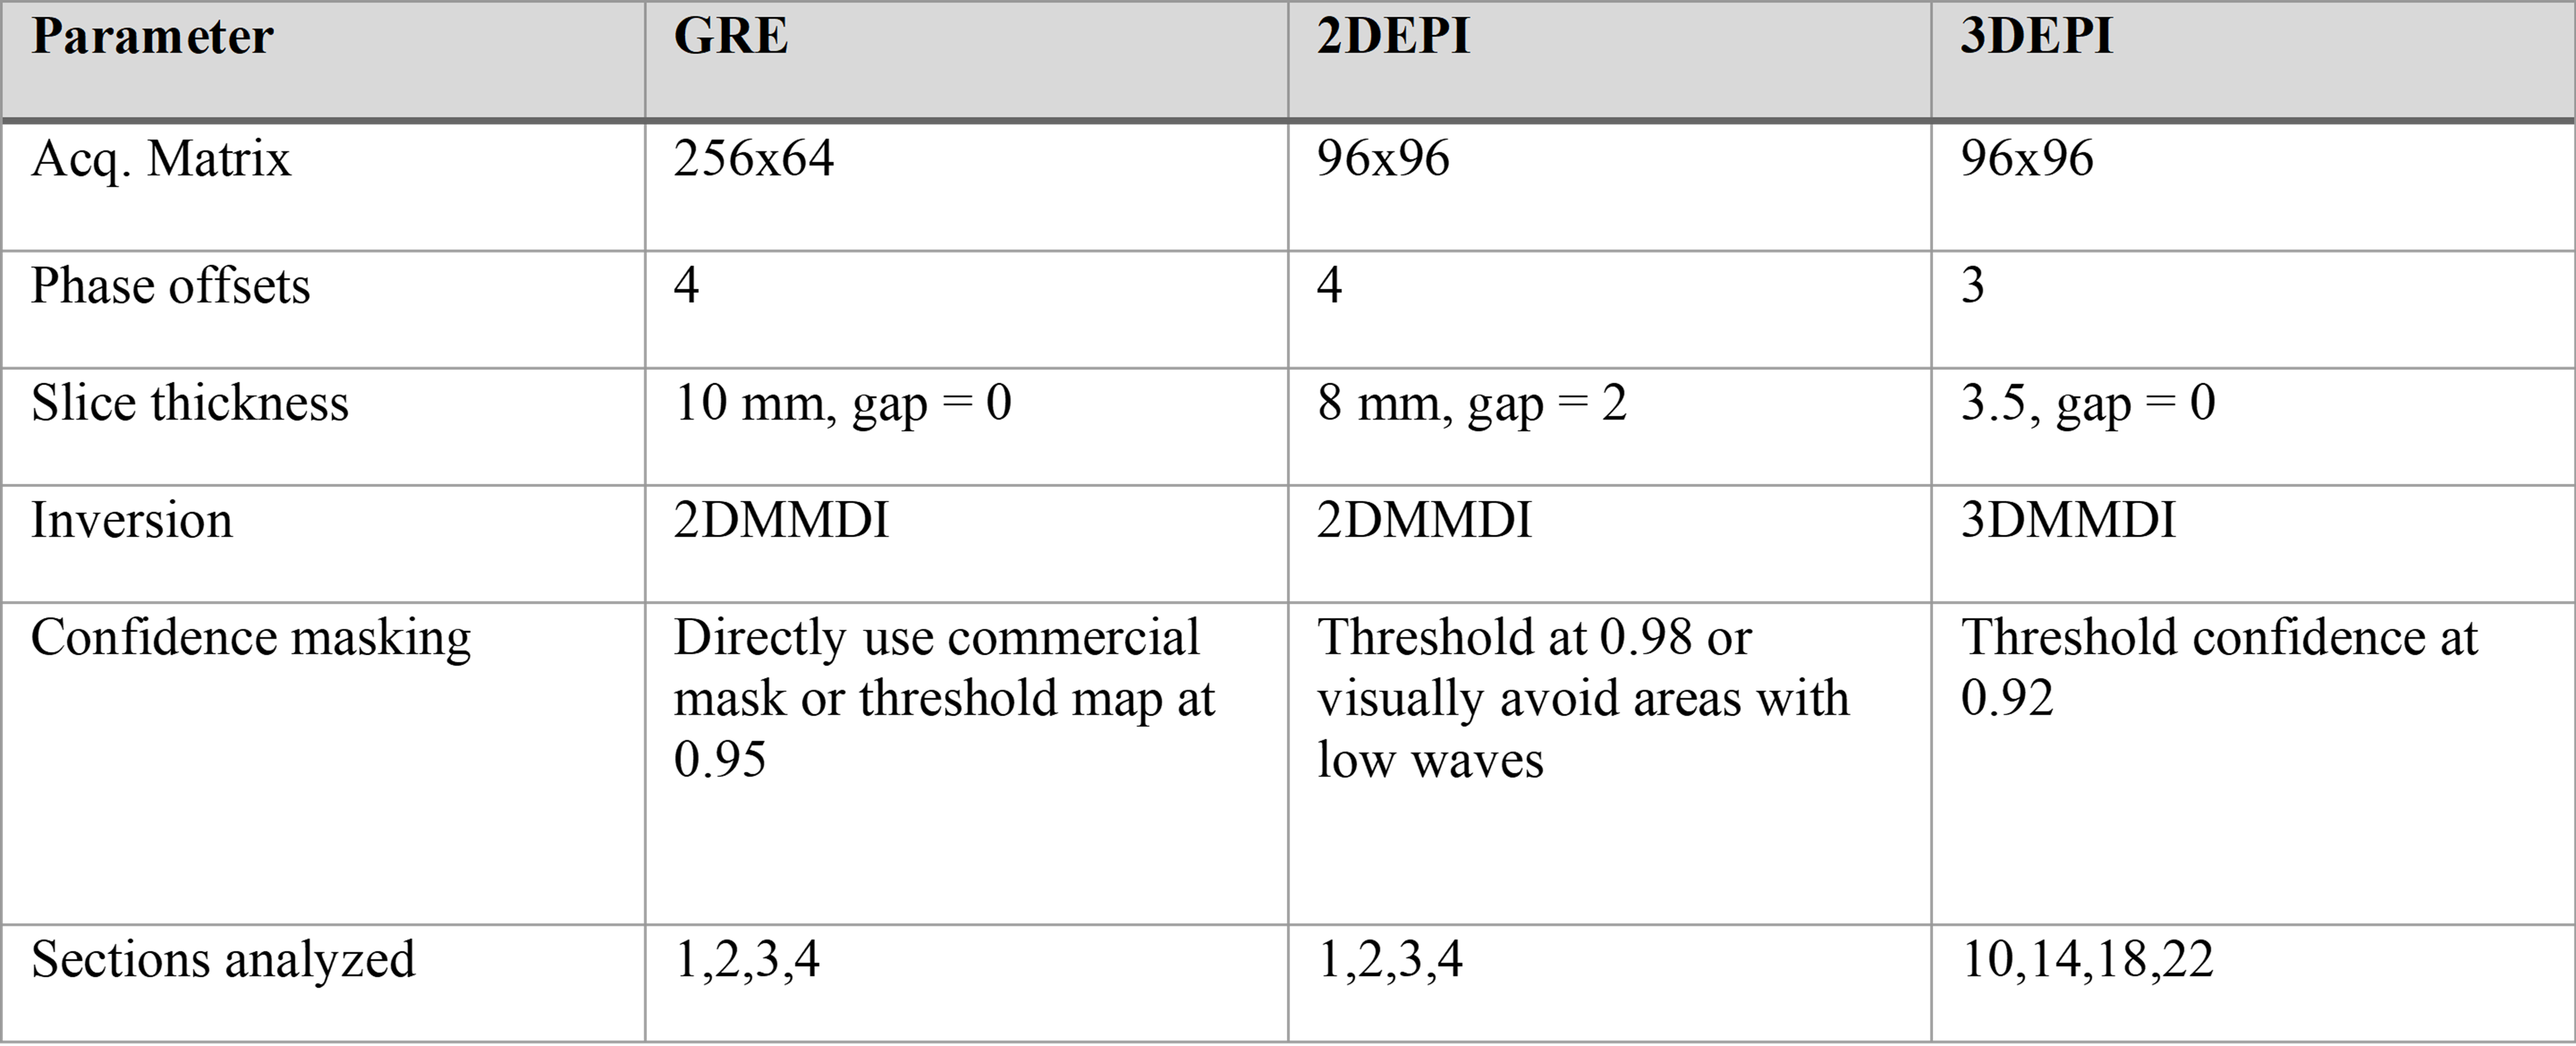
Recommended
MRE parameters and analysis methods. Although 96x96 EPI acquisitions yielded
the same stiffness as 80x80, there was minimal increase in imaging time and the
elastograms provided better spatial resolution.
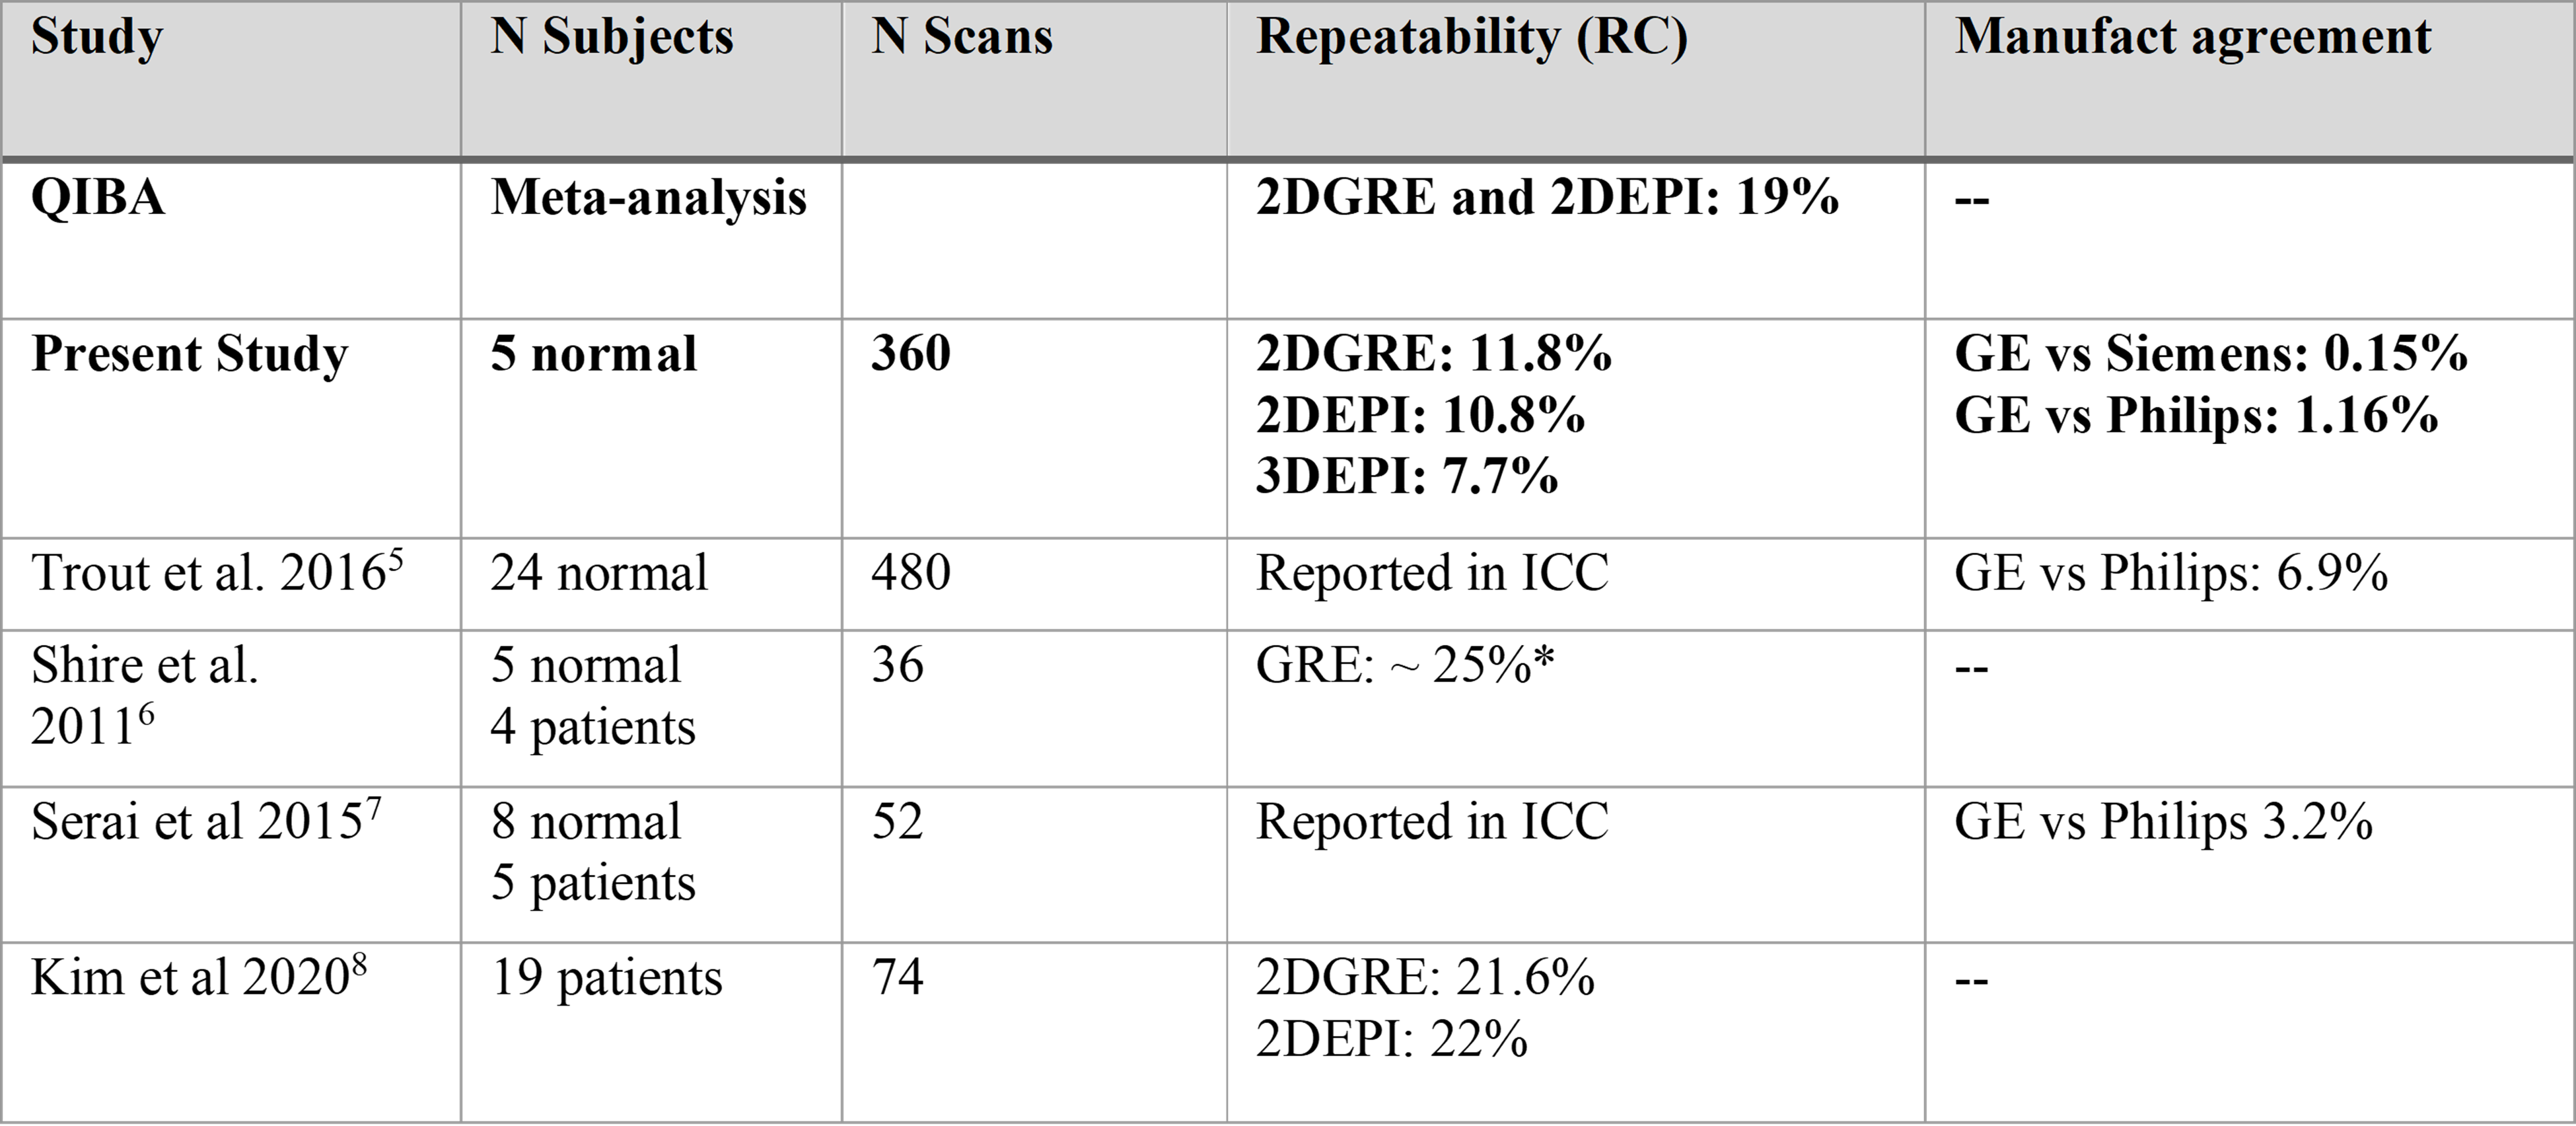
Repeatability
and manufacturer reproducibility results using optimized sequence parameters
and processing methods, as well as automated analysis. * Indicates that the RC was obtained by
converting a published coefficient of variation (CV) by 2.77. Intraclass
correlation values (ICC) are another measure of repeatability which is not
directly convertible.
DOI: https://doi.org/10.58530/2023/1846