1844
Evaluation the value of T1rho and Gd-EOB-DTPA-Enhanced T1 Mapping for liver function reserve in patients with chronic liver disease1Department of Magnetic Resonance, Lanzhou University Second Hospital, Lanzhou, China, 2Second Clinical School, Lanzhou University, Lanzhou, China, 3Gansu Province Clinical Research Center for Functional and Molecular Imaging, Lanzhou, China, 4Philips Healthcare, Xi'an, China, 5Philips Healthcare, Shenzhen, China
Synopsis
Keywords: Liver, Liver, T1rho, chronic liver disease, T1 mapping
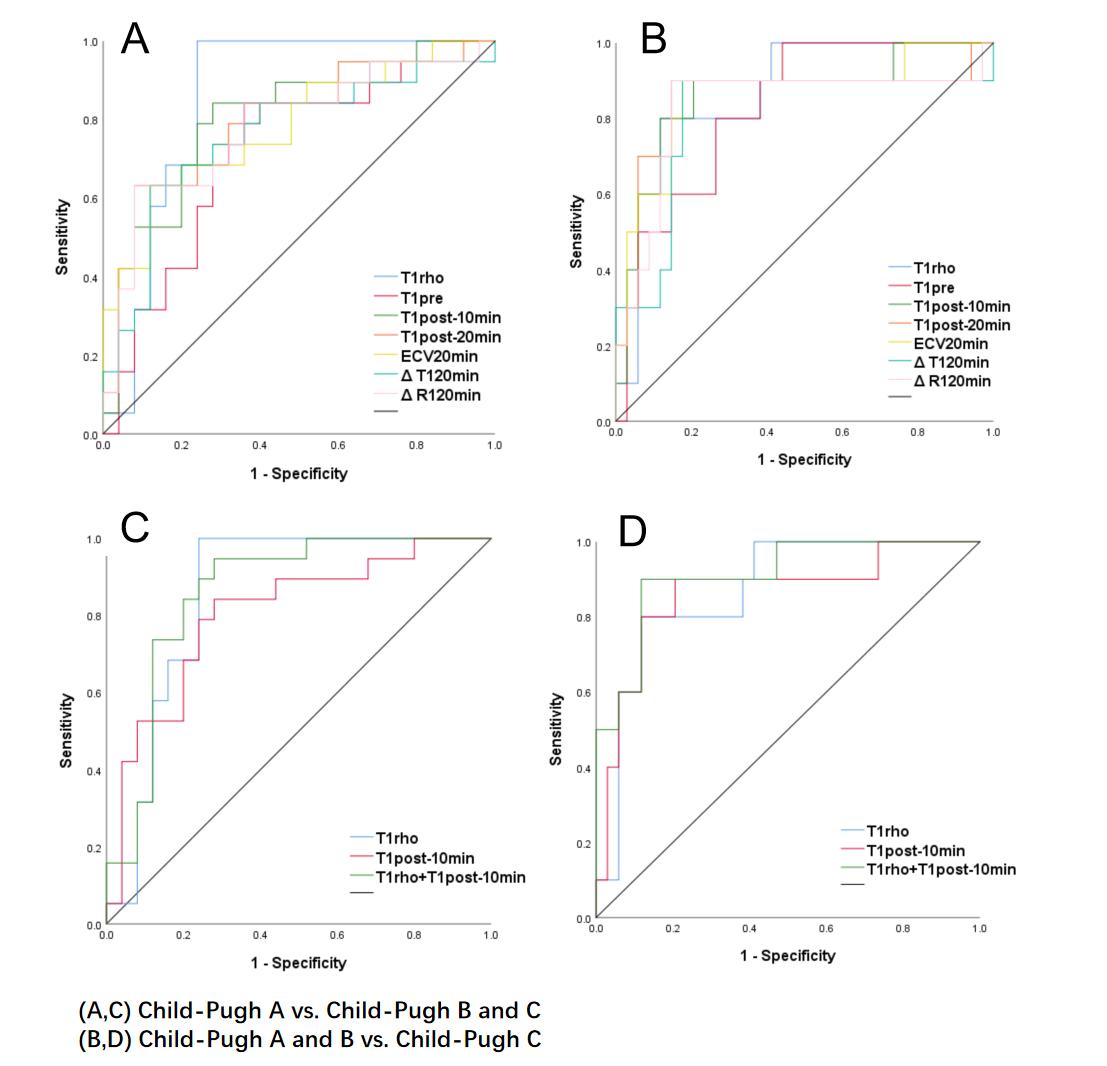
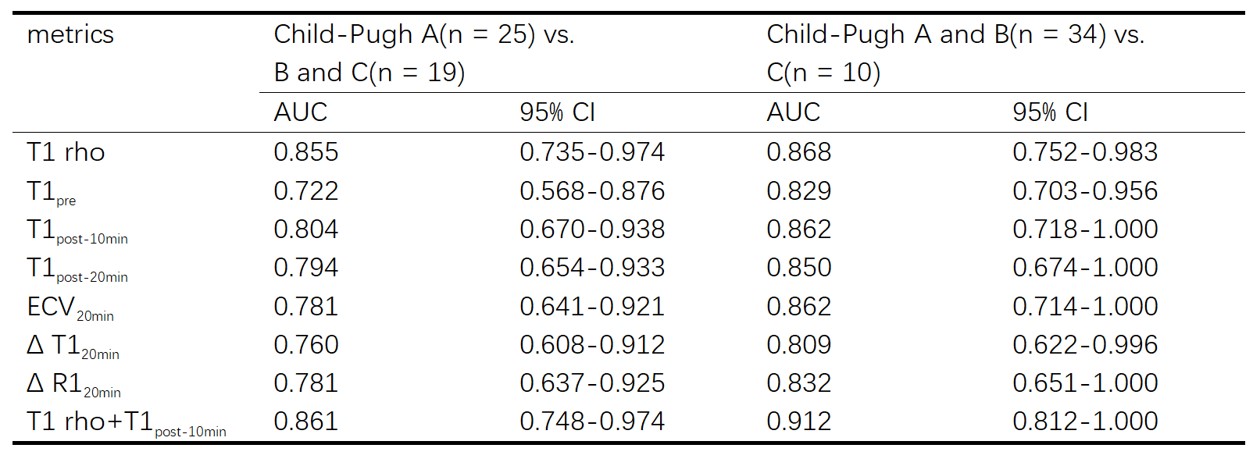
The purpose of this study is to evaluate the diagnostic performance of T1 rho and Gd-EOB-DTPA-Enhanced T1 Mapping in patients with chronic hepatitis B in liver function reserve. For the two groups of Child-Pugh A vs. B/C and Child-Pugh A/ B vs. C, the AUC of T1 rho and T1post-10min is higher than other metrics. The AUC value combined with these two indicators is the highest (0.861; 0.912). Δ T1, Δ R1 and ECV and T1 rho quantitative techniques may be helpful for staging liver function reserve, and the combination of T1 rho and T1post-10min can provide higher diagnostic efficiency.Introduction and purpose
Chronic liver disease (CLD) is a progressive deterioration of liver functions. The evaluation of liver function in patients with chronic liver disease is important for disease monitoring. However, the accurate assessment of liver function reserve only by laboratory examination is limited. Therefore, how to find an acknowledged noninvasive imaging methods for quantifying the severity of chronic liver disease is still a challenge. Some studies[1-3] have reported the relationship between hepatic reserve function and T1 related MRI quantitative techniques, such as T1 mapping and T1 rho, etc.. Although, the previous evidence has provided some insights in CLD and related liver functions, the inconsistent results make us difficult to develop a reliable diagnosis and treatment. Our study aims to estimate the potential diagnostic performance of T1 mapping and T1rho relaxation for assessing liver function reserve in patients with CLD, and seek for better diagnosis scheme.Materials and Methods
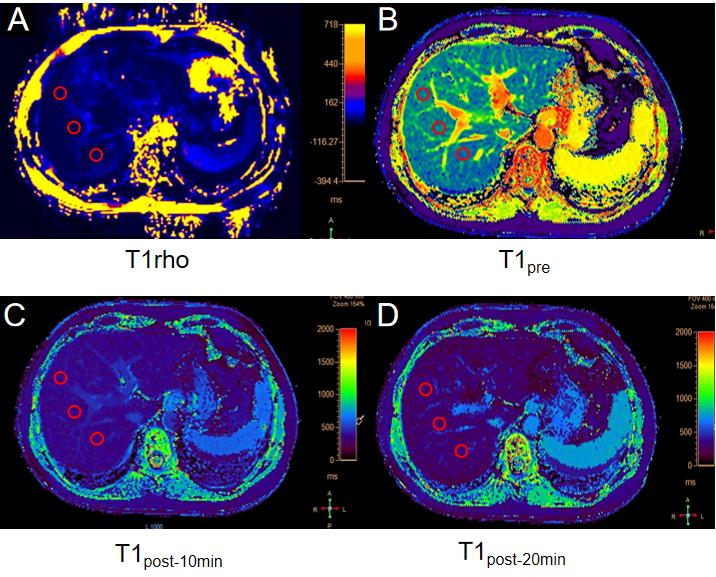
Forty-four CLD patients caused by hepatitis B were enrolled from the Second Hospital of Lanzhou University. All the subjects underwent MR examinations on a 3.0 T MR scanner (Ingenia CX, Philips Healthcare, The Netherlands) with a 16-channel torso coil. A rotary echo spin-lock pulse was used for the acquisition of T1 rho weighted data with a spin lock frequency of 500 Hz at spin-lock times (SLTs) of 0, 10, 20, 40, and 50 ms. The other imaging parameters were as follows: TR/TE = 4.3/2.1 ms; flip angle: 90 degrees, number of slices = 4; FOV = 360 × 292mm2; slice thickness = 6 mm; in-plane reconstruction resolution: 1.88 mm × 1.88 mm. Navigator-based free breathing method is adopted for patient image acquisition. Each patient obtained 4 images of hepatic hilum and its adjacent layers, which took a total of 2 minutes. The following parameters are used for pre and post enhancement axial T1 mapping sequence: TR/TE = 2.0/0.92 ms; flip angle: 20 degrees, FOV = 400×305 mm2; slice thickness = 8 mm, in-plane reconstruction resolution: 1.14 mm × 1.14 mm, number of slices = 3, acquisition time of each group is 36.6s. The data were collected at native T1 mapping (T1pre), 10min-delayed enhanced T1 mapping (T1post-10min), and 20min-delayed enhanced T1 mapping (T1post-20min). The PPU-based breath holding method is adopted for image acquisition. Three region-of-interests (ROIs) were placed at the right lobe of the liver parenchyma, avoiding blood vessels and bile ducts to calculate the extracellular volume mapping (ECV), reduction rate of T1 relaxation time(Δ T1), T1 relaxation rate(Δ R1). Child-Pugh grade was used to evaluate liver reserve function. Figure 1 showed the typical sample images and the placement of ROIs.Results
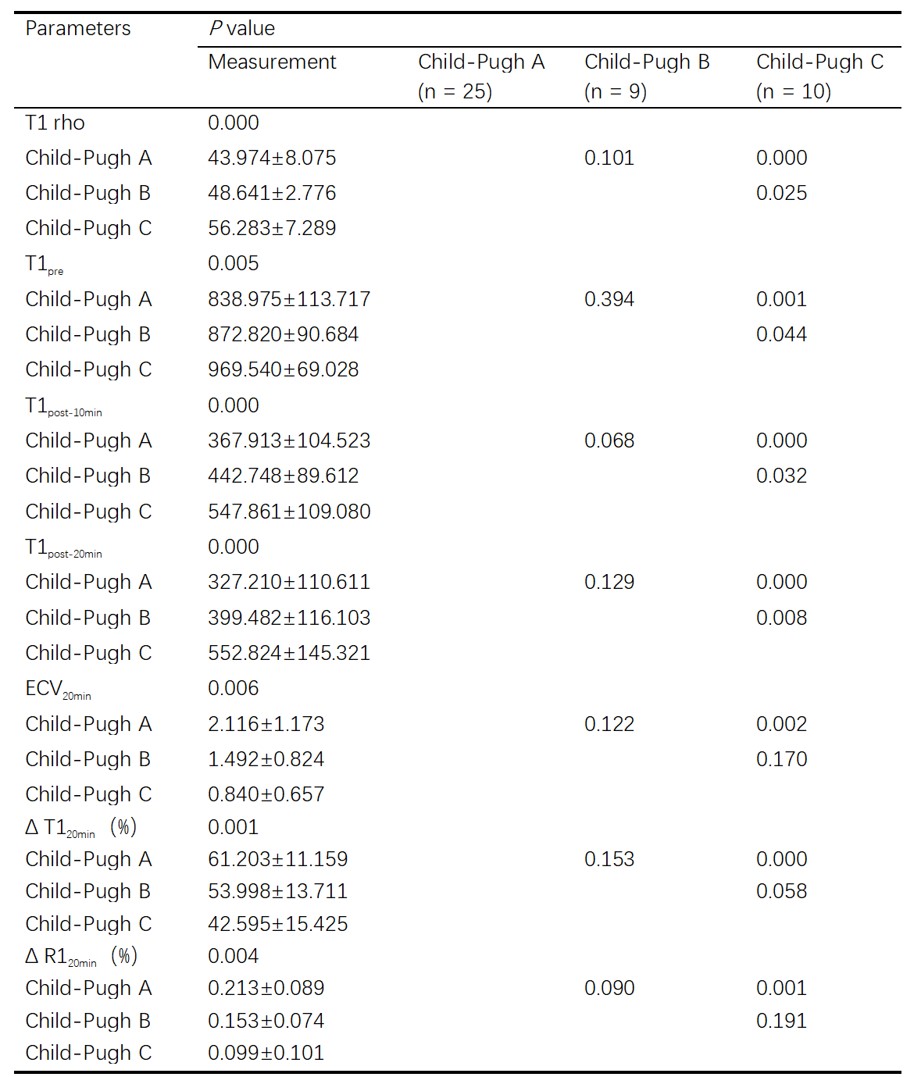
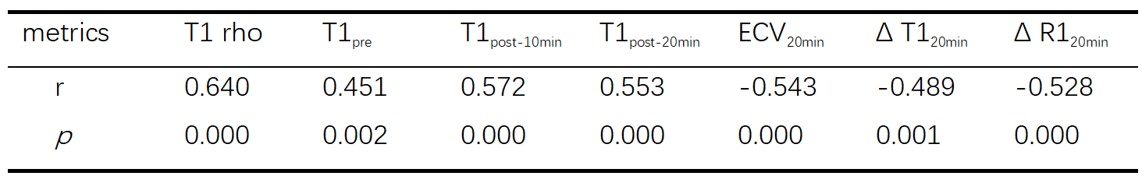
The mean and standard deviation (SD) of T1 rho, T1pre, T1post-10min, T1post-20min, ECV20min, Δ T120min, Δ R120min in different Child-Pugh grade were shown in Table 1. There were significant differences in all metrics between Child-Pugh A and C, and significant differences in T1 rho, T1pre, T1post-10min, T1post-20min between Child-Pugh B and C (P < 0.05). The correlation between liver Child-pugh grade and MR metrics was shown in Table 2. The ROC curves for differentiating Child-Pugh grade by using different metrics are shown in Fig. 2. The AUC values of T1 rho and T1 mapping related metrics of Child-Pugh grade are summarized in Table 3.Discussion
The progression of CLD caused by hepatitis B is a complex pathological change, which often leads to the abnormality of a variety of clinical laboratory metrics. To evaluate the liver reserve function through non-invasive imaging methods is a promising way to improve patient comfort, especially with those who suffer from contrast agent allergy or renal dysfunction. In this study, we found that there was a significant correlation between liver Child-pugh grade and MR metrics. T1 rho, T1pre, T1post-10min, T1post-20min, ECV20min, Δ T120min, Δ R120min can be used as evaluation indicators of liver reserve function. For comparison of different Child-pugh groups, the AUC of T1 rho is higher than the metrics related to T1 mapping. This mainly because that the T1 rho technique is sensitive to macromolecule-water interactions in protein solutions and biological tissues. Compared with T1 mapping, T1 rho may serve as a non-invasive imaging method and potential biomarker for biological processes associated with alterations in the macromolecular content properties of tissues, such as liver volume and cell swelling, and may also the increase of tissue necrosis[4,5], the corresponding tissue changes will occur with the increase of Child Pugh level in CLD patients. Simultaneously, Gd-EOB-DTPA-Enhanced T1 mapping is also an effective method to predict liver reserve function, as a supplement for patients with CLD[6]. It can quantify the changes of tissue T1 relaxation caused by Gd-EOB-DTPA after enhancement, which can reflect the uptake ability of liver cells to Gd-EOB-DTPA. Our results show that the combination of T1 rho and T1post-10min can significantly improve the diagnostic efficiency, which provides a better scheme for the accurate diagnosis of CLD patients.Conclusion
This study evaluated the diagnostic accuracy of T1 rho and Gd-EOB-DTPA Enhanced T1 mapping in evaluating liver reserve function of CLD. The results showed that T1 rho and T1 mapping related metrics had good diagnostic value. Furthermore, T1 rho combined with T1post-10min can improve the diagnostic efficiency.Acknowledgements
No acknowledgement found.References
[1] Suyama Y, Tomita K, Soga S, Kuwamura H, Murakami W, Hokari R, Shinmoto H. T1ρ magnetic resonance imaging value as a potential marker to assess the severity of liver fibrosis: A pilot study. Eur J Radiol Open. 2021 Jan 7;8:100321.
[2] Zhou ZP, Long LL, Qiu WJ, Cheng G, Huang LJ, Yang TF, Huang ZK. Evaluating segmental liver function using T1 mapping on Gd-EOB-DTPA-enhanced MRI with a 3.0 Tesla. BMC Med Imaging. 2017 Mar 1;17(1):20.
[3] Mesropyan N, Kupczyk PA, Dold L, Praktiknjo M, Chang J, Isaak A, Endler C, Kravchenko D, Bischoff LM, Sprinkart AM, Pieper CC, Kuetting D, Jansen C, Attenberger UI, Luetkens JA. Assessment of liver cirrhosis severity with extracellular volume fraction MRI. Sci Rep. 2022 Jun 8;12(1):9422.
[4] Takayama Y, Nishie A, Asayama Y, Ushijima Y, Okamoto D, Fujita N, Morita K, Shirabe K, Kotoh K, Kubo Y, Okuaki T, Honda H. T1 ρ Relaxation of the liver: A potential biomarker of liver function. J Magn Reson Imaging. 2015 Jul;42(1):188-95.
[5] Xie S, Qi H, Li Q, Zhang K, Zhang L, Cheng Y, Shen W. Liver injury monitoring, fibrosis staging and inflammation grading using T1rho magnetic resonance imaging: an experimental study in rats with carbon tetrachloride intoxication. BMC Gastroenterol. 2020 Jan 15;20(1):14.
[6] Breit HC, Block KT, Winkel DJ, Gehweiler JE, Henkel MJ, Weikert T, Stieltjes B, Boll DT, Heye TJ. Evaluation of liver fibrosis and cirrhosis on the basis of quantitative T1 mapping: Are acute inflammation, age and liver volume confounding factors? Eur J Radiol. 2021 Aug;141:109789.
Figures