1843
Machine Learning Stratification of Liver Stiffness using T2-weighted MRI Radiomic Data: A Multi-Site Study1Cincinnati Children's Hospital Medical Center, Cincinnati, OH, United States, 2University of Wisconsin-Madison, Madison, WI, United States, 3Michigan Medicine, University of Michigan, Ann Arbor, MI, United States, 4NYU Langone Health, New York, NY, United States
Synopsis
Keywords: Liver, Liver, Liver stiffness
MR elastography (MRE) offers a non-invasive approach to quantify liver stiffening, a surrogate for hepatic fibrosis. However, it has drawbacks, including long exam time, patient discomfort, and the need for additional hardware. The objective of this multi-site study is to develop a machine learning model to categorically stratify the severity of liver stiffness using clinical, routinely collected T2-weighted MRI data from pediatric and adult patients from four study sites. With radiomic features extracted from MRI data, our model achieved an AUROC of 0.72 for stratifying liver stiffness, demonstrating the potential of such a machine learning strategy for clinical utilization.Introduction
MR elastography (MRE) offers a non-invasive approach to quantify liver stiffness. It applies an active-passive driver system with the passive paddle placed over the right upper quadrant of the abdomen at the level of the costal margin to create transverse shear waves in the liver [1]. MRE allows more frequent longitudinal assessment of liver health and may reduce the need for liver biopsy in some patients. However, it has certain drawbacks, such as long exam time, patient discomfort, and the need for additional hardware [2]. Prior single-site studies [3, 4] have demonstrated machine learning approaches were able to stratify the severity of liver stiffening using T2-weighted MRI images. The objective of this multi-site study is to develop a machine learning model to categorically classify MR elastography-derived liver stiffness using T2-weighted MRI radiomic data from both pediatric and adult patients from four study sites.Methods
Study cohort and liver stiffness referenceThis was a retrospective multi-center IRB-approved, HIPAA-compliant study, with a waiver informed consent. Axial T2-weighted fast spin-echo fat-saturated MRI images from pediatric and adult patients and three different scanner manufacturers were extracted from the picture archiving and communication system (PACS) systems of four institutions/study sites, including Cincinnati Children's Hospital Medical Center [CCHMC], New York University [NYU], University of Michigan / Michigan Medicine [UM], and University of Wisconsin [UW] from 2011 through October 2020. Liver stiffness measurements obtained using MRE were retrieved for all patients from imaging reports in the electronic medical record (Epic Systems Corporation; Verona, WI for all sites) as the reference standard to categorize patients into two groups: no/mild liver stiffening <2.7 kPa or moderate/severe liver stiffening ≥2.7 kPa [5].
Extraction of MRI radiomic data
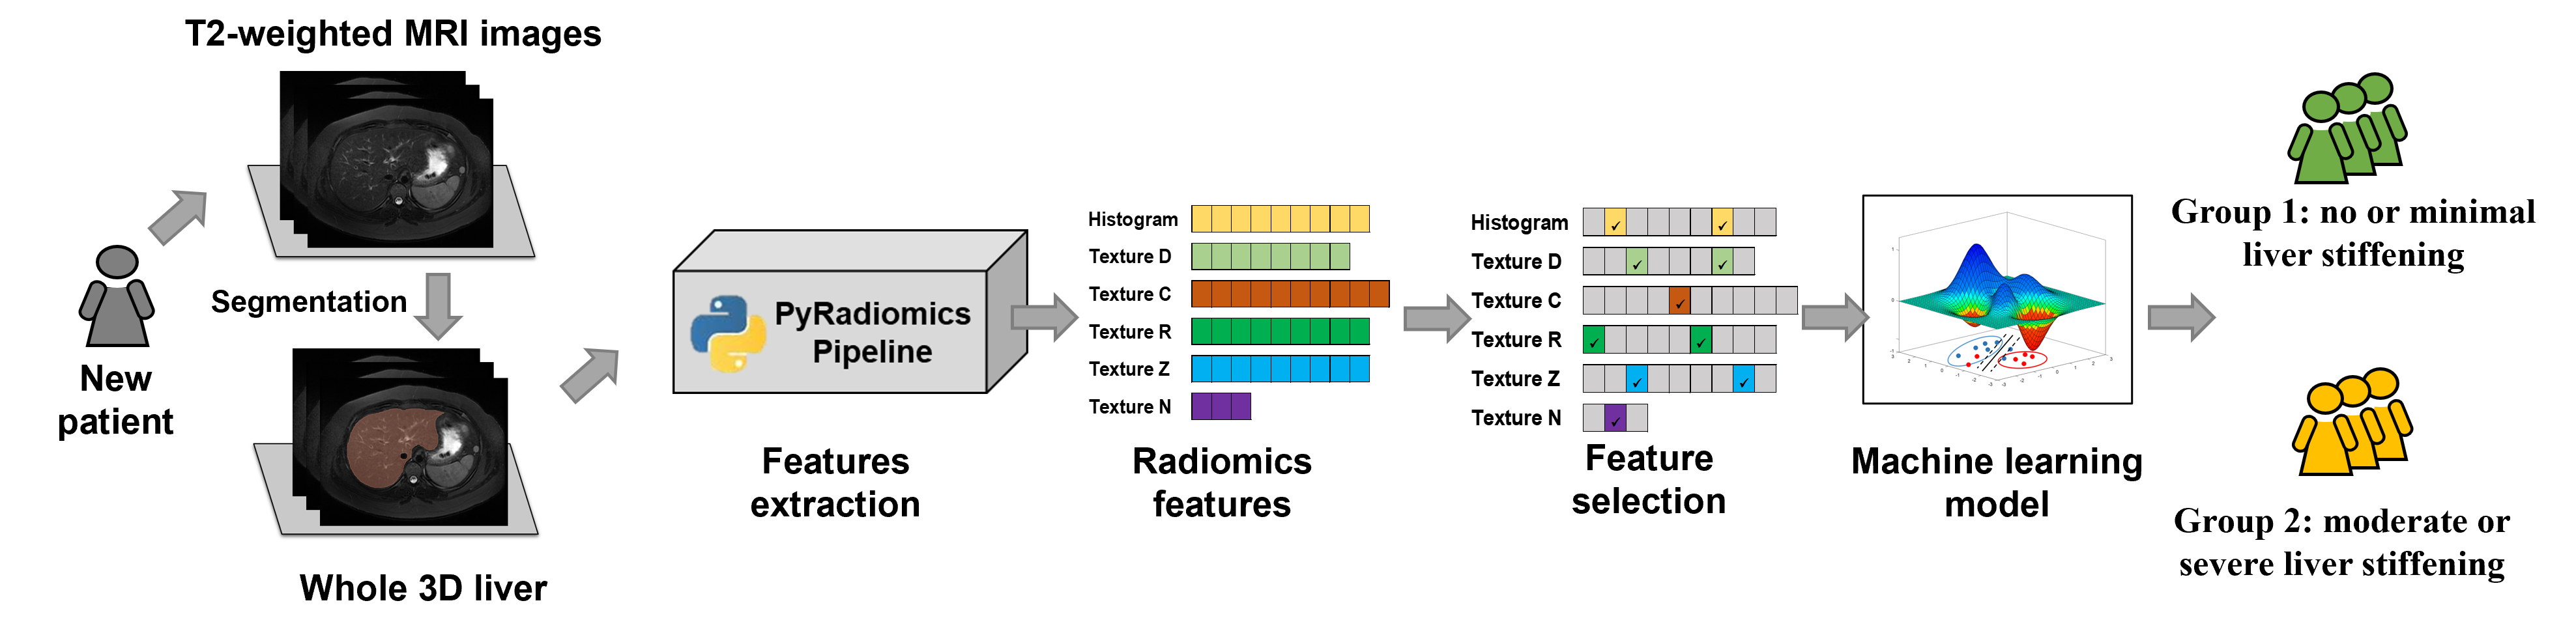
An overview of our study is illustrated in Figure 1. A data analyst manually segmented the liver on axial T2-weighted fast spin-echo fat-saturated MRI images, supervised by a board-certified radiologist. All segmentations were performed using 3D Slicer (version 4.11). Then, we used PyRadiomics (version 3.0.1) to extract agnostic radiomic features from each segmented liver. This resulted in a total of 100 agnostic features, including 14 shape features, 18 first-order histogram features of signal intensity distribution, and 68 second-order texture features (i.e., 14 features from the gray-level dependence matrix, 22 features from the gray-level co-occurrence matrix, 16 features from the gray-level run-length matrix, and 16 features from the gray-level size zone matrix). Furthermore, we applied a Laplacian of Gaussian (LoG) filter with sigma=[1, 3, 5] to enhance the original MRI images, and obtained the abovementioned 100 radiomic features from the LoG-enhanced images (i.e., higher-order radiomic features).
Machine learning model
Radiomic features from the segmented whole liver were used for machine learning model development. To prevent model overfitting, we conducted feature selection to reduce the number of radiomic features using the least absolute shrinkage and selection operator (LASSO) model [6]. Features with non-zero LASSO coefficients were kept as input features for the following models. Given the selected radiomics data and liver stiffness labels, a Support Vector Machine (SVM) model [7] was trained to classify a given patient into either a no/mild or moderate/severe liver stiffening group. Radiomic features extracted from original images and various LoG-enhanced images were utilized individually to optimize the model performance.
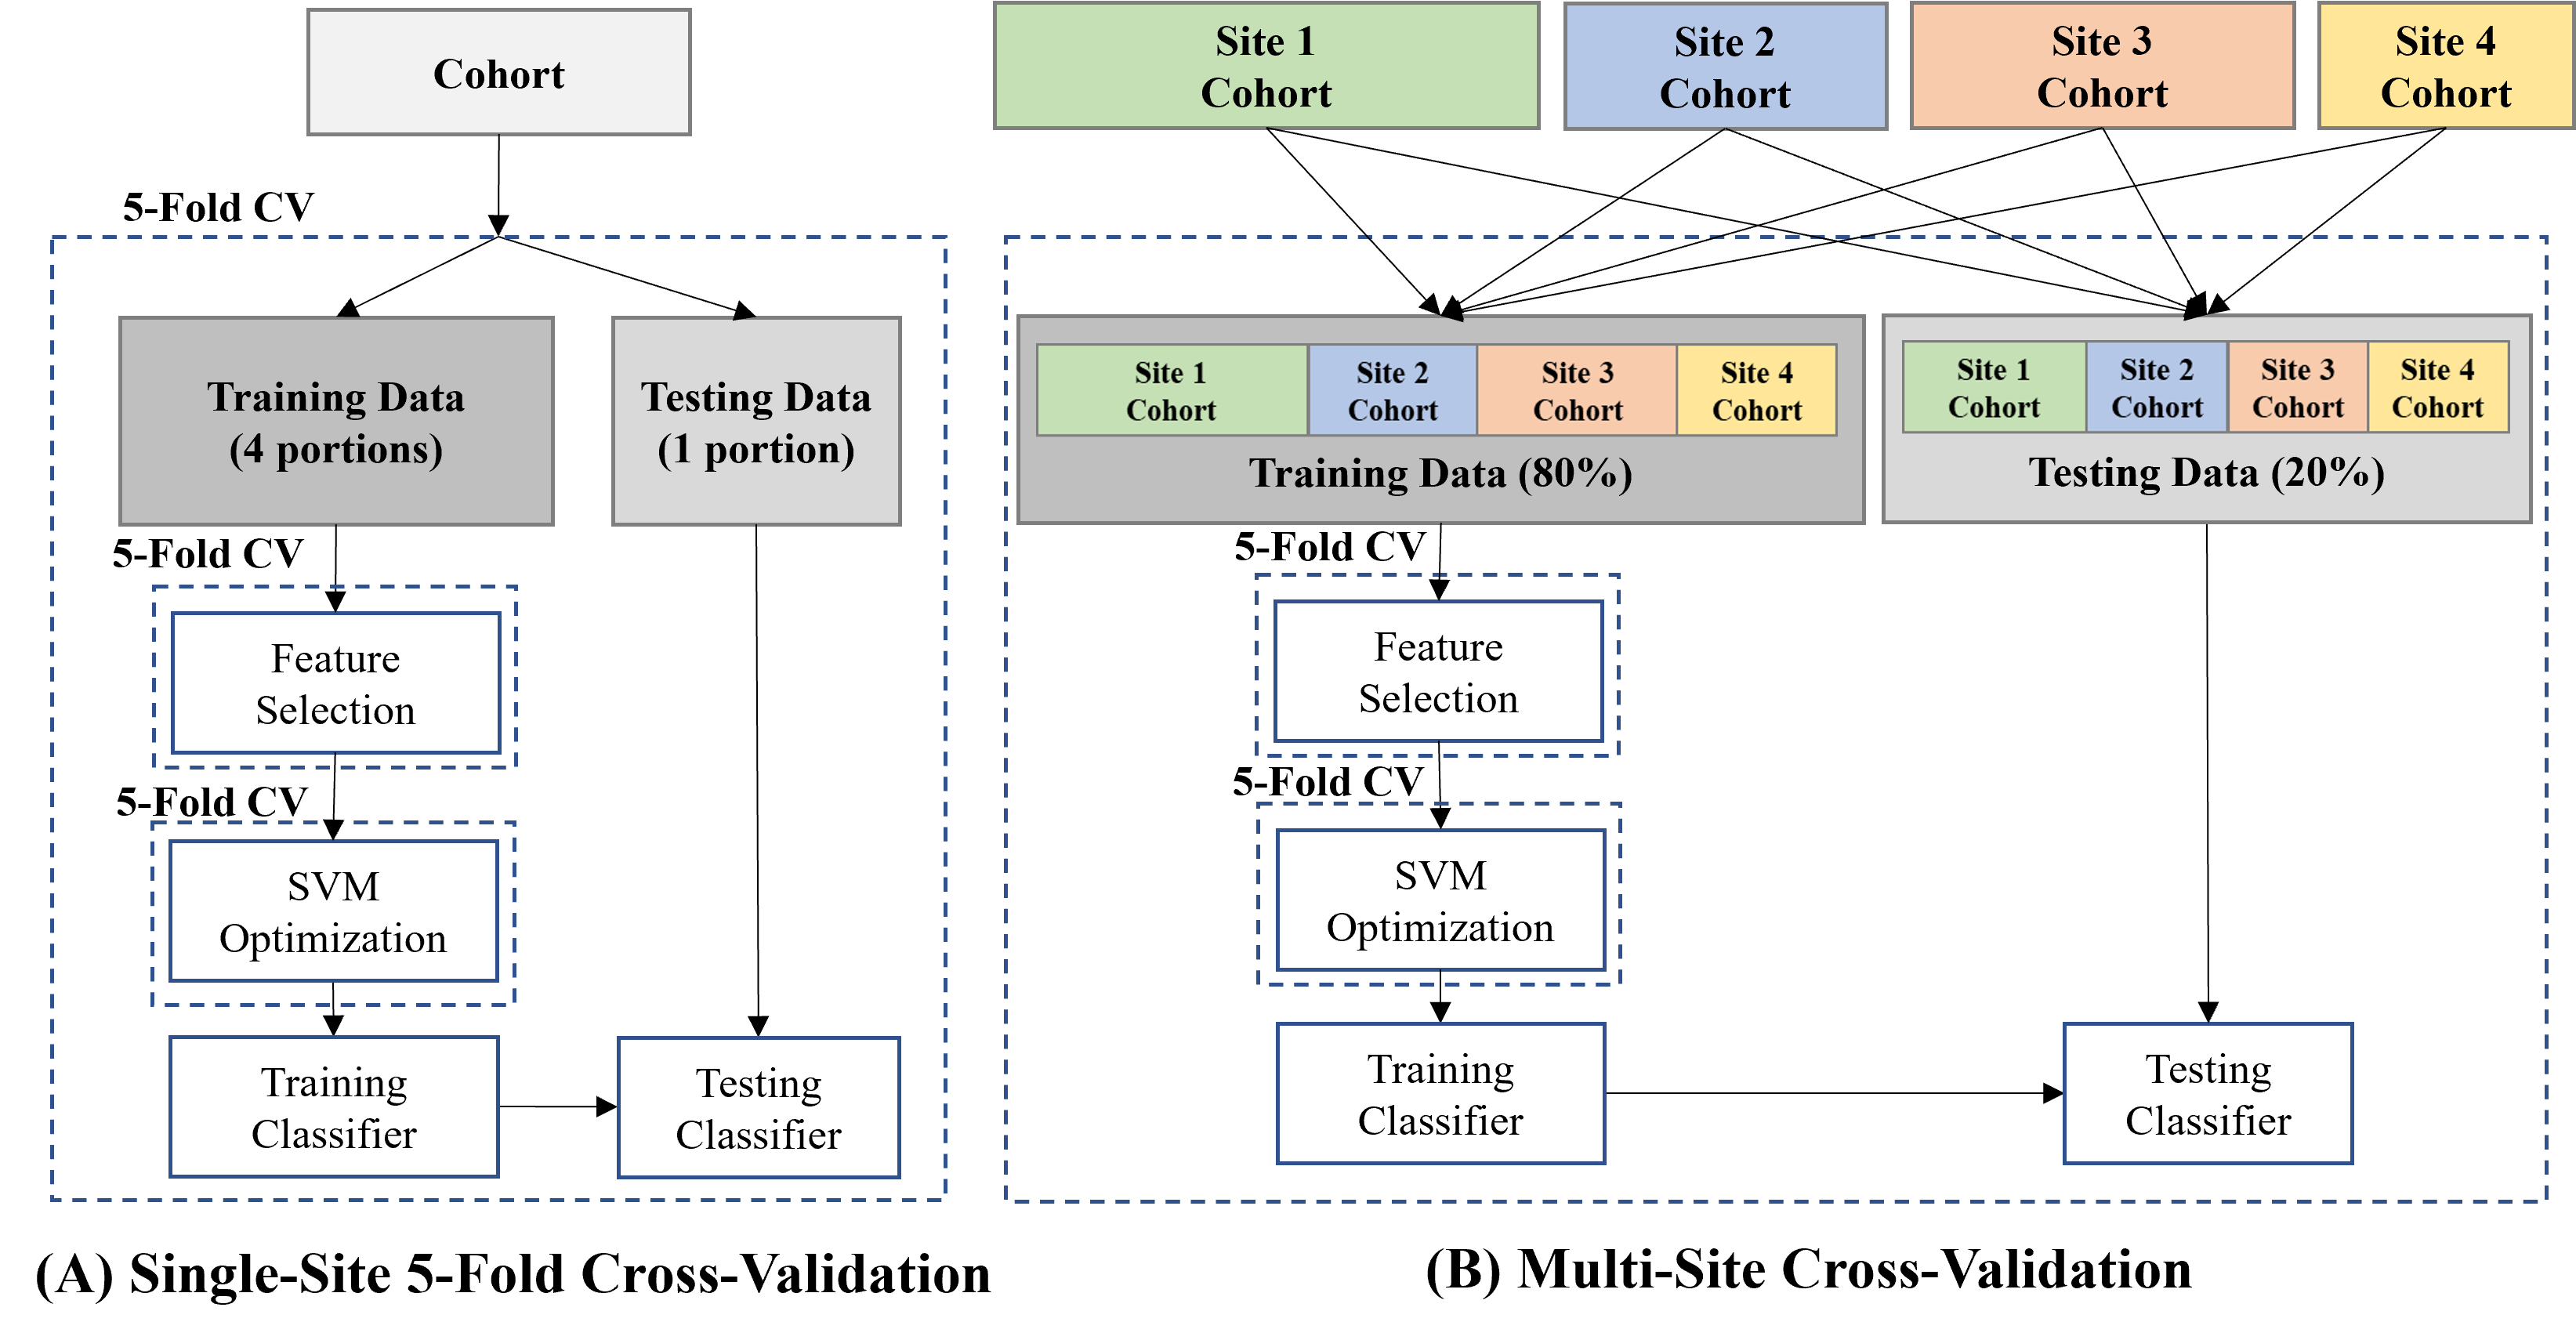
To evaluate the robustness of SVM models, we designed two evaluation strategies: A) single-site 5-fold cross-validation, and B) multi-site cross-validation (Figure 2). For the single-site 5-fold cross-validation, we split the dataset into 5 portions. One portion was used as test data, while the other 4 portions were used for model training and validation. This process was iteratively performed until all portions of data were used as testing data. The single-site 5-fold cross-validation was only applied to CCHMC dataset due to the limited sample sizes of three other sites. For multi-site cross-validation, subjects from four study sites were proportionally split into training, validation, and testing data while preserving the ratio of samples for each site and condition. All validation experiments were repeated 10 times. The performance of the SVM models was assessed using accuracy, sensitivity, specificity, and area under the receiver operating characteristic curve (AUROC).
Results
The study cohort consists of a total of 294 subjects from four study sites: CCHMC (n=177), NYU (n=39), UM (n=45), and UW (n=33). Additional demographic information for the cohorts of four study sites is listed in Table 1.In the single-site 5-fold cross-validation, our best SVM model achieved a balanced accuracy of 67.5%±2.4%, sensitivity of 61.3%±3.7%, specificity of 73.6%±3.2%, and AUROC of 0.72±0.03 on stratifying subjects with no/mild liver stiffening vs. moderate/severe liver stiffening. Additional results using different radiomic features are listed in Table 2.
In the multi-site cross-validation, the SVM model using features from LoG-enhanced images achieved a balanced accuracy of 66.7%±6.4%, sensitivity of 66.5%±7.7%, specificity of 66.9%±8.6%, and AUROC of 0.72±0.07 (Table 3).
Conclusion
With clinical, routinely collected T2-weighted MRI images, our machine learning strategy achieved 0.72 on AUROC in this multi-site study. A larger multi-site cohort is necessary to fully investigate the SVM model’s performance on T2-weighted MRI images. Future studies will also incorporate other image contrasts (e.g., T1-weighted images, diffusion-weighted images) as well as routinely acquired clinical data.Acknowledgements
This work was supported by the National Institutes of Health [R01-EB030582, R01-EB029944, R01-NS094200, and R01-NS096037]; Academic and Research Committee (ARC) Awards of Cincinnati Children's Hospital Medical Center. The funders played no role in the design, analysis, or presentation of the findings.References
1. Trout, A.T., et al., Diagnostic performance of MR elastography for liver fibrosis in children and young adults with a spectrum of liver diseases. Radiology, 2018. 287(3): p. 824-832.
2. Wang, M., et al., Imaging transverse isotropic properties of muscle by monitoring acoustic radiation force induced shear waves using a 2-D matrix ultrasound array. IEEE transactions on medical imaging, 2013. 32(9): p. 1671-1684.
3. He, L., et al., Machine Learning Prediction of Liver Stiffness Using Clinical and T2-Weighted MRI Radiomic Data. American Journal of Roentgenology, 2019: p. 1-10.
4. Li, H., et al., DeepLiverNet: a deep transfer learning model for classifying liver stiffness using clinical and T2-weighted magnetic resonance imaging data in children and young adults. Pediatr Radiol, 2020.
5. Xanthakos, S.A., et al., Use of magnetic resonance elastography to assess hepatic fibrosis in children with chronic liver disease. J Pediatr, 2014. 164(1): p. 186-8.
6. Tibshirani, R., Regression shrinkage and selection via the lasso. Journal of the Royal Statistical Society. Series B (Methodological), 1996: p. 267-288.
7. Cortes, C. and V. Vapnik, Support-vector networks. Machine learning, 1995. 20(3): p. 273-297.
Figures