1842
Towards Non-Invasive Diagnosis of NASH: Retrospective Fat Correction of MP2RAGE T1 Improves Correlation with Liver Fibrosis Stage1Medicine, Dalhousie University, Halifax, NS, Canada, 2Physics and Atmospheric Science, Dalhousie University, Halifax, NS, Canada, 3Diagnostic Radiology, Dalhousie University, Halifax, NS, Canada, 4Biomedical Translational Imaging Centre, Nova Scotia Health Authority, Halifax, NS, Canada, 5Pathology, Dalhousie University, Halifax, NS, Canada, 6General Internal Medicine, Dalhousie University, Halifax, NS, Canada
Synopsis
Keywords: Liver, Fat, Fibrosis
There is significant interest in non-invasive biomarkers for staging of liver fibrosis in non-alcoholic fatty liver disease (NAFLD) to reduce the need for biopsy. T1 correlates with fibrosis but can also be influenced by fat, and while Dixon fat-water separation can remove this effect, such methods are uncommon in clinical T1 mapping sequences. In this work, we demonstrate a retrospective correction to estimate the T1 of liver tissue based on MP2RAGE without fat-water separation. This enables fat compensation in a wider range of acquisitions and improves the potential clinical utility of T1 as a biomarker for liver fibrosis.Introduction
Non-alcoholic fatty liver disease (NAFLD) affects 20-30% of North Americans, of whom 10% progress to non-alcoholic steatohepatitis (NASH), characterized by inflammation with or without fibrosis [1]. Non-invasive biomarkers for staging of liver fibrosis in NAFLD patients would reduce the need for biopsy. Magnetic resonance elastography (MRE) yields maps of tissue stiffness that correlate with fibrosis [2], but needs specific hardware, reducing its accessibility. While T1 relaxation mapping can depict changes in liver fibrosis [3], T1 can also be altered by comorbidities such as iron and steatosis [4]. Dixon-based fat separation before T1 computation allows the influence of fat to be reduced or removed [5,6,7], but the required pulse sequences are not available on all clinical MRI systems. This study demonstrates how a retrospective correction can generate a synthetic water-only T1 value, based on a T1 measured without prospective fat compensation, an appropriate signal model and an estimate of the fat fraction. This correction is validated in patients who received fat-compensated T1 mapping, and is then applied to a larger cohort who underwent non-compensated T1 mapping, to determine whether the influence of fat on fibrosis staging is removed.Methods
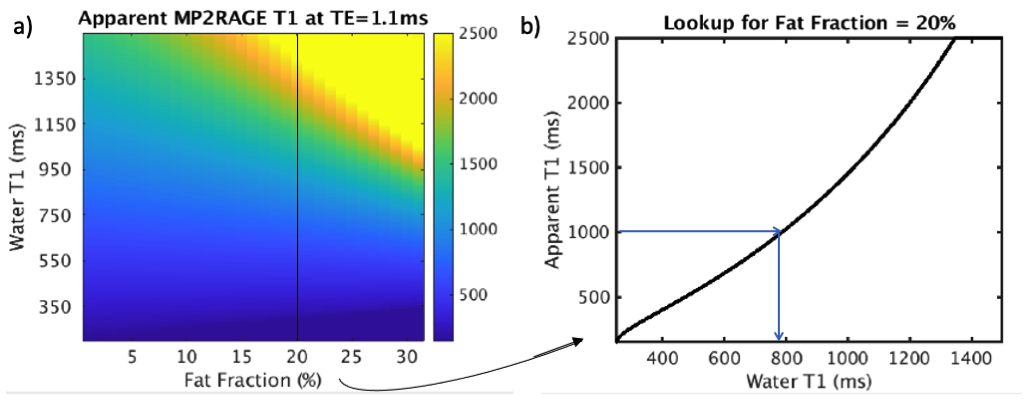
All data were acquired on a GE MR750 3T MRI scanner. T1 maps were acquired in 52 patients diagnosed with NAFLD who participated in a NSH REB-approved liver health study. Each patient’s fibrosis stage was obtained via recent biopsy (within 6 months) and assessed by a specialized hepatopathologist, staging from F0-F4 as per the NASH CRN scoring system [8]. 35 exams used MP2RAGE [9] without fat compensation, while 17 used a multi-echo readout to enable fat-water separation [5]. Relevant scan parameters include: 400x400x240 mm FOV, 160x160x24 matrix, 3x2 parallel imaging, TR=4.8ms, TI=500/2300ms, TE=1.1ms (for single-echo acquisition) or TE=1.1ms/2.2ms (for multi-echo). Liver fat fraction was measured using IDEAL IQ [10].In all patients, regions of interest (ROIs) were drawn in each segment of the liver using 3D Slicer. For the 17 patients who received multi-echo MP2RAGE, uncorrected T1 values (based on the 1.1ms out-of-phase echo) and water-only T1 values (based on both echoes) were calculated for each ROI [5], and averaged across all segments. A dictionary was created in Matlab based on the MP2RAGE signal equation [8], such that each combination of water T1 and fat fraction yield an uncorrected T1 (Figure 1). By providing the uncorrected T1 at a given echo time and fat fraction, the corrected T1 is estimated via dictionary lookup. Uncorrected and corrected T1 values were compared to the water T1 obtained after fat separation, with differences evaluated using a Wilcoxon signed-rank test.
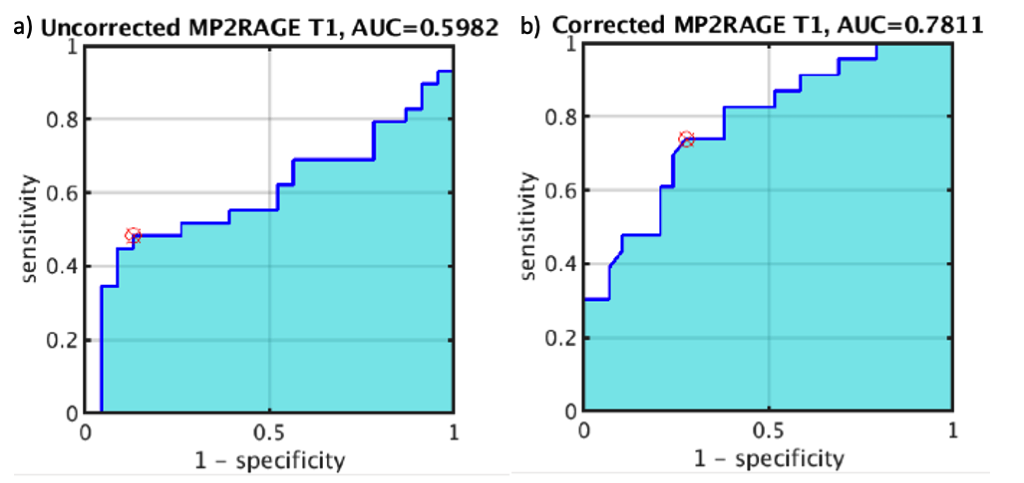
The process was then applied to the complete dataset of 52 patients, including those for whom a water T1 was not known. Performance was evaluated by comparing corrected T1 values to the measured fat fraction, to check for a reduced slope when fit to a linear model. T1 values were compared to the fibrosis stage to identify significant differences between stages before and after correction (with a two-sided T test), and to assess the performance of T1 as a predictor of advanced fibrosis (stage>=3) via receiver operating characteristic (ROC) curves.
Results and Discussion
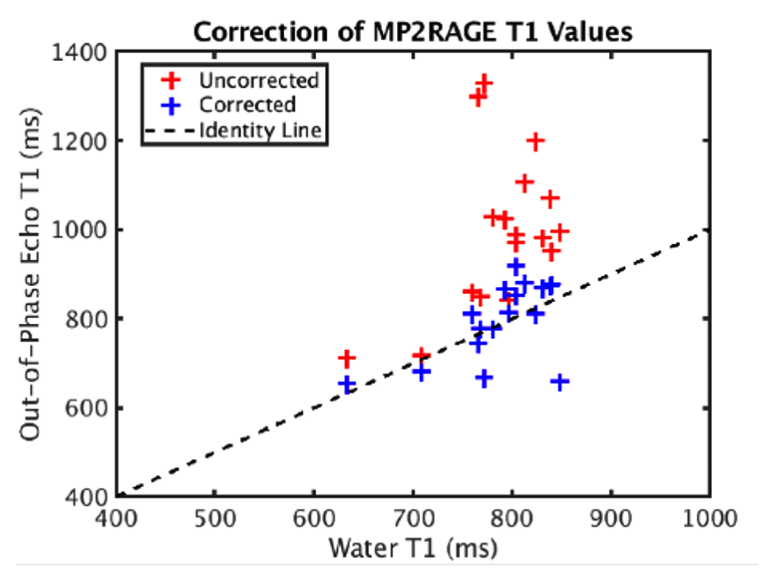
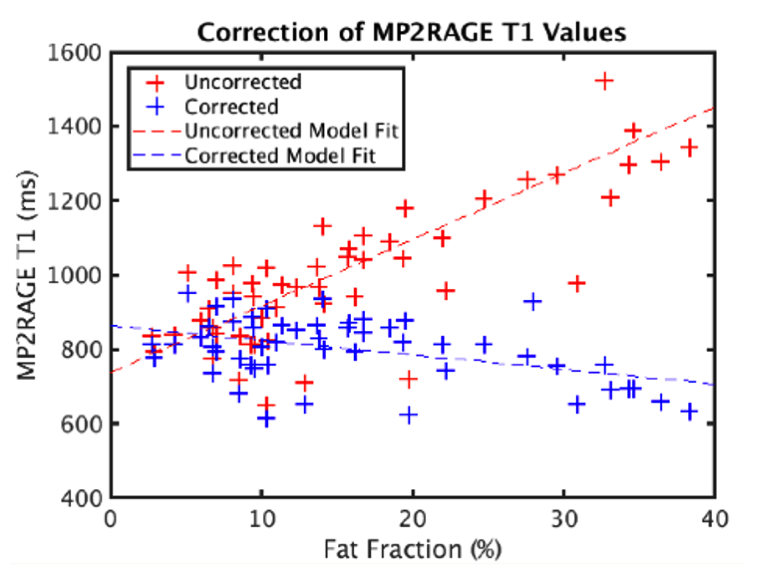
Figure 2 illustrates the performance of the correction process when the water T1 is known. Prior to correction, T1 values from the out-of-phase echo overestimate the water T1; the median difference is non-zero with p<0.0001. After correction, the values are in much greater agreement and the Wilcoxon signed-rank test showed no significant difference (p=0.45).When the same correction is applied to the entire cohort (Figure 3), the correlation between the corrected T1 value and the fat fraction is reduced; the R^2 of the linear model fit drops from 0.5 to 0.2 and the slope changes from +18 to -4. The T1 values at higher fat fraction appear to be over-corrected. This may be because the fat T1 value used in dictionary generation is assumed to be 400ms [11], which may not always be accurate.
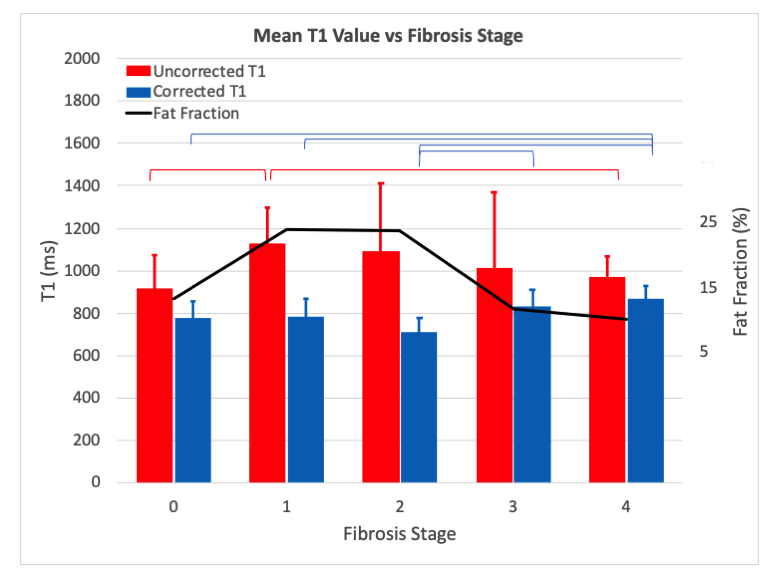
Mean T1 values grouped by fibrosis stage are plotted in Figure 4. Uncorrected T1 values initially increase with fibrosis stage as expected, but then decrease as the fat fraction in these patients’ livers also decreases [2]. The corrected T1 values remove this trend and exhibit significant differences between the lower (T1=764 +/- 82ms) and higher (849 +/- 69ms) fibrosis stages as expected [3]. Figure 5 shows ROC curves for distinguishing advanced fibrosis (stage >=3) with AUC=0.6 before correction and AUC=0.78 after, highlighting the potential of corrected T1 values for predicting fibrosis stage prior to biopsy.
While this analysis used the mean liver T1 across ROIs from all segments, we are currently investigating whether there are significant differences between segments. Correction of T1 values for other organs such as the pancreas, and for other T1 mapping methods such as 3-TI MPRAGE [12], should also be possible with this procedure.
Conclusions
Using a dictionary-based correction, the water T1 of liver tissue can be estimated based on a single-echo MP2RAGE acquisition without fat-water separation. This enables fat compensation in a wider range of acquisitions and improves the potential clinical utility of T1 as a biomarker for liver fibrosis.Acknowledgements
Thanks to Dr. Kevork Peltekian and staff of the Division of Digestive Care and Endoscopy for assistance with patient recruitment. Funding support for patient scans was provided by the David Fraser Radiology Research Foundation, the Nova Scotia Health Research Fund, and the QEII Health Science Centre’s Department of Radiology 3T MRI Grant.References
1. Bellentani S. The epidemiology of non-alcoholic fatty liver disease. Liver Int 2017; 37 Suppl 1:81-84.
2. Hoffman DH, Ayoola A, et al. T1 mapping, T2 mapping and MR elastography of the liver for detection and staging of liver fibrosis. Abdominal Radiology 2020; 45:692–700.
3. Dennis A, Kelly MD et al. Correlations Between MRI Biomarkers PDFF and cT1 With Histopathological Features of Non-Alcoholic Steatohepatitis. Front Endocrinol 2021; 11:575843.
4. Ahn JH, Yu JS, et al. Effect of hepatic steatosis on native T1 mapping of 3T magnetic resonance imaging in the assessment of T1 values for patients with non-alcoholic fatty liver disease. Magn Reson Imaging 2021;80:1-8.
5. Duffy A, Costa A, et al. Fat-Compensated T1 Mapping of Non-Alcoholic Fatty Liver Disease with MPRAGE and MP2RAGE. Proc ISMRM 2022, #3366.
6. Feng L, Liu F, et al. Magnetization-prepared GRASP MRI for rapid 3D T1 mapping and fat/water-separated T1 mapping. Magn Reson Med 2021;86:97-114.
7. Wang N, Cao T et al. Six-dimensional, free-breathing multitasking multi-echo (MT-TE) MRI for whole-liver T1, PDFF and R2* quantification. Proc ISMRM 2021; #0609.
8. Kleiner DE, Brunt EM, et al. Design and validation of a histological scoring system for nonalcoholic fatty liver disease. Hepatology 2005; 41:1313–1321.
9. Marques JP, Kober T et al. MP2RAGE, a self bias-field corrected sequence for improved segmentation and T1-mapping at high field. NeuroImage 2010; 49: 1271-1281.
10. Reeder SB, Pineda AR, et al. Iterative decomposition of water and fat with echo asymmetry and least-squares estimation (IDEAL): application with fast spin-echo imaging. Magn Reson Med 2005;54(3):636–44.
11. Bojorquez JZ, Bricq S, et al. What are normal relaxation times of tissues at 3T? Magn Reson Imaging 2017;35:69-80.
12. Liu JV, Bock NA, Silva AC. Rapid high-resolution three-dimensional mapping of T1 and age-dependent variations in the non-human primate brain using magnetization-prepared rapid gradient-echo (MPRAGE) sequence. NeuroImage 2011; 56:1154-1163.
Figures