1841
Automatic Extraction of Liver Parenchyma and R2* Estimation using Deep Learning for UTE Imaging for Assessment of Hepatic Iron Overload1The University of Memphis, Memphis, TN, United States, 2St. Jude Children's Research Hospital, Memphis, TN, United States, 3Cincinnati Children’s Hospital Medical Center, CINCINNATI, OH, United States, 4University of New South Wales, Sydney, Australia
Synopsis
Keywords: Liver, Liver, Deep Learning, Vessel Segmentation, R2*, HIC
Ultra-short echo time (UTE) imaging increases the accuracy of R2*-based hepatic iron content (HIC) quantification in cases of high iron overload when conventional GRE sequences can fail due to rapid signal decay. Segmenting whole liver to estimate liver R2* requires human expert and is time consuming. In this study, we trained a convolutional neural network (CNN) to automatically segment the liver parenchyma on radial UTE acquisitions using magnitude images and R2* maps. Our results show an excellent agreement between manual and CNN-based liver segmentation and mean R2* values, hence demonstrating the potential of our proposed method for automated HIC assessment.Introduction
Quantification of hepatic iron content (HIC) using R2*-MRI is an alternative to liver biopsy. Multi-echo gradient echo (GRE) sequences are typically used to measure R2*-based HIC, however, they can produce inaccurate R2* values or fail at high iron overload conditions (HIC >15 mg Fe/g) due to rapid signal decay before the shortest possible TE ~1.0 ms.1 Alternatively, ultra-short echo time (UTE) imaging with TEs as short as 0.1 ms has been reported to increase the accuracy of R2* quantification in cases of high iron overload.2 Another benefit of UTE is that it is based on radial sampling making it robust to motion, and thus, can be performed under free breathing (FB).2,3 Mean liver R2* values are estimated by manually drawing region-of-interest (ROI) either on a small homogenous area of liver without vessels4,5 or the whole liver and excluding vessels using postprocessing.3,5,6 Although the whole liver ROI reduces the inter-reviewer variability,6 both methods still require a trained expert and are time consuming. The objective of this study is to automate the segmentation of whole liver parenchyma on FB UTE acquisitions using convolutional neural network (CNN) for improving the workflow and accuracy of R2*-based HIC reporting for clinical diagnosis and treatment of iron overload.Materials and Methods
One hundred forty-three 2D multi-echo UTE datasets were collected retrospectively from patients with suspected iron overload.7 The liver was manually segmented by drawing a whole liver ROI encompassing the entire liver on the 2D cross-sectional image and is used as the ground truth mask. R2* maps were calculated using a monoexponential model with noise subtraction.2,7 A two-dimensional U-Net CNN8 was trained for liver segmentation independently on both magnitude images (mag-U-Net) and R2*-maps (R2*-U-Net). All magnitude TE images were used as an independent input to the CNN because they had different image contrasts. The images had dimension of 192x192 and were normalized to (0-1) range. Data augmentation using rotation (±30°), zoom (±0.1) and shear (±15°) was applied for the training process.The U-Net architecture consisted of five up-sampling and down-sampling layers with kernel size of three and number of filters between up-sampling layers was increased by 2n. Batch normalization and dropout was applied after each layer. Training was performed using 10-fold cross-validation with early stopping and reduce learning rate (LR) on plateau with minimum LR of 0.0000001 callbacks for 300 epochs (batch size=64) using ADAM optimizer, initial LR=0.01 and combined loss function of dice-coefficient and binary cross-entropy. Transfer learning was applied on mag-U-Net to train on R2*maps with the same CNN parameters. After liver segmentation, Frangi filter was applied to remove vessels,5 and the mean R2* was calculated for the extracted liver parenchyma and was converted to HIC using published R2*-HIC calibration.9 One-way ANOVA was performed to compare the accuracy of the extracted liver areas and the mean R2* values between the two U-net techniques and the ground truth, with p<0.05 considered to be statistically significant.
Results and discussion
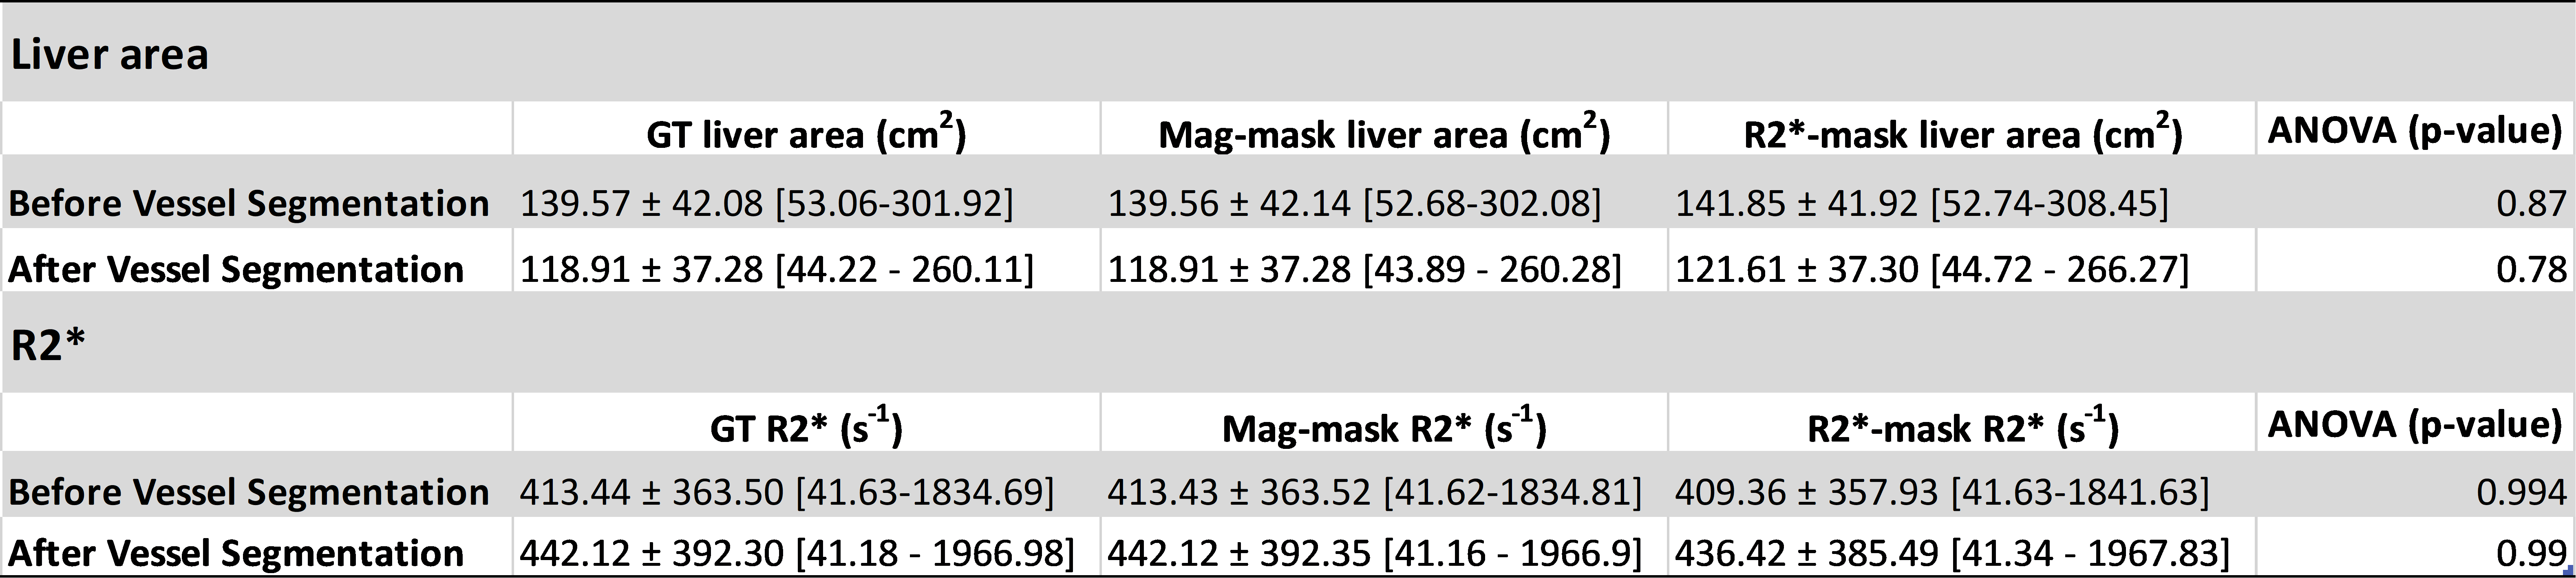
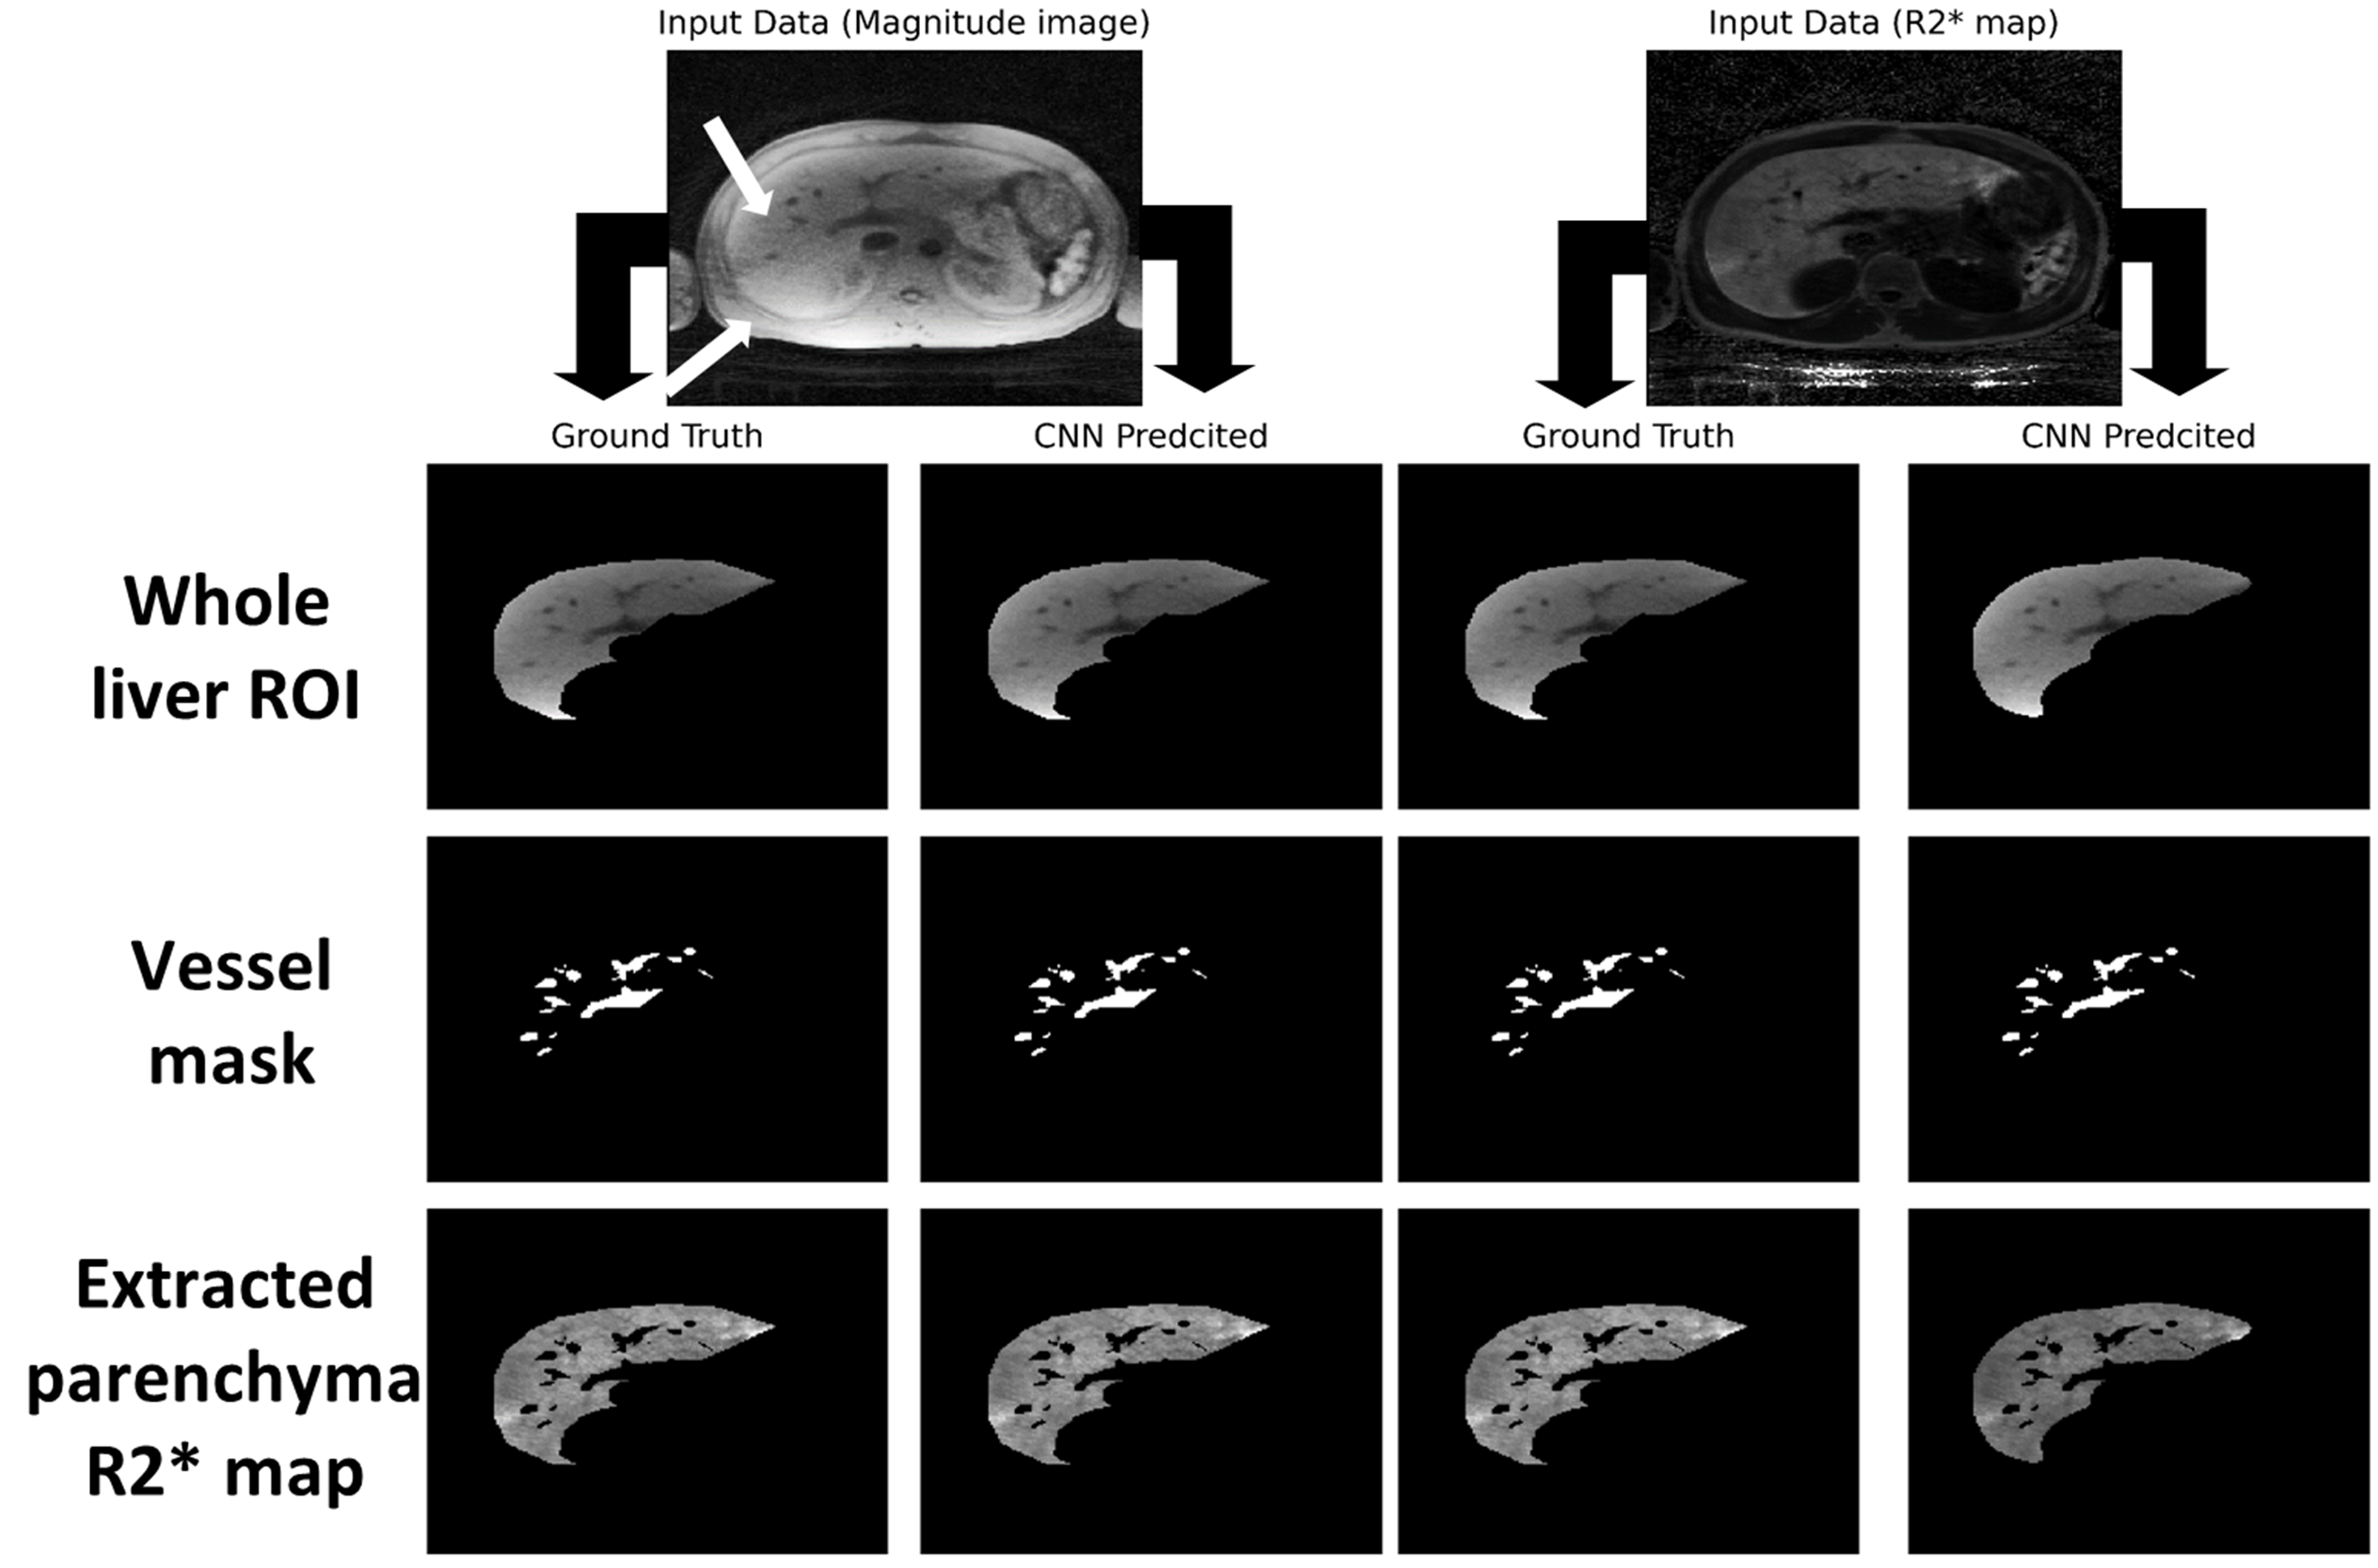
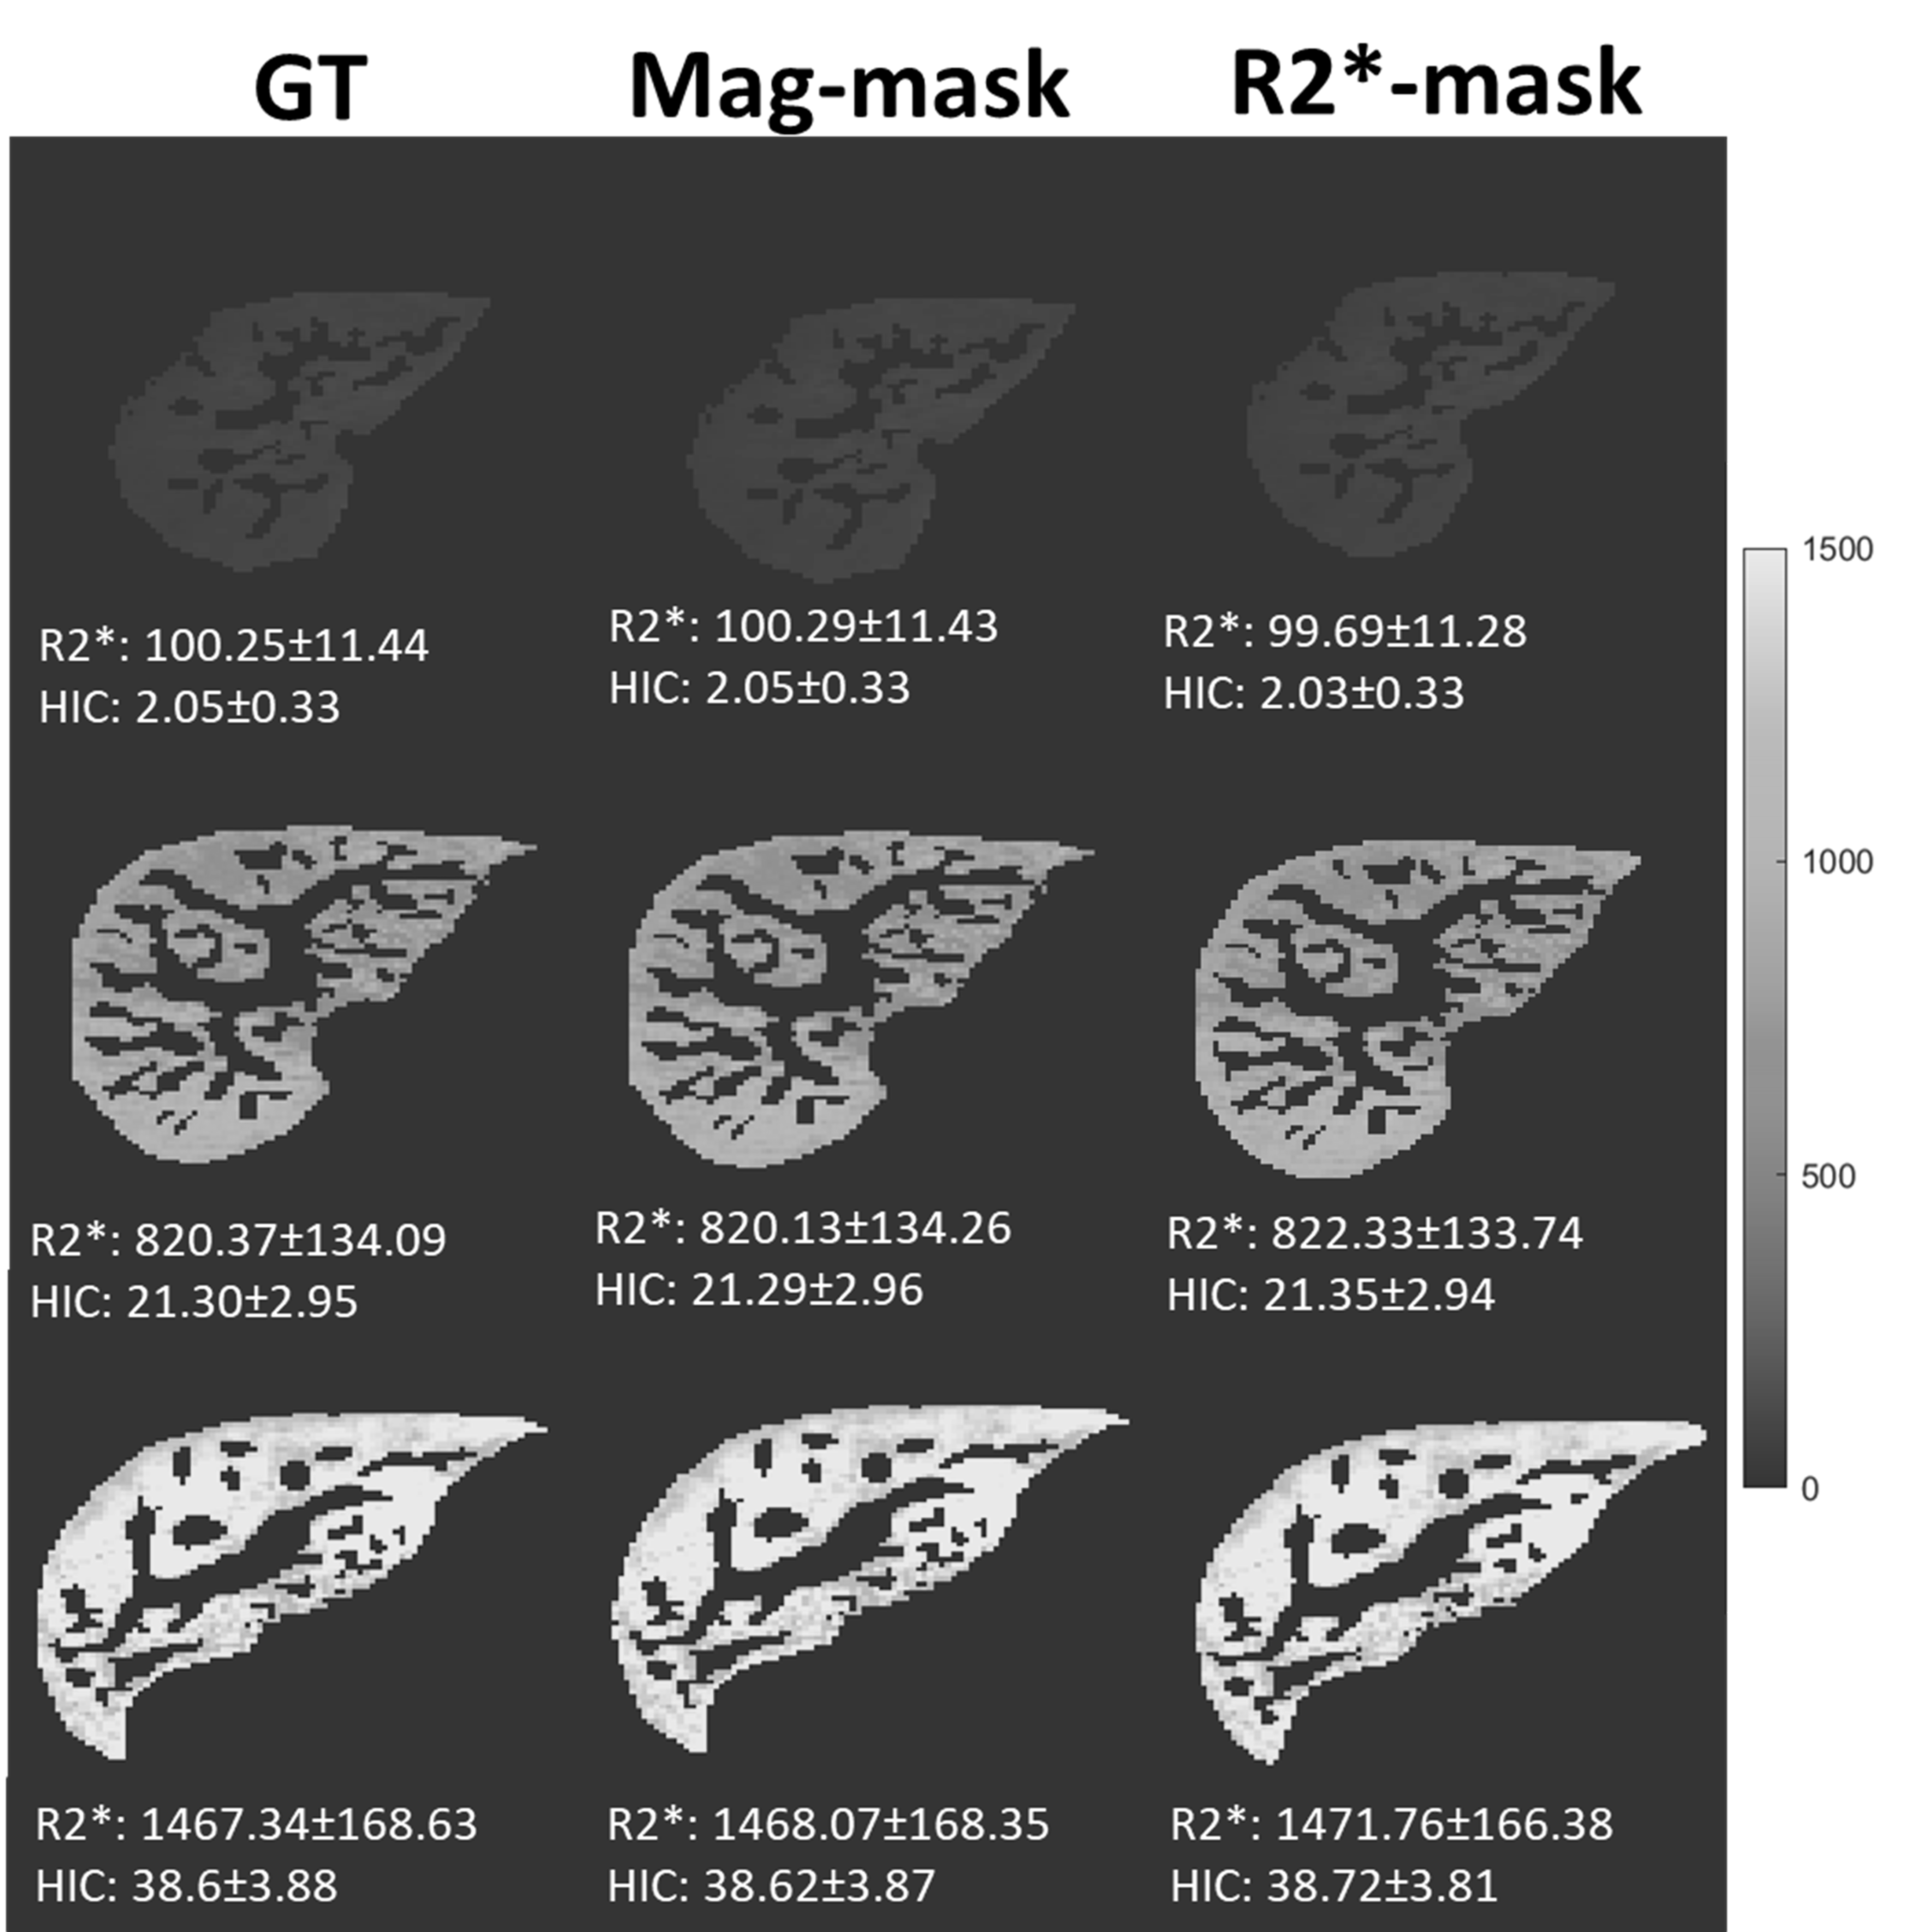
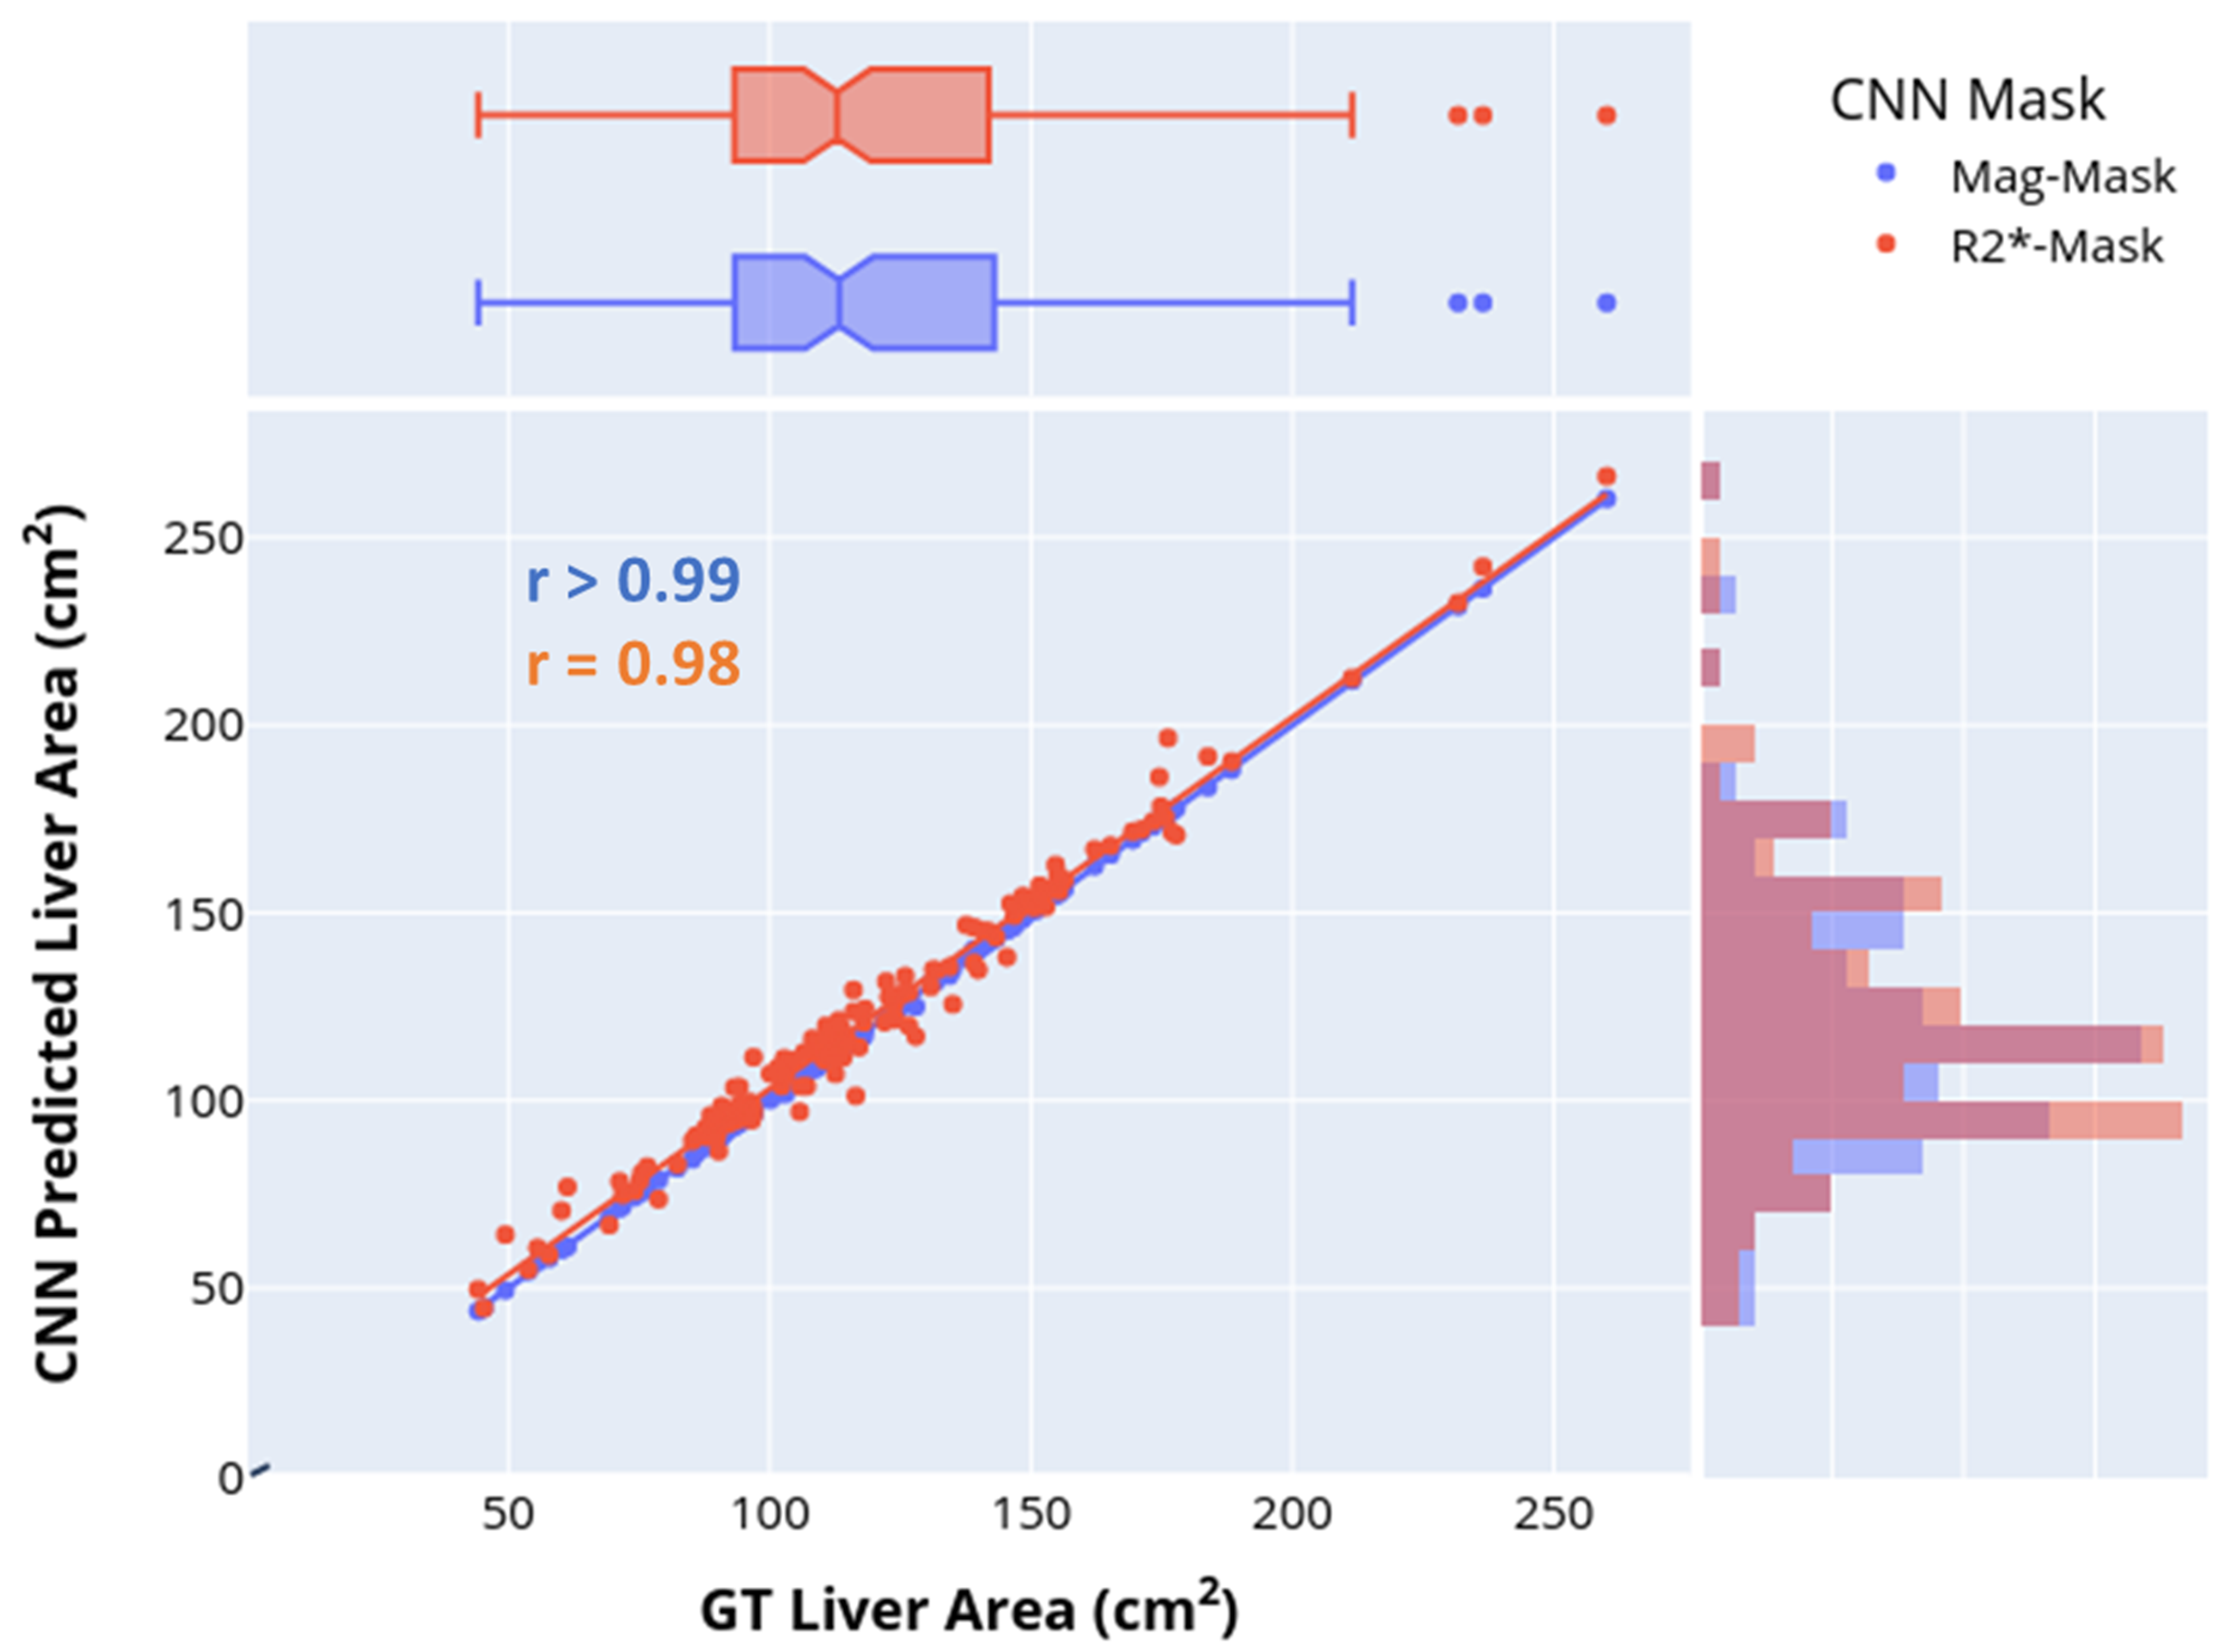
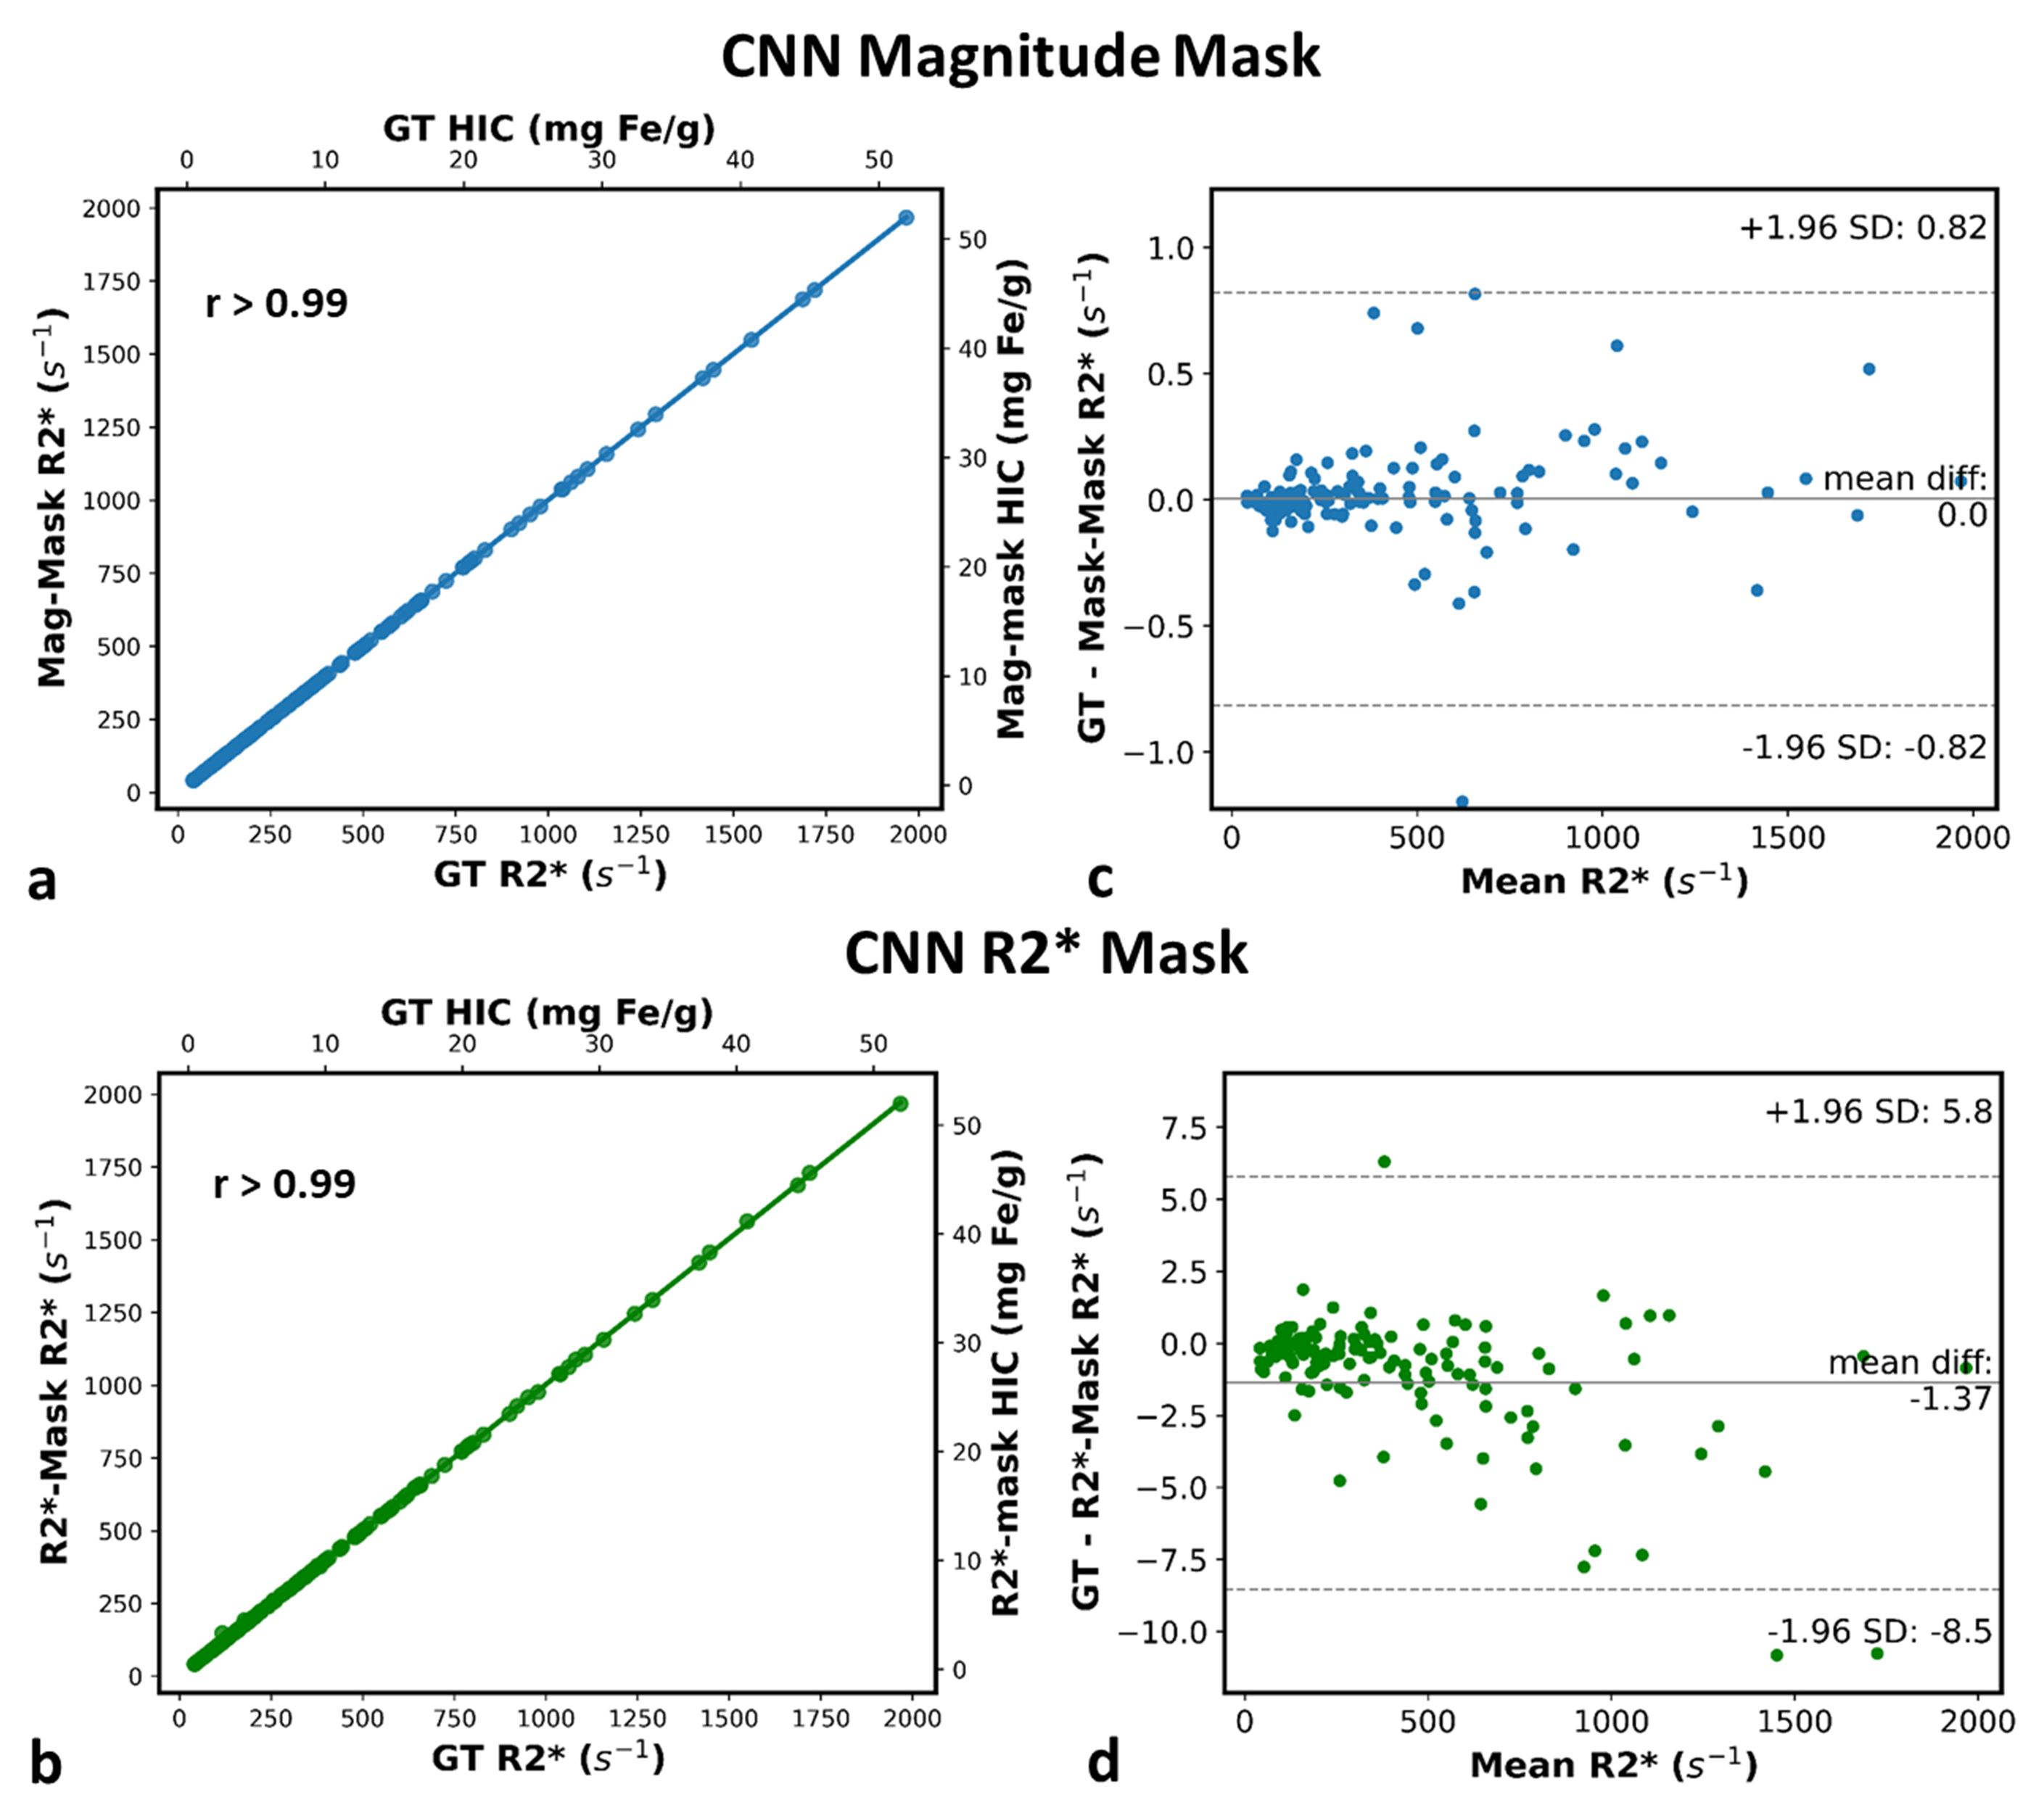
Representative images of the extracted parenchyma obtained using U-Nets trained on magnitude images and R2* maps along with their corresponding ground truth segmentation are shown in Fig. 1. The mean validation dice-score for magnitude and R2* based U-Net segmentations for the entire cohort were 0.98±0.02 and 0.92±0.12, respectively. Figure 2 shows that the extracted R2* maps and mean R2*/HIC values obtained with both U-Nets for mild, moderate and high iron overload cases were very similar and in close agreement with those obtained for ground-truth. For the entire cohort, the extracted liver area and the mean estimated R2* values using mag-U-Net and R2*-U-Net masks were not significantly different from the ground truth results for both before and after vessel segmentation (Table 1). The extracted liver areas and mean R2*/HIC values for both the U-Nets demonstrated excellent correlation (r>0.98) to ground truth segmentation with a mean bias close to zero and narrow limits of agreement. (Fig. 3, Fig. 4).Different deep learning techniques have been reported for segmenting liver parenchyma using Cartesian GRE acquisitions for automated R2* estimation,10,11 however, none of them were evaluated yet for radial UTE acquisition. Our study shows the feasibility of using U-Net to segment the whole liver and extract mean R2* values with high accuracy using both magnitude images at different TEs and only R2* maps using transfer learning. Some limitations are this study was performed on single slice 2D UTE data collected from a single center and a single scanner. Future work includes training and testing CNN liver segmentation and mean R2* estimation on 3D UTE and multi-center and multi-vendor data.
Conclusion
Our results show an excellent agreement between manual and U-Net based liver segmentation, hence demonstrating the accuracy and robustness of the CNN for automated parenchyma extraction and estimation of whole liver R2*. This automated technique can substantially improve radiologist workflow while reducing bias and inter-rater variability in the assessment of hepatic iron content, an important clinical parameter guiding iron removal therapy.Acknowledgements
No acknowledgement found.References
1. Wood JC, Enriquez C, Ghugre N, et al. MRI R2 and R2* mapping accurately estimates hepatic iron concentration in transfusion-dependent thalassemia and sickle cell disease patients. Blood. 2005;106(4):1460-1465.
2. Krafft AJ, Loeffler RB, Song R, et al. Quantitative ultrashort echo time imaging for assessment of massive iron overload at 1.5 and 3 Tesla. Magnetic resonance in medicine. 2017;78(5):1839-1851.
3. Tipirneni-Sajja A, Krafft AJ, McCarville MB, et al. Radial ultrashort TE imaging removes the need for breath-holding in hepatic iron overload quantification by R2* MRI. AJR American journal of roentgenology. 2017;209(1):187.
4. Schwenzer NF, Machann J, Haap MM, et al. T2* relaxometry in liver, pancreas, and spleen in a healthy cohort of one hundred twenty-nine subjects–correlation with age, gender, and serum ferritin. Investigative radiology. 2008;43(12):854-860.
5. Tipirneni‐Sajja A, Song R, McCarville MB, Loeffler RB, Hankins JS, Hillenbrand CM. Automated vessel exclusion technique for quantitative assessment of hepatic iron overload by‐MRI. Journal of Magnetic Resonance Imaging. 2018;47(6):1542-1551.
6. McCarville MB, Hillenbrand CM, Loeffler RB, et al. Comparison of whole liver and small region-of-interest measurements of MRI liver R2* in children with iron overload. Pediatric radiology. 2010;40(8):1360-1367.
7. Tipirneni‐Sajja A, Loeffler RB, Krafft AJ, et al. Ultrashort echo time imaging for quantification of hepatic iron overload: Comparison of acquisition and fitting methods via simulations, phantoms, and in vivo data. Journal of Magnetic Resonance Imaging. 2019;49(5):1475-1488.
8. Ronneberger O, Fischer P, Brox T. U-net: Convolutional networks for biomedical image segmentation. Paper presented at: International Conference on Medical image computing and computer-assisted intervention2015.
9. Hankins JS, McCarville MB, Loeffler RB, et al. R2* magnetic resonance imaging of the liver in patients with iron overload. Blood, The Journal of the American Society of Hematology. 2009;113(20):4853-4855.
10. Loeffler RB, McCarville MB, Tipirneni-Sajja A, Hankins JS, Hillenbrand CM. Automated MR HIC determination using deep learning and Frangi filters. Paper presented at: Proceedings of the 28th annual meeting of ISMRM2020.
11. Liu M, Vanguri R, Mutasa S, et al. Channel width optimized neural networks for liver and vessel segmentation in liver iron quantification. Computers in Biology and Medicine. 2020;122:103798.
Figures