1817
Quantification of APT and NOE(-3.5) using chemical exchange saturation transfer MRI with double saturation powers (DSP-CEST)
Yu Zhao1 and Zhongliang Zu1
1Vanderbilt University Medical Center, Nashville, TN, United States
1Vanderbilt University Medical Center, Nashville, TN, United States
Synopsis
Keywords: Quantitative Imaging, CEST & MT
In this study, we proposed a new data-postprocessing method to specifically quantify the APT and NOE effects based on two canonical CEST MRI acquisitions with double saturation powers (DSP). First, Numerical simulations based on Bloch equations is used to demonstrate that the proposed method can detect the APT and NOE effects with a removal of background signals from the direct water saturation (DS) and the semi-solid magnetization transfer (MT) and the CEST signals that originate from the fast-exchange pools. Then, an in vivo validation of the proposed method is conducted using an animal tumor model at a 4.7-T scanner.Purpose
Detections of the APT effect and the NOE(-3.5) effect with a high specificity are still challenging since their CEST signals are overlapped with background signals from the direct water saturation (DS) and the semi-solid magnetization transfer (MT) and the CEST signals that originate from the fast-exchange pools. In this study, we propose a data-postprocessing method to quantify the APT and NOE effects with a high specificity.Methods
In this study, we proposed a new data-postprocessing method to specifically quantify the APT and NOE(-3.5) effects based on two canonical CEST MRI acquisitions with double saturation powers (DSP), where the signal acquired at a low saturation power (ω1_L = 0.5 µT) is directly used for the label signal (SL) and the signal (SH) acquired at a high saturation power (ω1_H = 1 µT) is processed by a well-tailored mathematical transformation to create a reference signal (SR). This transformation is derived as,$$S_R\left(\omega_{R F}\right)=\frac{S_0}{1+\left(\frac{S_0}{S_H\left(\omega_{R F}\right)}-1\right) \frac{\omega_{1_L}^2}{\omega_{1_H}^2}} .$$
where ωRF is the frequency offset of the saturation RF relative to the water, and S0 is the control signal measured without the RF saturation. Apparent exchange-dependent relaxation (AREX) 1 is used to process the label and reference signals to quantify the CEST effects of the APT and NOE(-3.5),
$$A R E X_{D S P}\left(\omega_{R F}\right)=\left(\frac{S_0}{S_L\left(\omega_{R F}\right)}-\frac{S_0}{S_R\left(\omega_{R F}\right)}\right) R_{1 w}$$
The specificity of the proposed method to the APT and NOE effects are demonstrated with numerical simulations based on Bloch equations. Then, an in vivo validation of the proposed method for quantifying the APT and NOE(-3.5) effects is conducted using an animal tumor model. In the DSP-CEST MRI, after the signal preparation based on a rectangular RF saturation pulse with a duration of 5 seconds, single-shot spin-echo echo planar imaging (SE-EPI) is used for a 2D image readout with parameters: matrix size = 64 × 64, field of view = 30 × 30 mm2. DSP-CEST Z-spectra (ω1 = 0.5 µT and 1 µT) were acquired with the frequency offsets from -10 ppm to 10 ppm. An inversion recovery method is used to measure R1w, that was used for the calculation of the AREXDSP metric. All measurements were performed on a Varian 4.7T magnet with a 38-mm receive coil. The proposed method was compared with the Lorentzian difference (LD) analysis 2 that seek to obtain the reference signal by fitting the background DS and MT effects and has been developed to quantify the CEST and NOE effects.
Results and discussions
In Fig. 1, numerical simulations demonstrate how the background signals from the MT and fast-exchange amine (at 2.0 ppm) are suppressed in the DSP-CEST imaging of the APT and NOE(-3.5). The results show that AREXDSP is not influenced by the concentration of the MT and the amine. Fig. 2 show that the specificity of the proposed method can be kept for different concentrations and exchange rates of the APT and NOE. Fig. 3 shows images of R1w, MT pool size ratio, NOE(-3.5) and APT that are acquired from a typical rat bearing tumors. The maps of R1w, MT pool size ratio, AREXLD quantified NOE(-3.5) and AREXDSP quantified NOE(-3.5) exhibit hypointense intensities. Furthermore, Fig. 4 shows results of statistical analysis based on ROIs that were delineated from the tumors and the contralateral normal tissues in the rat brains. The R1w, MT pool size ratio, AREXLD and AREXDSP quantified NOE(-3.5) have significant differences (p < 0.05) between the tumors and the normal tissues. The NOE(-3.5) signal changes detected with the established LD and the DSP-CEST method are consistent, which demonstrates a feasibility the DSP-CEST method for the in vivo experiments. Furthermore, the Z-spectra acquired from the tumors and the contralateral normal tissues are displayed in Fig. 5. Note that although the background signals (beyond ± 5ppm) in the CEST Z-spectra have considerable differences, the corresponding DSP-CEST signals match well in the Z-spectra, which also observed in the simulations and suggests that the MT effects can be suppressed by the two methods. In the AREXLD and AREXDSP spectra, the APT at 3.5 ppm, the guanidinium CEST at 2 ppm (a fast-exchange site), the NOE at -1.6 and -3.5 ppm can be observed. Note that the ratio of the signal at 3.5 ppm to the signal at 2.0 ppm in the DSP-CEST Z-spectra is smaller than in the LD-CEST Z-spectra, which should be due to the suppression of the fast-exchange CEST effects at 2.0 ppm in the DSP-CEST.Conclusion
The proposed data-postprocessing method can quantify the APT and NOE effects with high specificities.Acknowledgements
No acknowledgement found.References
[1] Zaiss M, Zu ZL, Xu JZ, Schuenke P, Gochberg DF, Gore JC, Ladd ME, Bachert P. A combined analytical solution for chemical exchange saturation transfer and semi-solid magnetization transfer. NMR in biomedicine 2015;28(2):217-230.
[2] Jones CK, Huang A, Xu JD, Edden RAE, Schar M, Hua J, Oskolkov N, Zaca D, Zhou JY, McMahon MT, Pillai JJ, van Zijl PCM. Nuclear Overhauser enhancement (NOE) imaging in the human brain at 7 T. Neuroimage 2013;77(0):114-124.
Figures
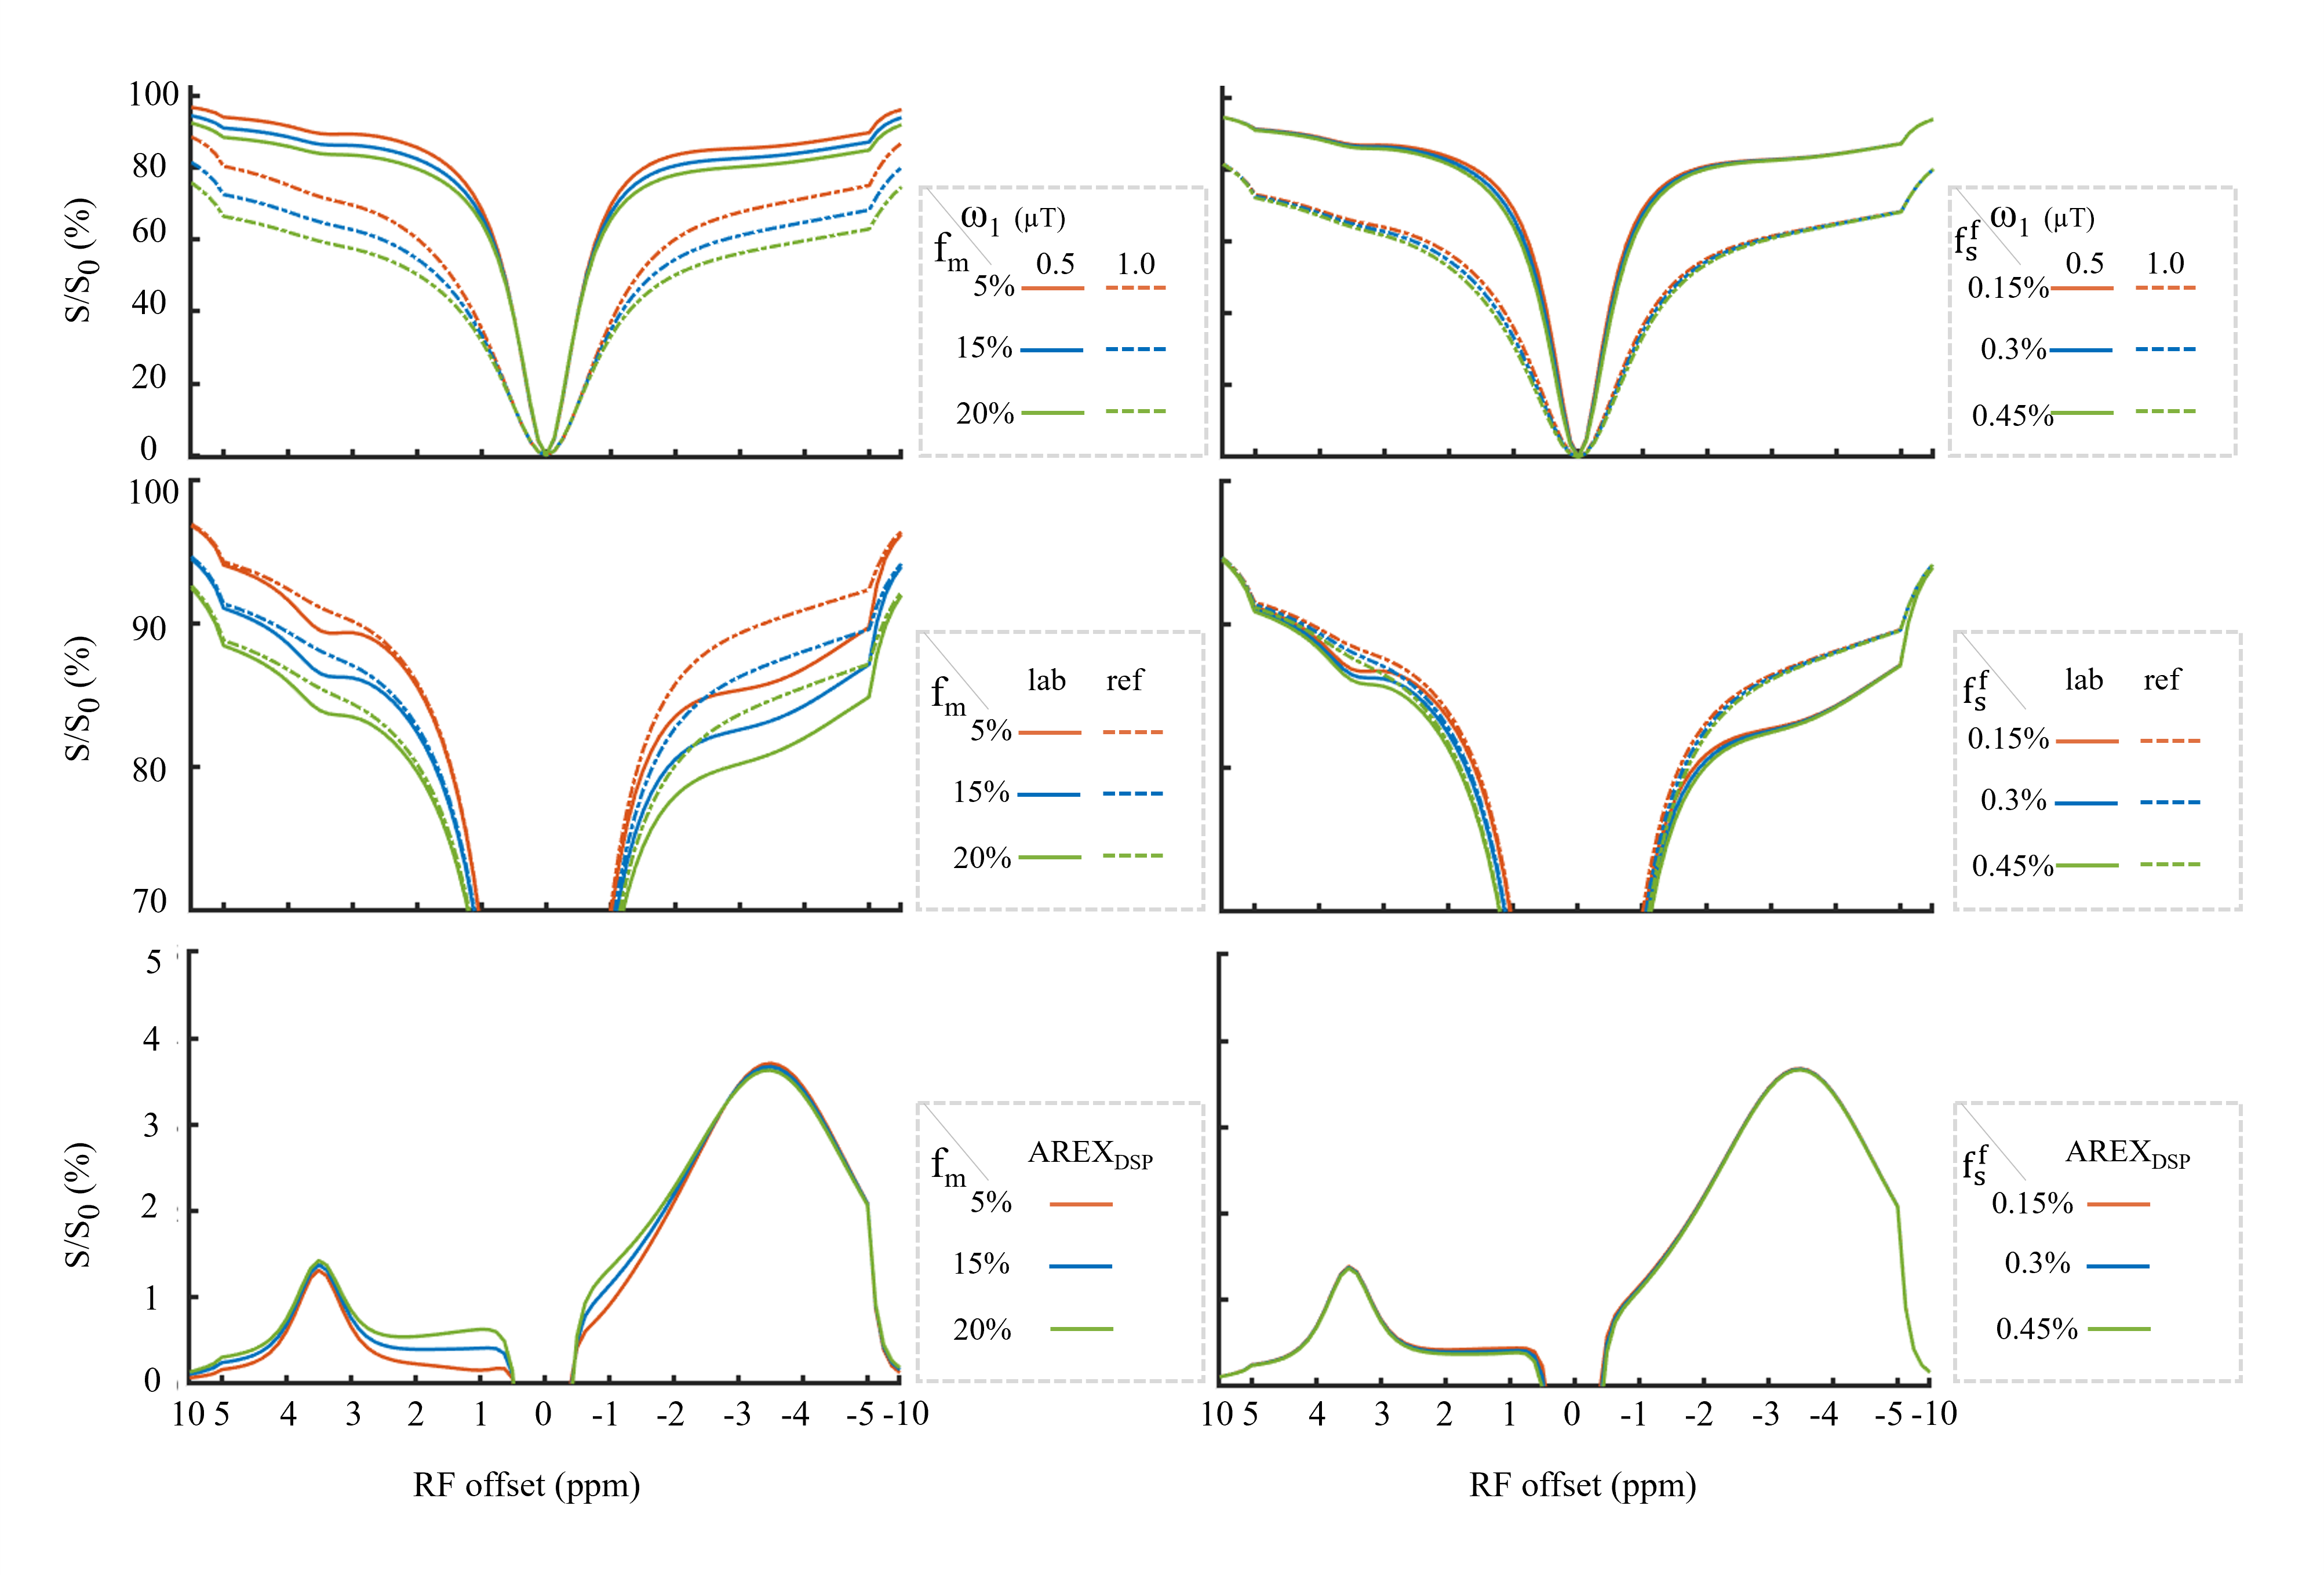
Fig. 1 simulated
CEST Z-spectra with ω1_L = 0.5 µT and ω1_H = 1 µT, the corresponding SL and SR spectra and the AREXDSP
spectra with different concentrations of the MT (left column) and different concentration of the fast-exchange amine (right column).

Fig. 2 the influences the MT and the fast-exchange amine on AREXDSP quantified signals for varied concentrations and varied exchange rates
of the APT and NOE.
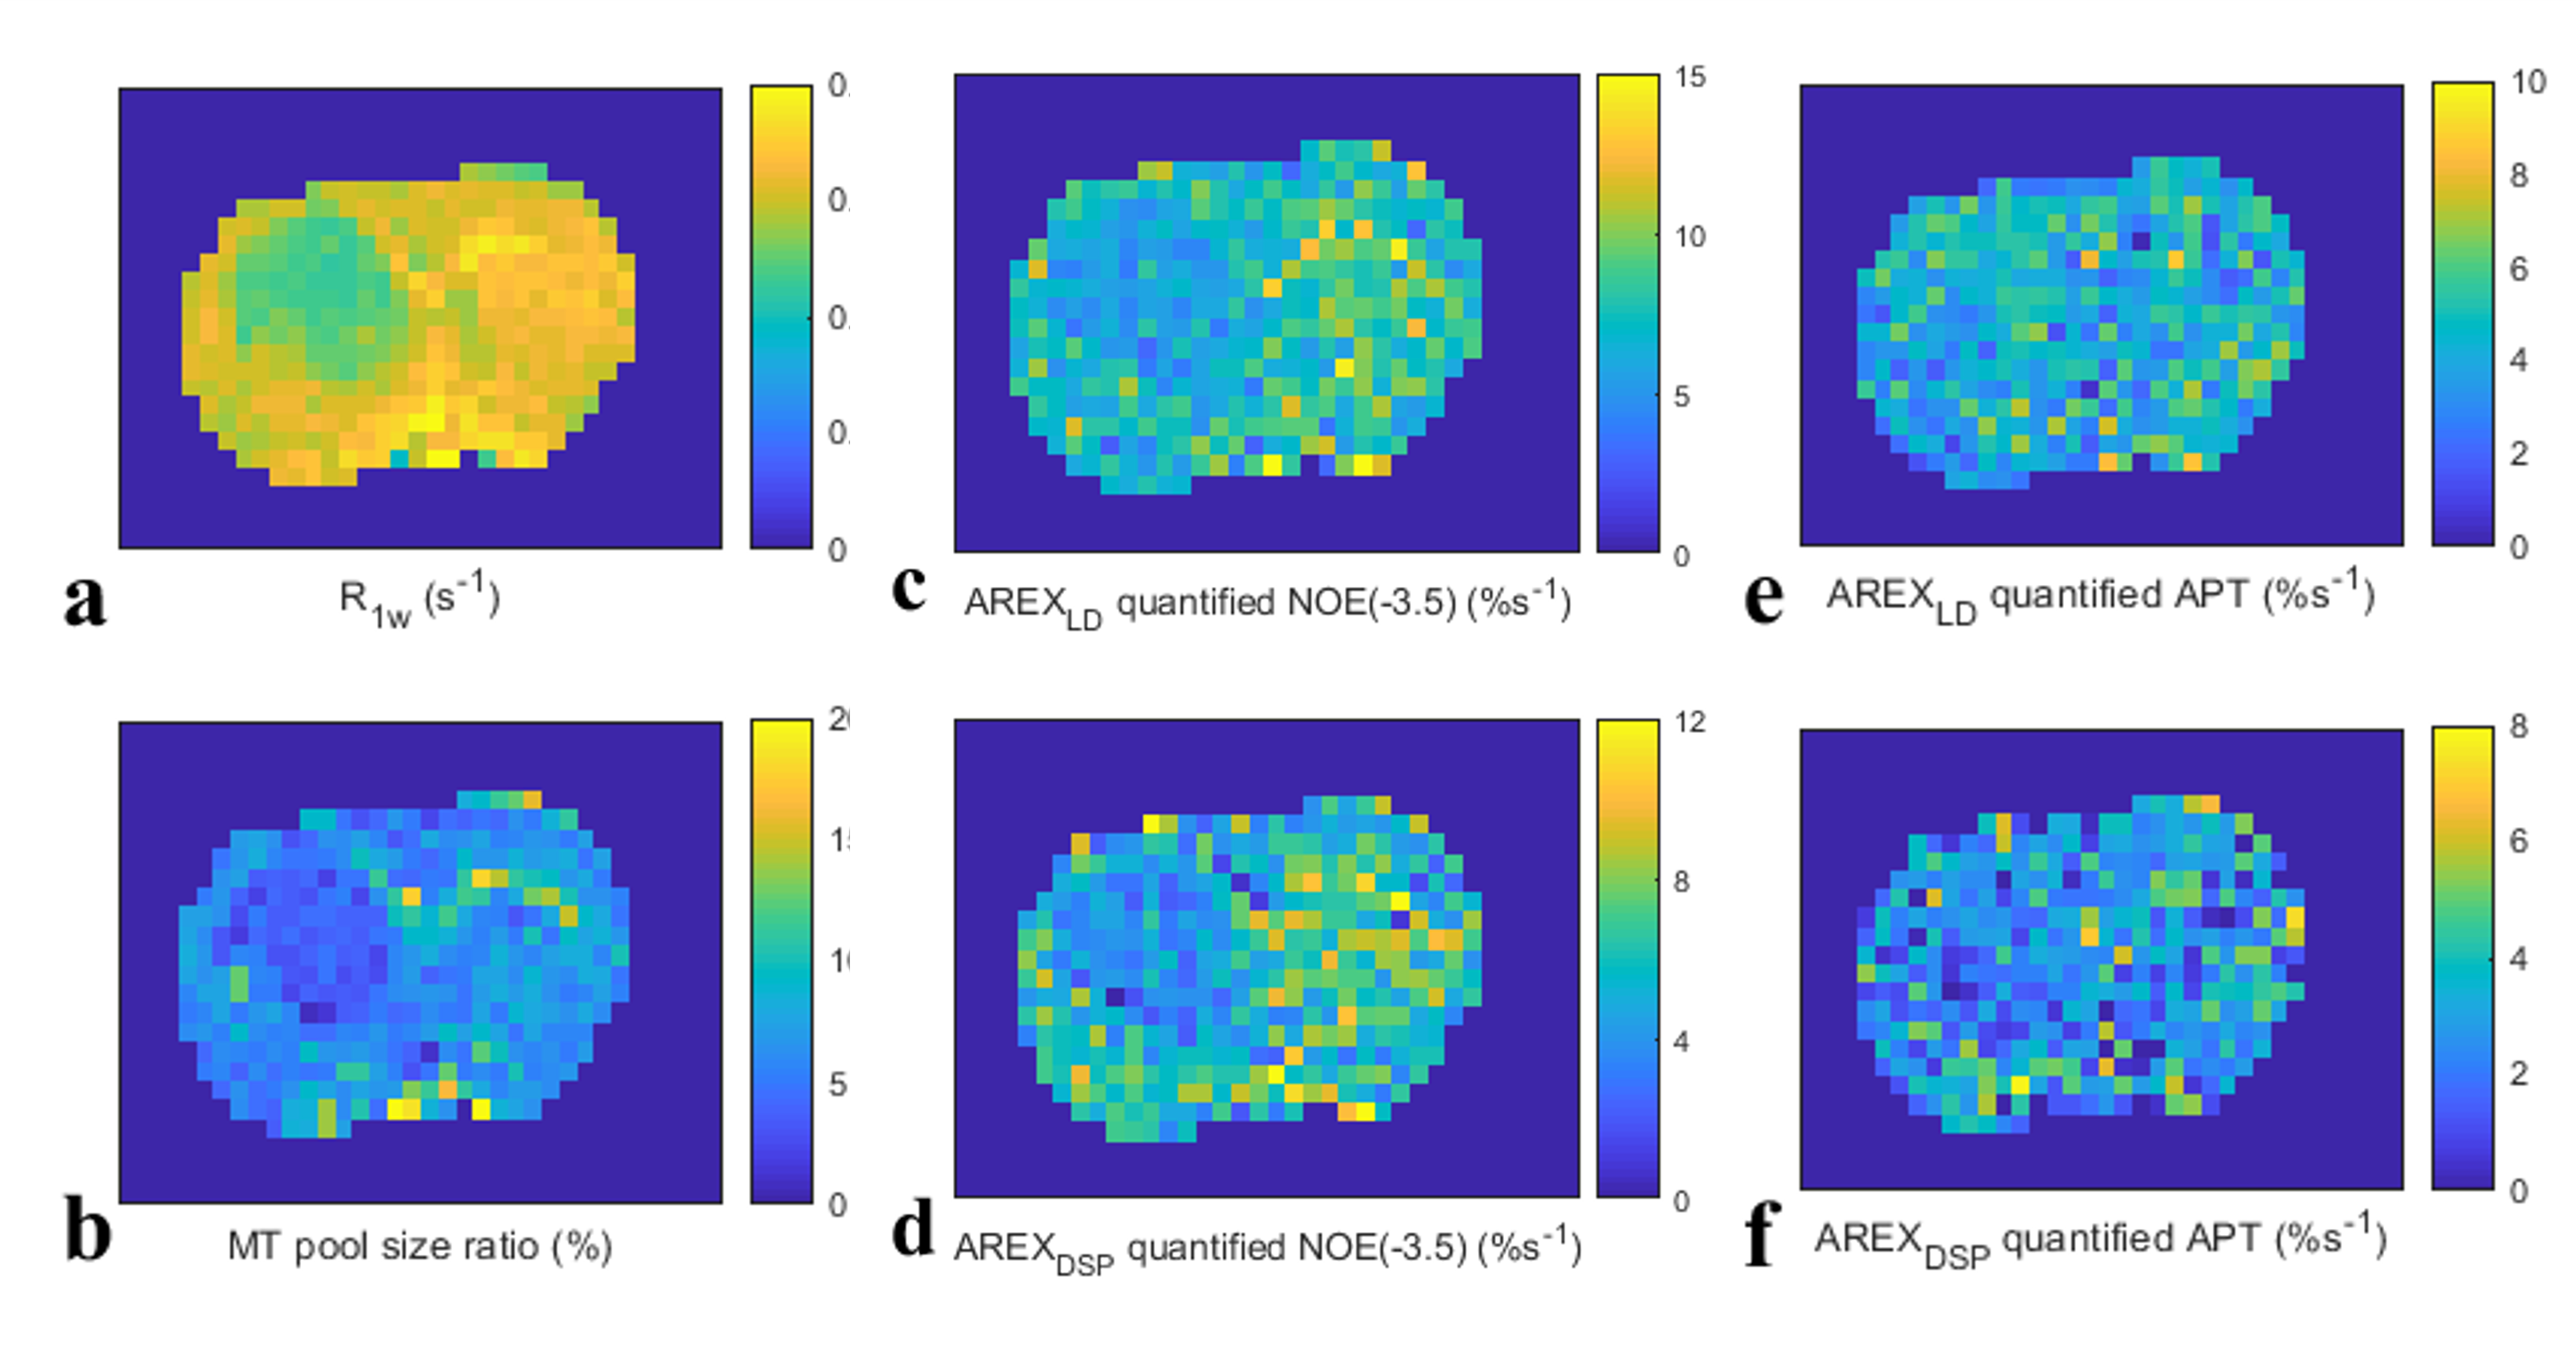
Fig. 3 images of R1w,
MT pool size ratio, NOE(-3.5) and APT that are acquired from a typical rat
bearing tumors.
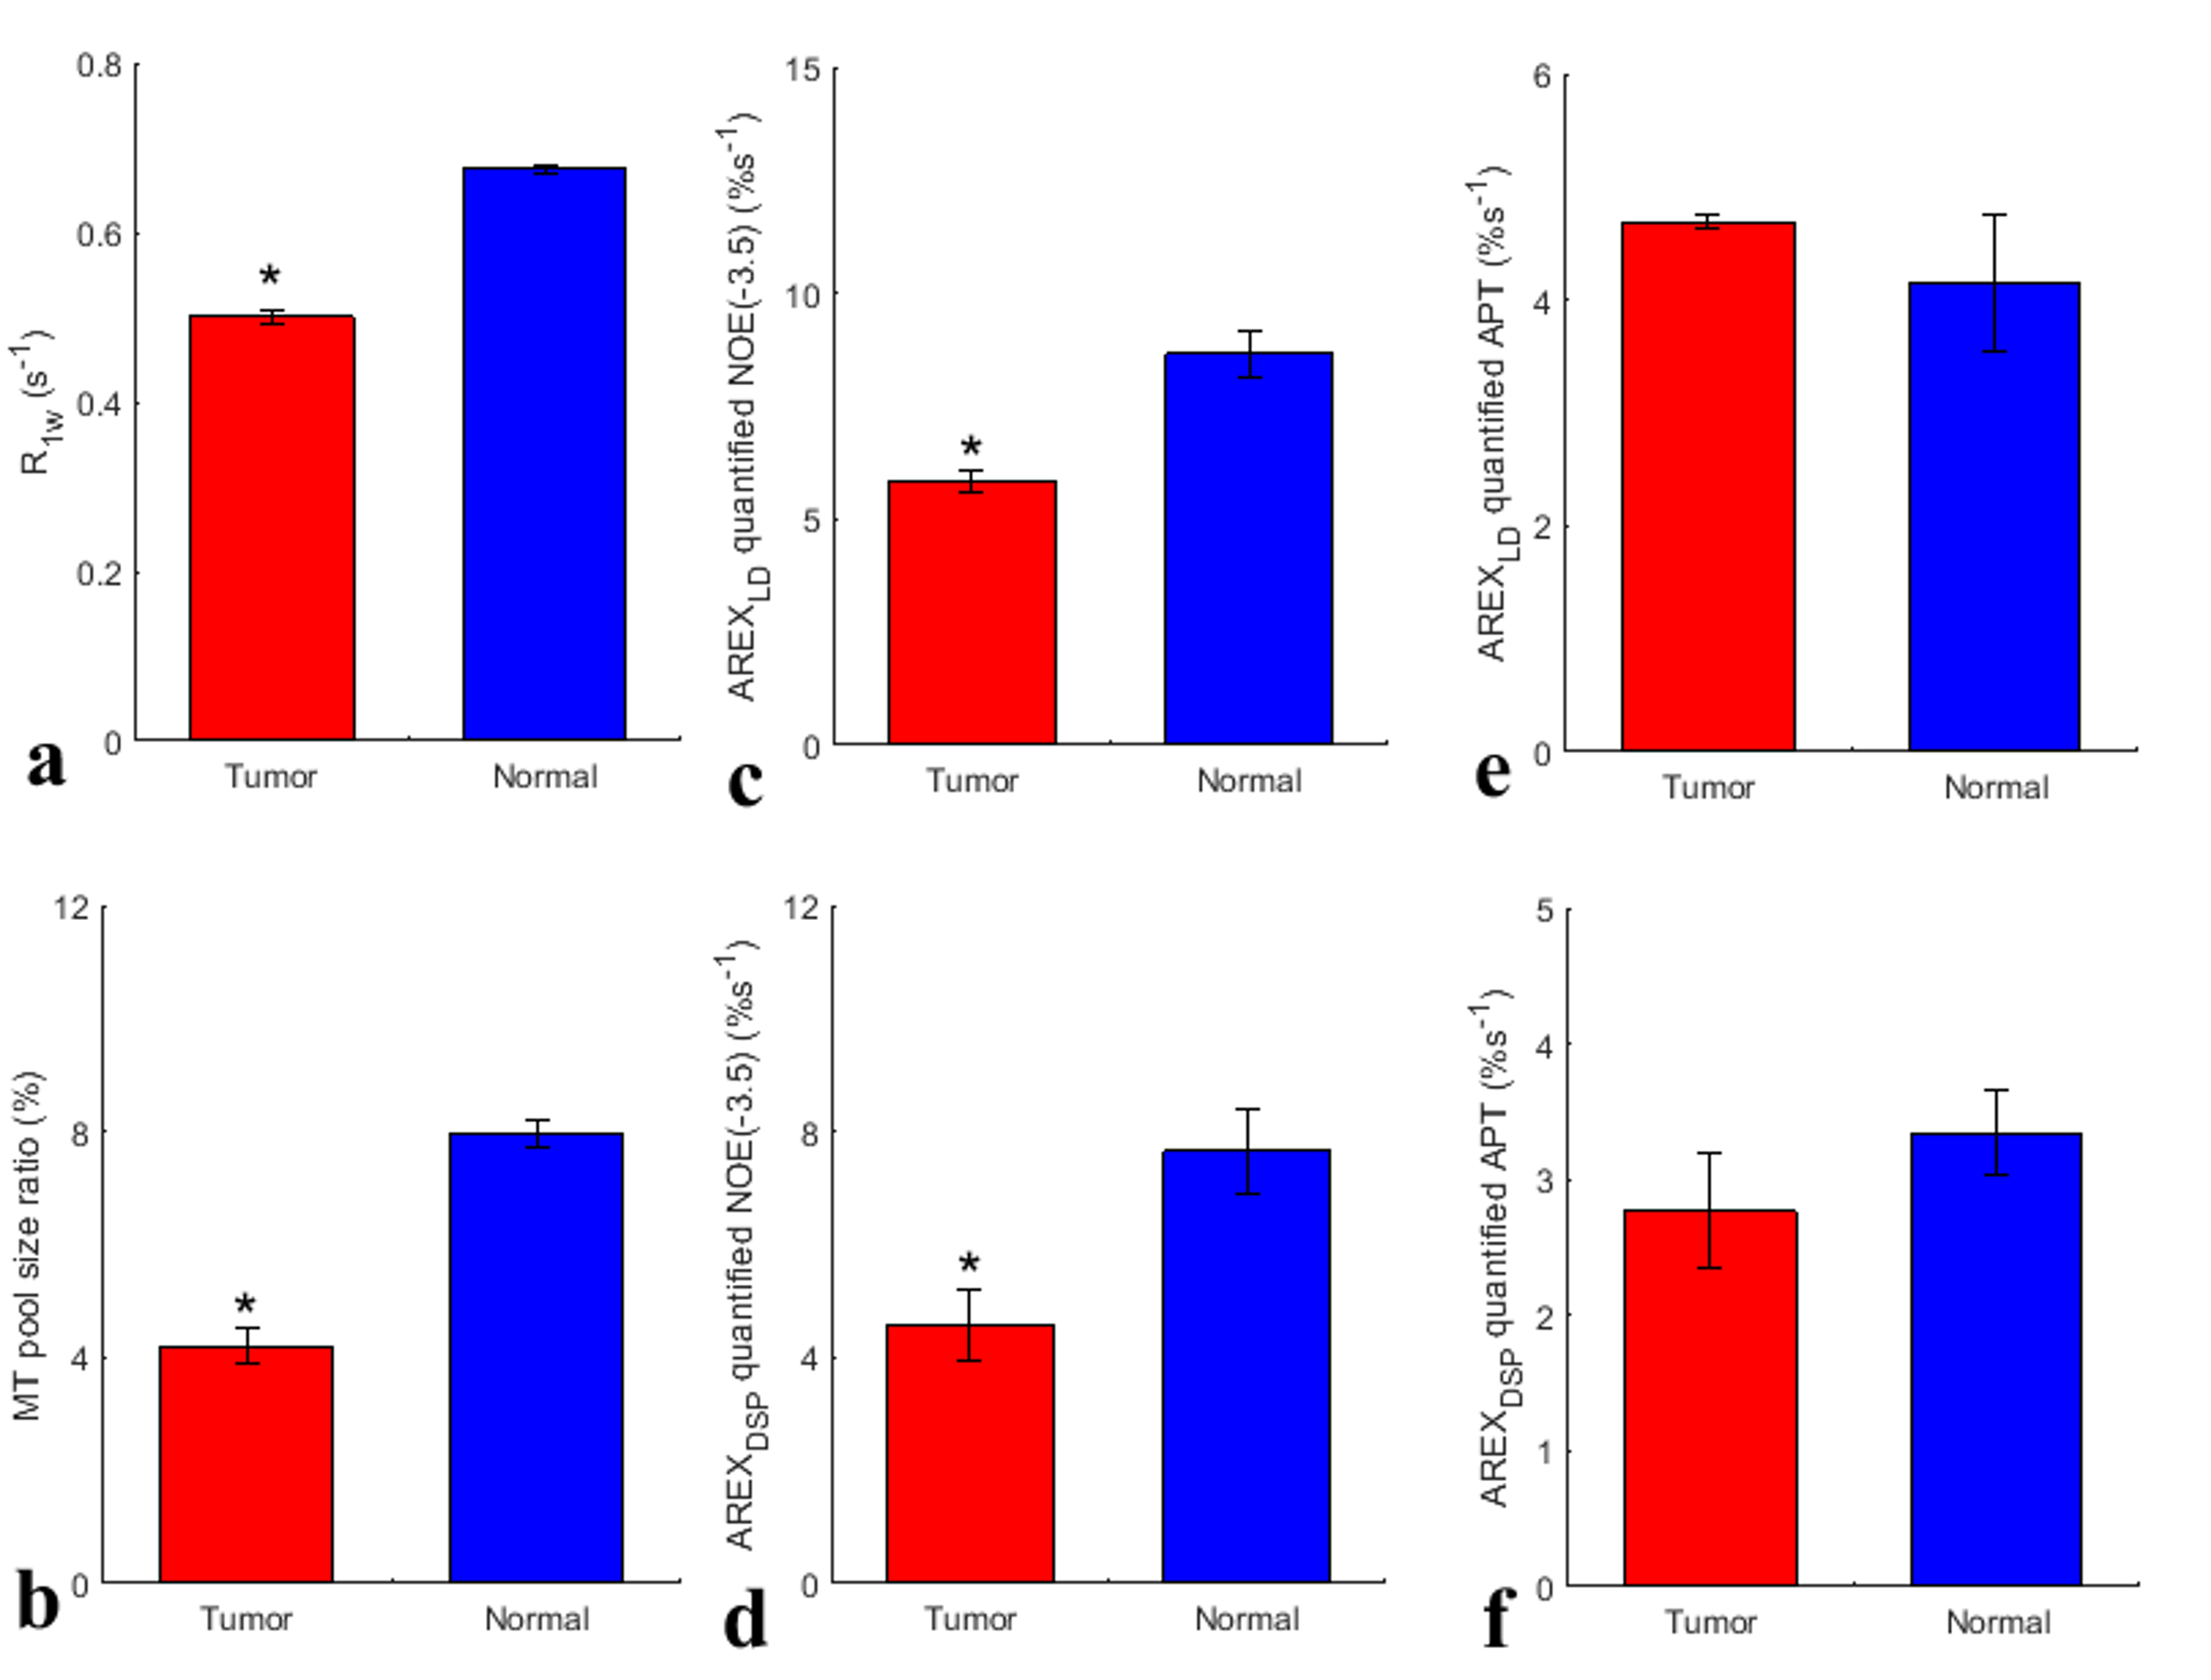
Fig. 4 statistical analysis based on ROIs that were delineated
from the tumors and the contralateral normal tissues in the rat brains.
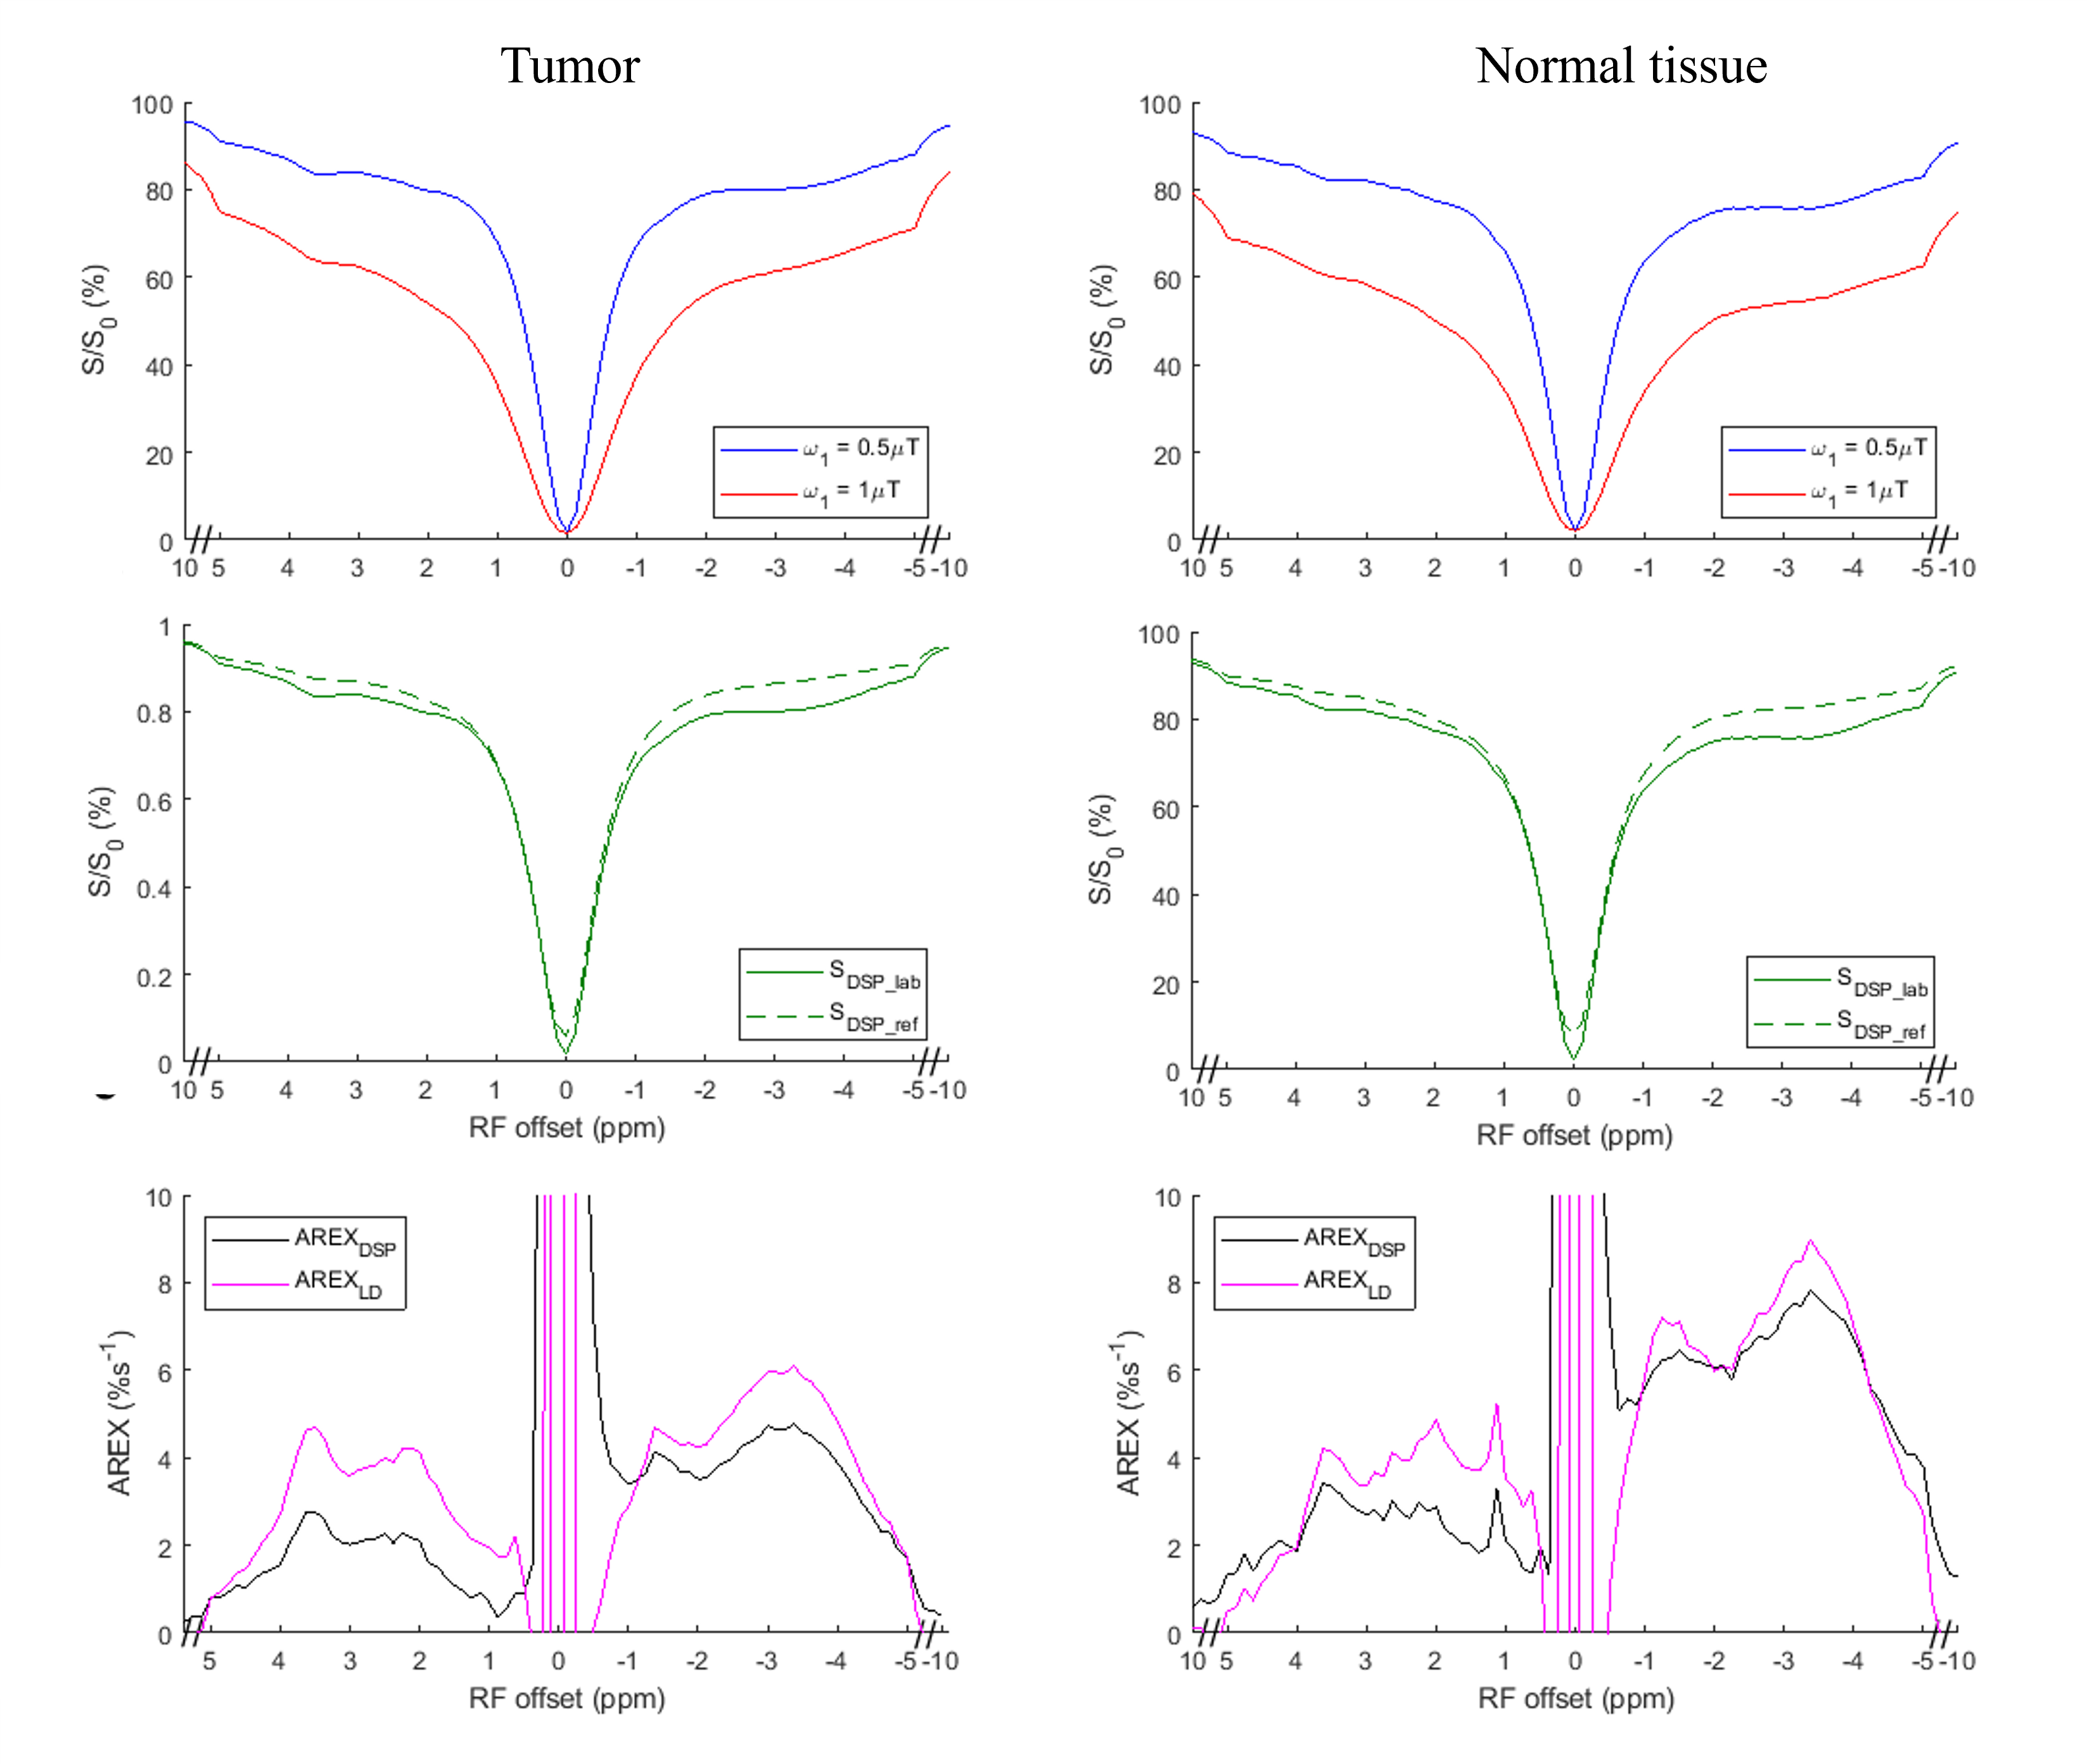
Fig. 5 Z-spectra of the LD and DESP-CEST from the tumors and the contralateral normal tissues.
DOI: https://doi.org/10.58530/2023/1817