1815
Concurrent mapping of brain metabolism and airway architecture during respiration and volitional apneas1Radiology, University of Pennsylvania, Philadelphia, PA, United States
Synopsis
Keywords: Quantitative Imaging, Quantitative Imaging, Obstructive sleep apnea
Obstructive sleep apnea is associated with changes in upper airway morphology and sleep disturbances from transient nocturnal hypoxemia and hypoxia. The latter adversely affects brain metabolism and neurologic function. MRI is the only non-invasive modality cable of concurrently visualize airway architecture and quantify neurometabolism during sleep. We present an interleaved pulse sequence and demonstrate its ability to detect metabolic response and airway anatomic alteration from a swallowing apnea (SA). Although airway anatomy during SA is distinctively different from a breath-hold apnea both result in similar physiological responses in terms of cerebral blood flow and venous blood oxygenation.INTRODUCTION
Obstructive sleep apnea (OSA) is a sleep disorder where a narrow, crowded, or collapsible upper airway promotes repeated transient nocturnal hypoxemia (reduced arterial saturation) and hypoxia (deprived oxygen supply to an organ) [1]. These nocturnal episodes adversely affect cerebral oxygen metabolism and initiate neuroinflammatory processes [2] eventually leading to impaired neurologic function and development neurovascular disease [3,4]. MRI has the ability to concurrently quantify metabolic response to anatomic alterations occurring during partial or complete closure of the airway. We present a new dynamic pulse sequence that interleaves anatomic and quantitative imaging to visualize upper airway architecture and measure blood flow velocity and oxygenation in the superior sagittal sinus, essential physiological parameters for computing global cerebral metabolic rate of oxygen (CMRO2). The goal of this project is to demonstrate the proposed pulse sequence’s ability to detect physiological responses from volitional apneas including swallowing apnea that mimic closure of the upper airway during a spontaneous apneic event.METHODS
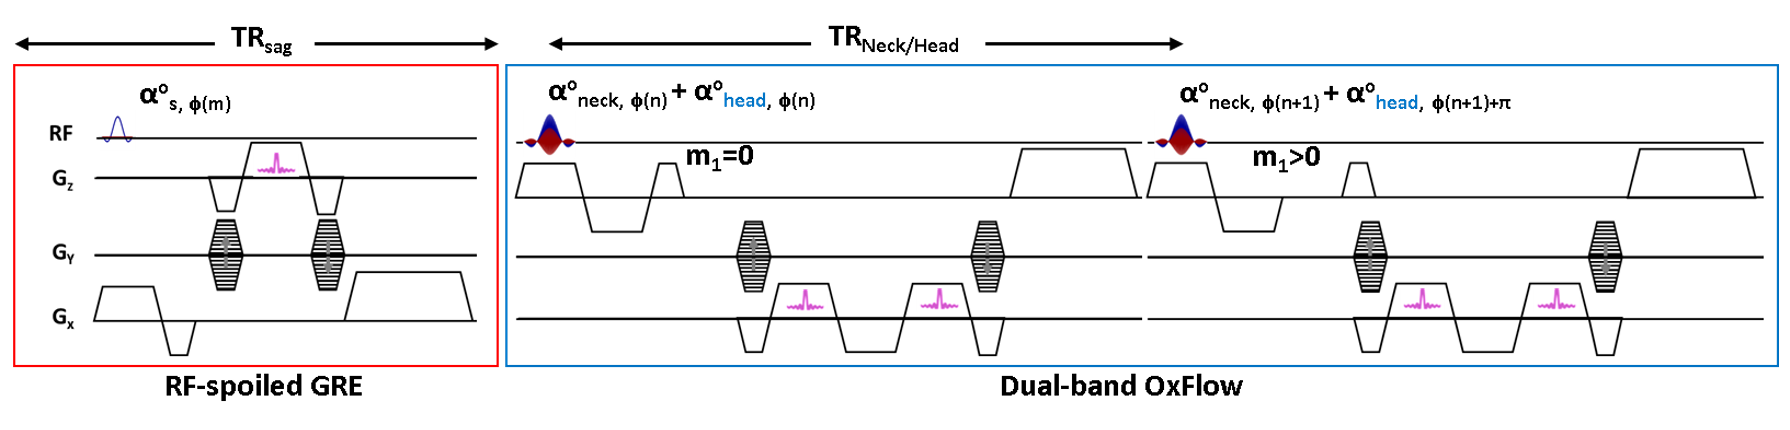
Fig 1 shows the proposed pulse sequence to capture airway structure and quantify neurometabolism every six seconds. Two rapid RF-spoiled GRE (SPGR) sequences are concatenated allowing acquisition of three types of images that enable quantification of neurovascular metabolic rate (blood flow velocity and oxygenation level, SvO2) and visualization of orthogonal (sagittal and axial) airway anatomic architecture during normal respiration and apneas. A sagittal image is acquired first and the imaging parameters are as follows: TE/TR = 2/5 ms, flip angle = 5 deg, FOV = 500 x 250 mm2 (inferior to superior readout and anterior to posterior phase-encoding), matrix size = 384 x 144 (partial Fourier factor 0.75), BW = 650 Hz/pix. The second SPGR is a dual-band (db) OxFlow sequence [5] that simultaneously excites two axial slices (at the level of superior sagittal sinus and retropalatal region) with a linear combination of two SINC pulses (see caption for more detail). OxFlow is a velocity-encoded multi-echo GRE sequence that enables simultaneous mapping of field and first moment (m1) for SvO2 and velocity quantification. The following imaging parameters were used for db-OxFlow: TE/TR = 6/18.3 ms, flip angle = 9 deg, FOV = 192 x 192 mm2, matrix size = 192 x 144 (partial Fourier factor 0.75), BW = 350Hz/pix. In short, interleaved SPGR (scan time 0.72s) and db-OxFlow (scan time 5.28s) allows time-series imaging at 6 s temporal resolution. Neck and head signals are separated by leveraging the sensitivity variations of receive coils along both phase-encoding (GY) and slice- directions (GZ), and controlled aliasing with alternating RF phases at the head slice [6]. In the current application, SvO2 and velocity are quantified in the superior sagittal sinus (SSS) while only anatomic images are reconstructed at the retropalatal region (neck) to visualize the airway anatomy. To demonstrate pulse sequence’s ability to associate metabolic response to anatomic alterations occurring during partial or complete closure of the airway, a female subject (30 yr old) was asked to alternate between breath-hold and swallowing apnea for 30s. Swallowing apnea mimics closure of the upper airway during an apneic episode in OSA. Swallowing apnea corresponds to the oropharyngeal phase of swallowing which results in the closure of the entire upper airway thereby impeding respiration, i.e., tongue and soft palate block oral and nasal cavities, respectively. All imaging was performed at 3T (Siemens Prisma, Erlangen, Germany) with a 64 Ch head/neck coil.RESULTS
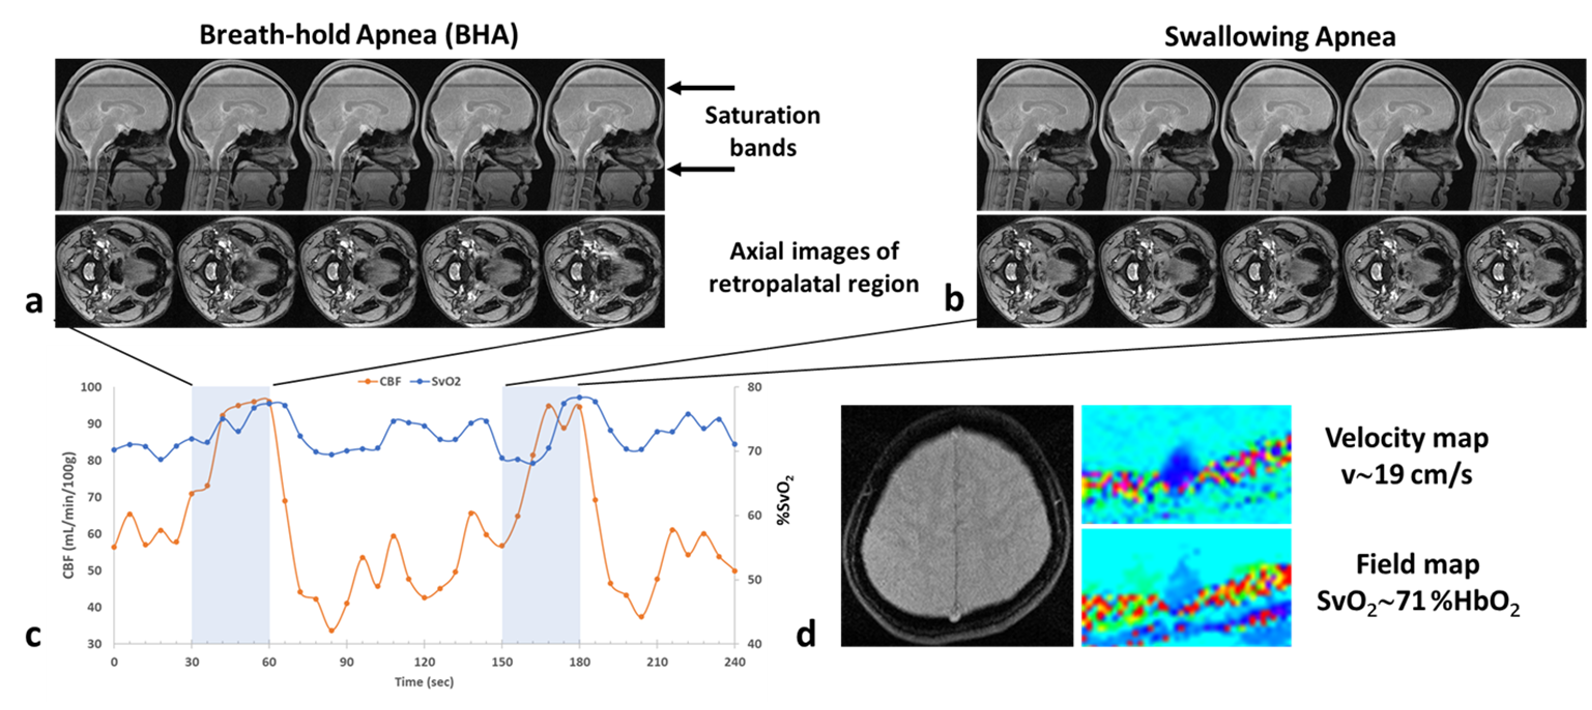
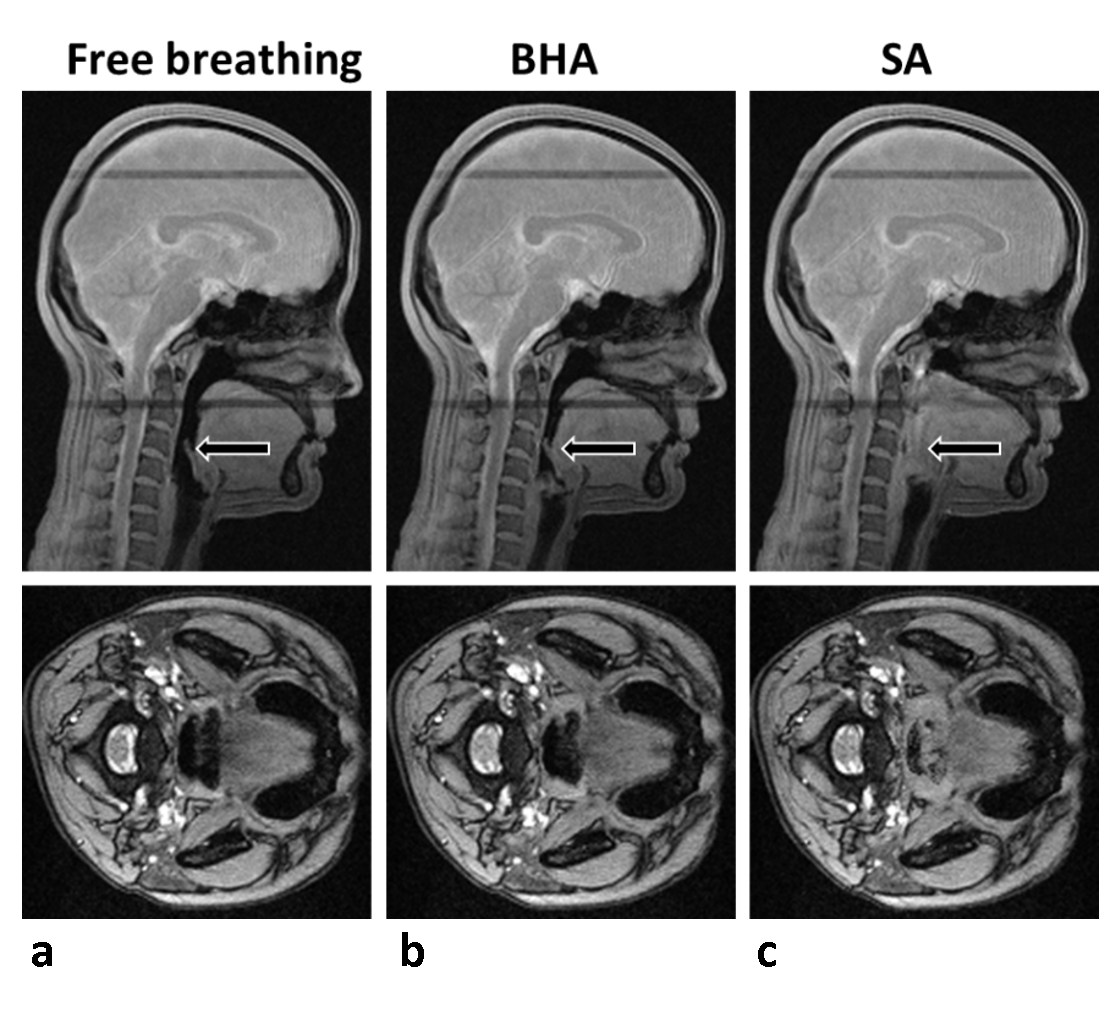
Representative anatomic images and time-courses of SSS blood-flow velocity and SvO2. Figs 2a and b show the distinguishing features in airway morphology between the two types of apneas, with complete closure of the airway in swallowing apnea (SA) while remaining open during breath-hold apnea (BHA). Time-courses of physiological parameters during normal respiration and the two types of apneas shown in Fig 2c. Fig 2d shows example parametric images obtained every 6 seconds during the time series, allowing computation of global cerebral metabolic rate of oxygen along with measurement of SaO2 by pulse oximetry via Fick’s Principle. Magnified views representing the periods of normal and suspended respiration are displayed in Fig 3.DISCUSSION AND CONCLUSION
BHA and SA lead to distinguishable airway anatomic changes but qualitatively, both types of apnea result in similar physiological responses in terms of metabolic parameters (increases in CBF and SvO2,). We note that each 30-second apnea challenge yielded 5 anatomic images of the airway. Thus, dynamic mapping of morphology and oxygen metabolism should enable capture of spontaneous apneas as short as 10s during sleep in OSA patients. The method has the potential to provide insight into partial reversibility of metabolic and structural deficits following continuous positive airway pressure (CPAP) therapy.Acknowledgements
R21 AG065816References
1. Young T, Palta M, Dempsey J, Skatrud J, Weber S, Badr S. The occurrence of sleep-disordered breathing among middle-aged adults. N Engl J Med 1993;328(17):1230-1235.
2. Gnoni V, Ilic K, Drakatos P, Petrinovic MM, Cash D, Steier J, Morrell MJ, Petanjek Z, Kalanj-Bognar S, Rosenzweig I. Obstructive sleep apnea and multiple facets of a neuroinflammatory response: a narrative review. J Thorac Dis 2022;14(2):564-574.
3. Yaggi HK, Concato J, Kernan WN, Lichtman JH, Brass LM, Mohsenin V. Obstructive sleep apnea as a risk factor for stroke and death. N Engl J Med 2005;353(19):2034-2041.
4. Durgan DJ, Bryan RM, Jr. Cerebrovascular consequences of obstructive sleep apnea. J Am Heart Assoc 2012;1(4):e000091.
5. Lee H, Langham Michael C, Rodriguez-Soto Ana E, Wehrli Felix W: Multiplexed MRI methods for rapid estimation of global cerebral metabolic rate of oxygen consumption. NeuroImage 149: 393-403, Feb 2017. 6. Breuer, F.A., Blaimer, M., Heidemann, R.M., Mueller, M.F., Griswold, M.A., Jakob, P.M.,2005. Controlled aliasing in parallel imaging results in higher acceleration (CAIPIRINHA) for multi‐slice imaging. Magn. Reson. Med. 53, 684–691.
Figures