1814
Effect of Omega-3 Fatty Acid Content on Allylic Proton T2 at 9.4 T1Department of Oncology, University of Alberta, Edmonton, AB, Canada, 2Department of Medical Physics, Cross Cancer Institute, Edmonton, AB, Canada, 3Department of Agricultural, Food and Nutritional Science, University of Alberta, Edmonton, AB, Canada
Synopsis
Keywords: Quantitative Imaging, Spectroscopy, fat quantification
In this work at 9.4 T, it is demonstrated that the apparent T2 (includes losses due to J-coupling) relaxation times of the allylic fat protons (≈ 2.1 ppm) is correlated with higher ω-3 content. J-coupling evolution appears to refocus with a PRESS TE of 270 ms rendering it a suitable TE for obtaining T2 estimates. Experiments were performed on oils of varying ω-3 content and preliminary in-vivo experiments were performed on two mice, each fed a different fat diet.Introduction
Omega-3 (ω-3) fatty acid dietary intake has been shown to have positive effects in diseases such as obesity, breast cancer, muscle health and insulin sensitivity impairment 1-4. For example, ω-3 content in human abdominal adipose tissue was found to be inversely correlated with obesity 5,6. Magnetic resonance spectroscopy (MRS) offers a non-invasive means of fat composition assessment. However, ω-3 quantification is challenging due to its low concentration and overlap of the ω-3 and non ω-3 methyl resonances. Long echo time (TE) MRS has been optimized for resolving the two methyl peaks at the high field strengths of 7 T and 9.4 T 7, 8. However, at lower clinical field strengths, where the spectral resolution is inferior, other methods such as difference editing 9 and methyl linewidth measures 10 have been presented. In this work at 9.4 T, we investigate an indirect means of relative ω-3 quantification, which can potentially be applied at lower fields. Specifically, we examine whether the T2 transverse relaxation of the ≈ 2.1 ppm allylic fat protons, which neighbour the methyl protons in an ω-3 fatty acid, is affected by ω-3 content.Methods
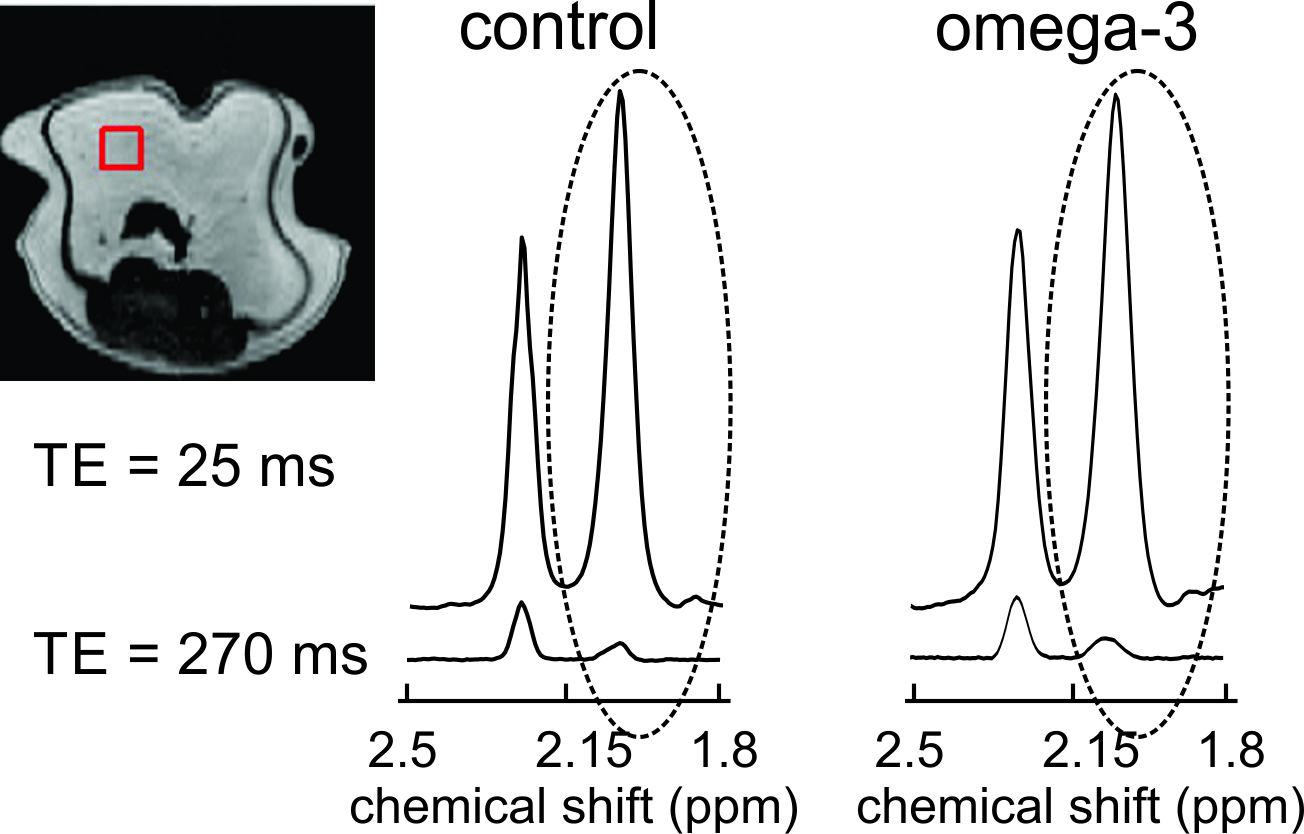
All experiments were conducted with a 9.4 T (21.5 cm diameter bore) MRI scanner using a transmit/receive radiofrequency (RF) birdcage coil. Phantom experiments were performed on oils with a range of ω-3 content: linseed (≈ 57 % ω-3), cod liver (≈ 24 % ω-3), walnut (≈ 16 % ω-3), canola (≈ 10% ω-3) and peanut oil (≈ 0 % ω-3). Spectra were acquired from 5 x 5 x 5 mm3 voxels as 8192 complex points sampled at 10000 Hz with a Point RESolved Spectroscopy (PRESS) sequence with TE1 (first echo time) fixed at 15 ms. TE2 was adjusted to yield total TE values of 25 ms and 30 – 300 ms in steps of 10 ms. A repetition time (TR) of 5000 ms was employed. Preliminary in-vivo experiments were performed on two CD1 mice, both fed 20 % w/w fat diets. One of the mice was fed a high ω-3 diet (fat composed of ≈ 16 % ω-3 and the other (control mouse) a low ω-3 diet (fat composed of ≈ 1 % ω-3). In-vivo spectra were acquired from visceral adipose tissue (Figure 3) with a short total TE of 25 ms and with a longer TE determined from the phantom data to be suitable for apparent (apparent because J-coupling effects are included) T2 estimation. Spectra were acquired from 3 x 3 x 3 mm3 voxels as 2048 points (sampled at 10000 Hz) with a TR of 3 s. Respiratory gating was employed. The allylic resonance (≈ 2.1 ppm) area was calculated for all spectra. For both phantoms and animals, apparent transverse T2 times of the allylic protons were estimated in MATLAB by fitting the peak areas obtained with a TE of 25 ms and with the longer TE to a mono-exponentially decaying function.Results
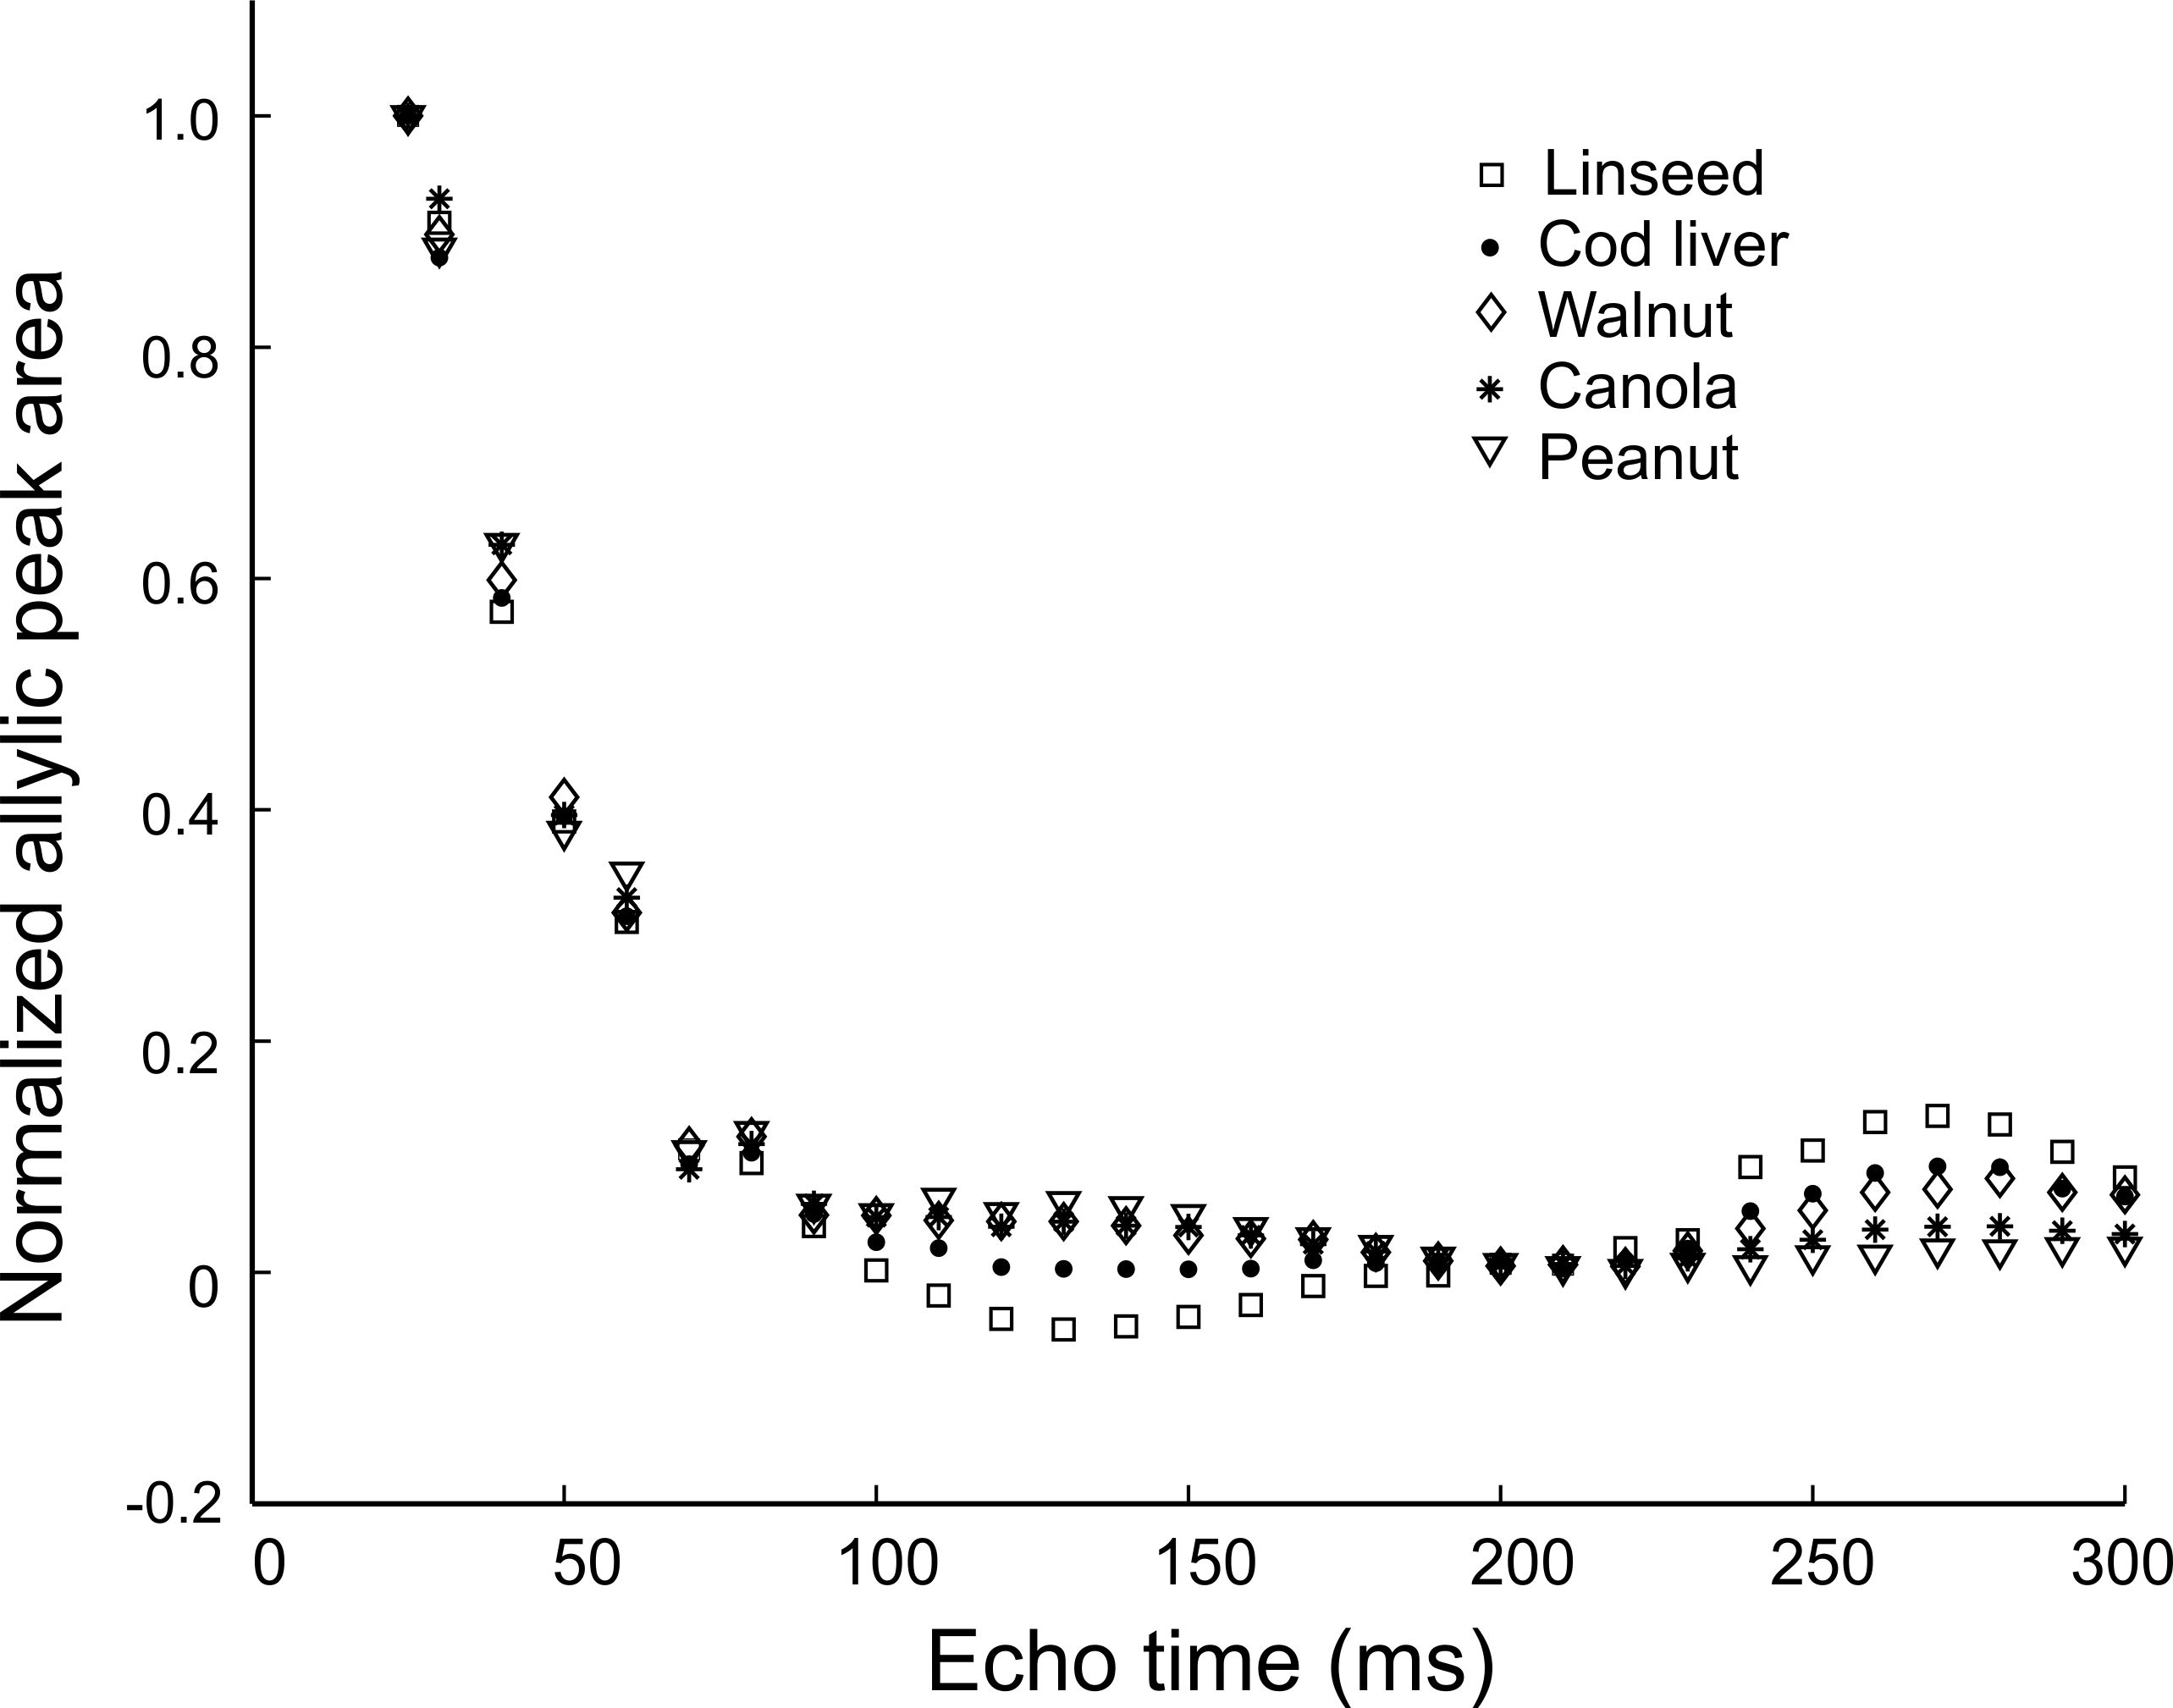
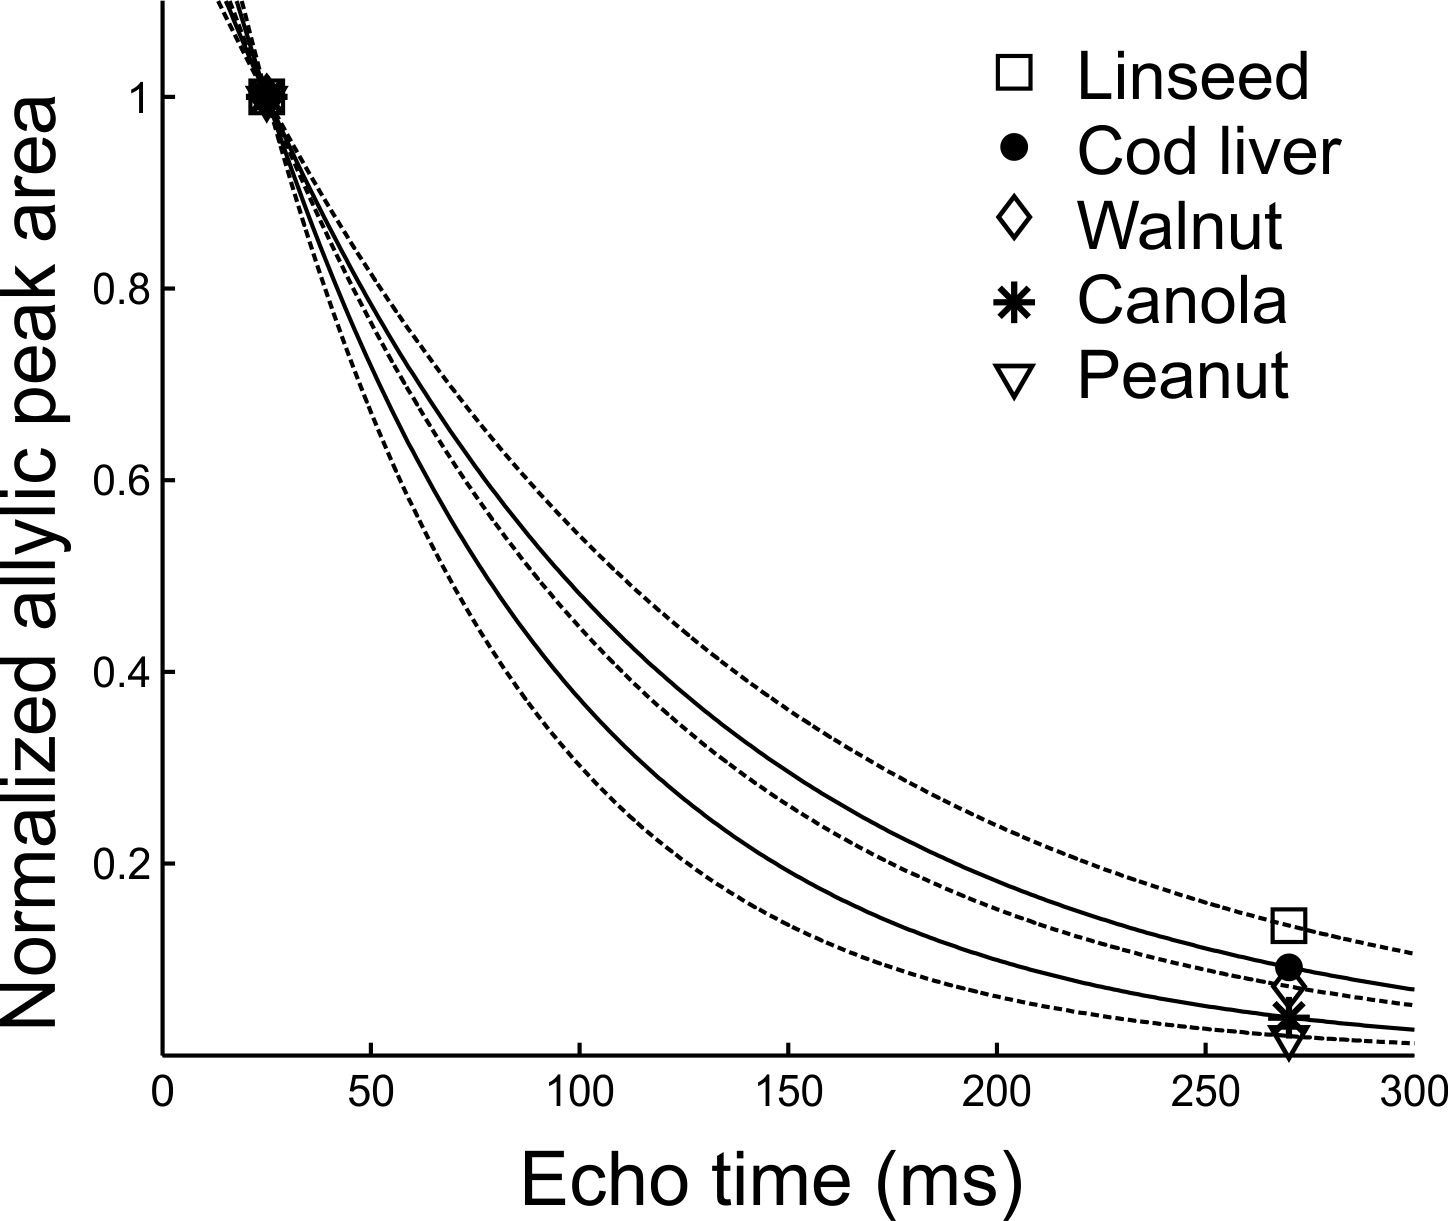
Figure 1 shows peak areas (normalized to the maximum obtained with the short TE of 25 ms) for the allylic resonance for the five oils as a function of total PRESS TE. J-coupling evolution is visible and appears to refocus when TE is 270 ms. The normalized areas obtained with a TE of 25 ms and 270 ms were fit (Figure 2) to yield apparent T2 values for the allylic protons of the different oils. Apparent T2 values of 122.5 ms, 102.6 ms, 93 ms, 75.8 ms and 62.7 ms were obtained for linseed, cod liver, walnut, canola and peanut oil, respectively. Figure 3 displays spectra obtained from the two mice with the two TE values. Apparent T2 times of 71.8 ms and 66.5 ms were estimated from the allylic peak areas for the ω-3 diet and the control mouse, respectively.Discussion
There is a correlation between apparent allylic proton T2 and ω-3 content for the oils. A linear regression yields a linear correlation with a coefficient of determination (R2) of 0.9. Our preliminary in-vivo data is supportive of our phantom findings. Previously, a similar high ω-3 diet resulted in about 5-6 % ω-3 in mouse visceral adipose tissue 8. The allylic proton apparent T2 of the ω-3 diet mouse is 8 % higher than that of the control mouse, consistent with a higher ω-3 content and is of similar value to that obtained for canola oil (≈ 10 % ω-3).Conclusion
It was demonstrated at 9.4 T that the apparent T2 (includes J-coupling losses) of fat allylic protons increases with higher ω-3 content. J-coupling evolution appears to refocus with a PRESS TE of 270 ms rendering it a suitable TE for obtaining T2 estimates.Acknowledgements
We are grateful to the Natural Sciences and Engineering Council of Canada (NSERC) for research funding.References
1. Coelho D.F., Pereira-Lancha L.O., Chaves D.S., Diwan D., Ferraz R., Campos-Ferraz P.L., Poortmans J.R., Lancha Junior A.H. Effect of high-fat diets on body composition, lipid metabolism and insulin sensitivity, and the role of exercise on these parameters. Brazilian Journal of Medical and Biological Research 2011;44:966-972
2. Hammad S.S., Jones P.J., Dietary fatty acid composition modulates obesity and interacts with obesity-related genes. Lipids 2017;52:803-822
3. Kim J., Lim S-Y., Shin A., Sung M-K., Ro J., Kang H-S., Lee K.S., Kim S-W., Lee E. Fatty fish and fish omega-3 fatty acid intakes decrease the breast cancer risk: a case-control study. BMC Cancer 2009;9:216
4. McGlory C., Calder P.C., Nunes E.A., The influence of omega-3 fatty acids on skeletal muscle protein turnover in health, disuse, and disease. Frontiers in Nutrition 2019;6:144
5. Garaulet M., Hernandez-Morante J.J., Lujan J., Tebar F.J., Zamora, Relationship between fat cell size and number and fatty acid composition in adipose tissue from different fat depots in overweight/obese humans. International Journal of Obesity 2006;30:899-905
6. Garaulet M., Pérez-Llamas F., Pérez-Ayala M., Martínez P., Sánchez de Medina F., Tebar F.J., Zamora S., Site-specific differences in the fatty acid composition of abdominal adipose tissue in an obese population from a Mediterranean area: relation with dietary fatty acids, plasma lipid profile, serum insulin, and central obesity. American Journal of Clinical Nutrition 2001;74:585-591
7. Gajdošík M., Hingerl L., Škoch A., et al. Ultralong TE in vivo 1H NMR spectroscopy of omega-3 fatty acids in subcutaneous adipose tissue at 7 T. J Magn Reson Imaging. 2019;50:71-82
8. Fallone C.J., Tessier A.G., Field C.J., Yahya A., Resolving the omega-3 methyl resonance with long echo time magnetic resonance spectroscopy in mouse adipose tissue at 9.4 T. NMR in Biomedicine 2021;34:e4455
9. Škoch A, Tošner Z, Hájek M. The in vivo J-difference editing MEGA-PRESS technique for the detection of n-3 fatty acids. NMR Biomed. 2014;27:1293-1299.
10. Fallone C.J., McKay R.T., Yahya A, Long TE. STEAM and PRESS for estimating fat olefinic/methyl ratios and relative ω-3 fat content at 3T. J Magn Reson Imaging. 2018;48:169-177
Figures