1813
T1-compesated quantification of NOE and amide for brain tumor patients using a QUEST-like 10-point fitting1center for biomedical imaging research, school of medicine, Tsinghua Univisity, Beijing, China, 2Beijing Tsinghua Changgung Hospital, Beijing, China
Synopsis
Keywords: Quantitative Imaging, CEST & MT
CEST MRI is a promising molecular imaging technique, but the in vivo quantification inherently faces challenges because of multiple types of signal contaminations. Herein we introduced a QUEST-like 10-point fitting method for simultaneous NOE and amide quantification at 3T with reduced T1 contamination. The quantification method was evaluated by simulations and phantom experiments. Furthermore, for glioblastoma patients, the highlighted regions on fitted amide images are consistent with the hyperintensities on Gd-T1W maps, which is a smaller enhanced area than those on conventional APTw images. The initial results on tumor patients indicate its potential for clinical use.INTRODUCTION
CEST MRI is a promising ‘label-free’ molecular imaging technique that has been approved for clinical diagnosis of brain tumor. However, in vivo CEST signals are easily affected by tissue relaxation, resulting in difficulties in extraction of amide and NOE signals. A previous work acquired a T1 map and used a framework of exchange-dependent relaxation for CEST quantification [1]. Herein we combined the Lorentzian Difference(LD) quantification and the QUEST-type fitting, for simultaneous NOE and amide quantification with reduced T1 contamination at 3T.THEORY
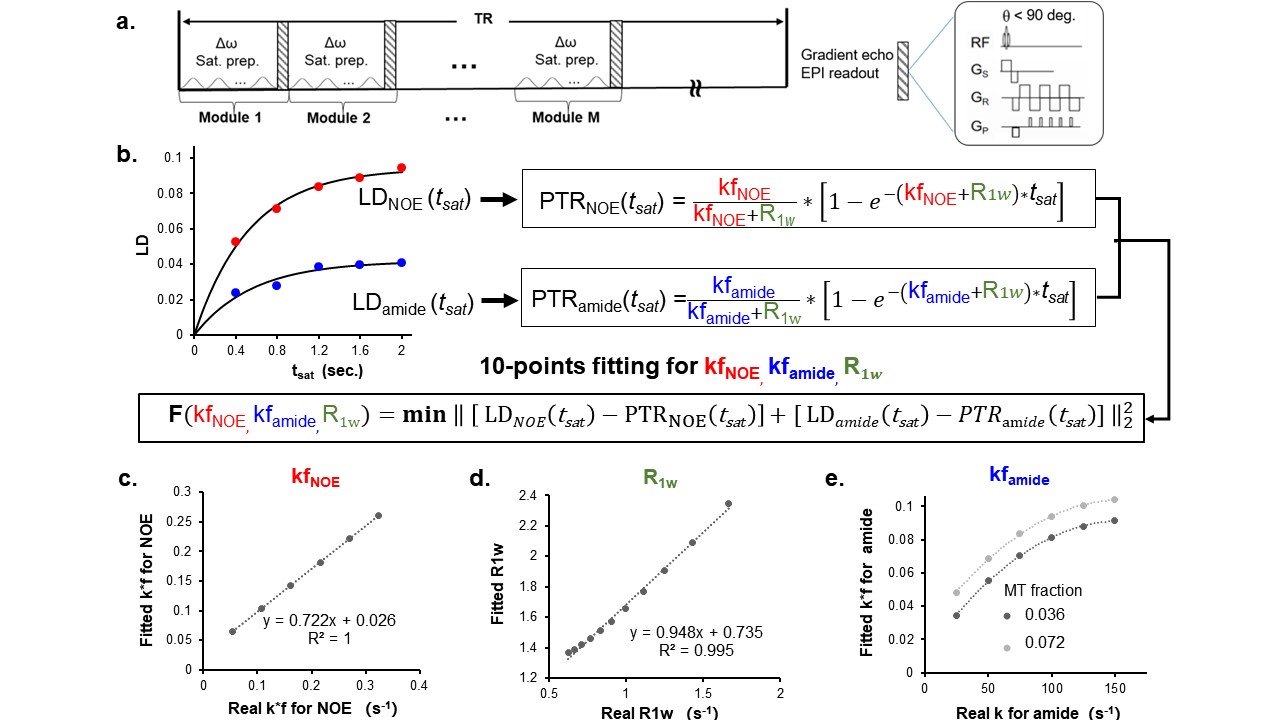
Based on the simplified 2-pool model of Bloch-McConnell equations, CEST signal, defined as proton transfer ratio (PTR), could be expressed as an exponential function of saturation duration (tsat) [2,3].PTR (tsat ) = (k*f)/ (R1w +k*f) *(1-exp (-(R1w +k*f) *tsat )) (Eq.1).
Here f is the concentration faction of the solute protons in respect to water protons, k is the exchange rate from solute to water, and R1w is the longitudinal relaxation rate of water. Previous QUEST method utilized multiple CEST measurements (i.e., MTRasym) weighted with different tsat, to fit the two unknowns, R1w and the k*f of the solute pool. Herein, instead of MTRasym, we employed the LD quantification as the measured PTR, to achieve separation of amide and NOE signals. As shown in Fig.1, LD signals of amide and NOE acquired under M Tsat values, in total 2XM measurements, could be employed to fit 3 unknowns based on Eq.1,including R1w, k*f(amide) and k*f(NOE).
METHODS
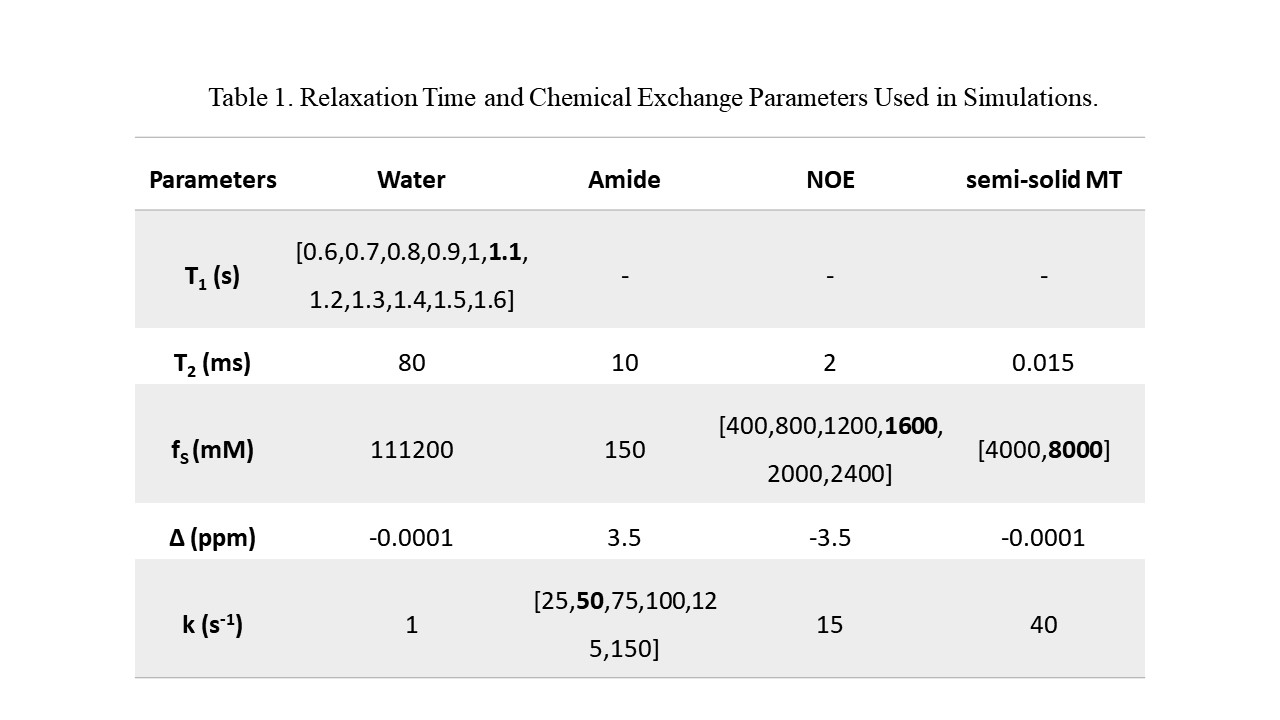
a. SimulationsTo test the performance of the proposed quantitation, simulations of T1 varying from 0.6 to 1.6 s and of aliphatic concentrations varying from 400 to 2400 mM were performed, respectively, using the python scripts of the MeLOVARS[4, 5] sequence. Other parameters used in the simulations were the same as shown in Table 1. Another set of simulations were performed to further test the robustness by varying the amide exchange rate from 25 s-1 to 150 s-1 at different semi-solid MT concentrations (4000mM or 8000mM).
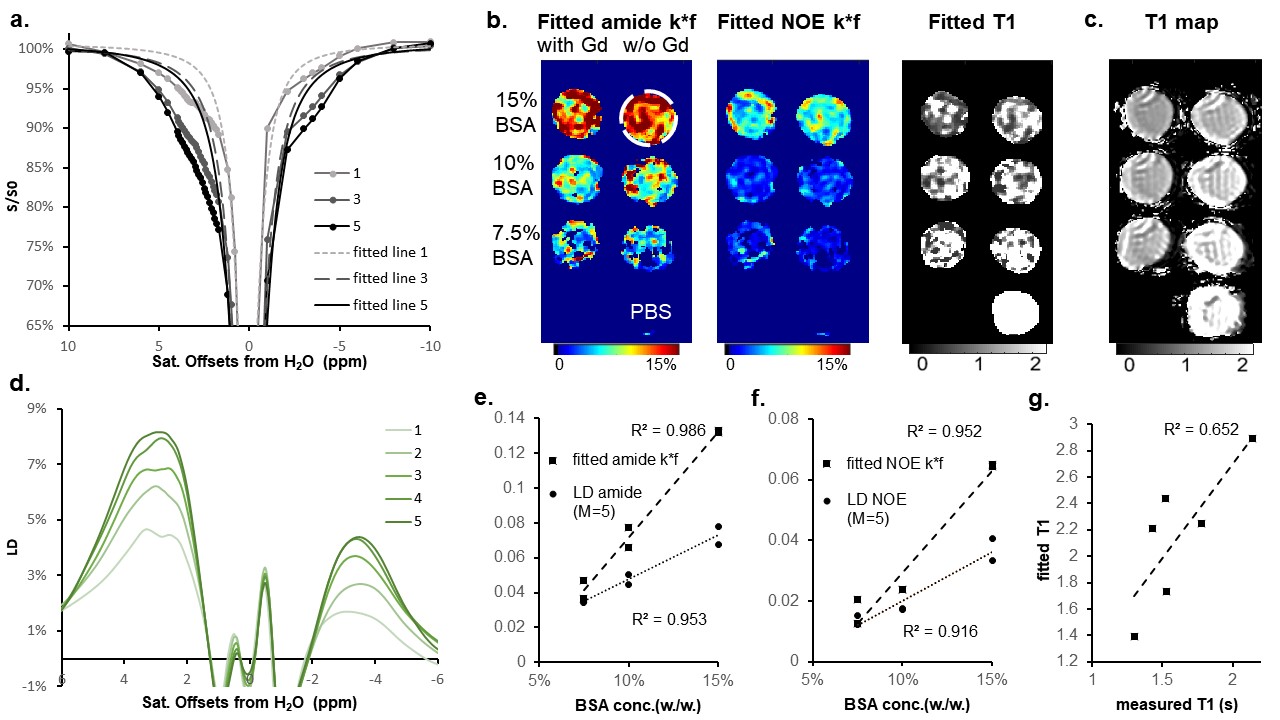
b. Phantom Preparation
Seven model solutions were prepared for MR scan. One of them was phosphate‐buffered saline as control. The rest six model solutions were divided into 3 groups on average, each group contained 15%, 10% and 7.5% weight‐per‐volume bovine serum albumin (BSA). In one sample of each group, 30 µL 1:10 diluted Gd-DTPA solution (Magnevist) was added to make T1 difference in 2 BSA solutions of the same concentration. Before MR scans, all tubes were heated by water bath. During MR scans, the phantom was kept at 37。C using a MR compatible air-heating device.
c. Participants
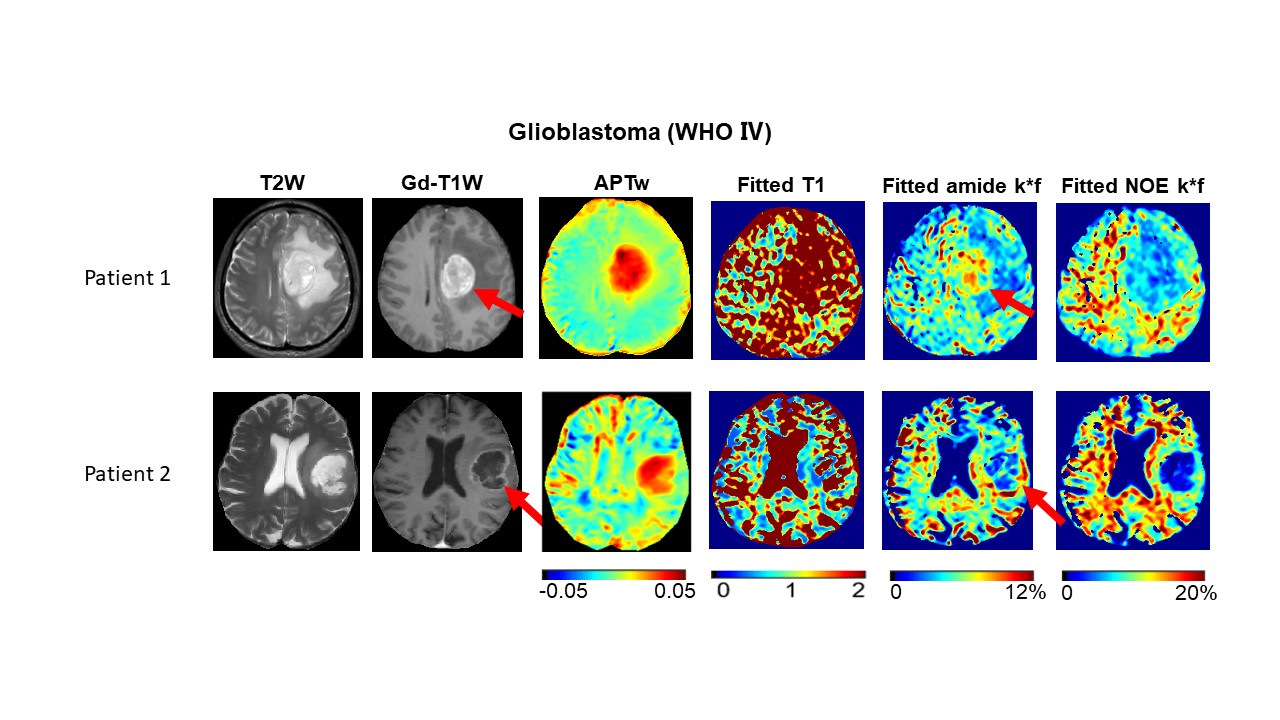
Two patients (a 28-year-old male and an 80-year-old female) with diagnosed glioblastoma were included in this study.
d. MR protocols
All experiments were performed on 3T Philips Ingenia CX MR scanners (Philips Healthcare, Best, The Netherlands) in Tsinghua Changgung Hospital, with a 60-cm body coil as the transmitter and a 32-channel phase-array surface coil as the receiver. The MeLOVARS-type acquisition sequence contained 5 modules within a TR, each including a 400ms-long saturation with effective B1,sat = 0.7uT and a single-slice single-shot EPI readout. Other parameters of the EPI readout were duration = 25ms, slice thickness = 7mm, and for phantom: TR = 5000ms, for patients: TR = 5500ms. For tumor patients, MeLOVARS were acquired before the injection of contrast agents. A WASSR scan at the same slice was performed for the B0 map.
e. Data analysis
All data were processed using custom-written MATLAB scripts. For tumor patients, a voxel-by-voxel B0 correction of the Z-spectrum was performed using the WASSR methods. LD maps for amide were calculated by averaging the LD values from 3.4 ppm to 3.7 ppm. LD maps for NOE were calculated by averaging the LD values of -3 ppm, -3.5 ppm and -4 ppm.
RESULTS
Simulations suggested that the fitted k*f of NOE are linearly correlated with the pre-set values when NOE concentration increased. The fitted R1w also has a similar linear relationship with that set in the simulations. The fitted k*f of amide can reflect the change of the pre-set values in the simulations. When the semi-solid MT pool fraction changes from 0.036 to 0.072, the fitted k*f of amide can be affected, but the impact on the results is limited.The phantom experiments suggested that the fitted amide k*f, NOE k*f and T1 map have linear relationships with BSA concentrations with R2 = 0.9862, 0.9515 and 0.6518, respectively.
For patients with glioblastoma, low-value regions on fitted NOE k*f maps are consistent with the highlight regions on T2W maps. The highlight regions on fitted amide images are consistent with the hyperintensities on Gd-T1W maps, which is a smaller enhanced area than those on conventional APTw images.
CONCLUSION
The QUEST-like method for simultaneous NOE and amide quantification at 3T is proved by simulations and phantom experiments. The method could be helpful for the analysis of tumor patients’ data.Acknowledgements
This work was supported by the National Natural Science Foundation of China [grant numbers 82071914].References
[1] Zaiss M, Windschuh J, Paech D, et al. Relaxation-compensated CEST-MRI of the human brain at 7T: Unbiased insight into NOE and amide signal changes in human glioblastoma. Neuroimage. 2015;112:180-188. doi:10.1016/j.neuroimage.2015.02.040
[2] McMahon MT, Gilad AA, Zhou J, Sun PZ, Bulte JW, van Zijl PC. Quantifying exchange rates in chemical exchange saturation transfer agents using the saturation time and saturation power dependencies of the magnetization transfer effect on the magnetic resonance imaging signal (QUEST and QUESP): Ph calibration for poly-L-lysine and a starburst dendrimer. Magn Reson Med. 2006;55(4):836-847. doi:10.1002/mrm.20818
[3] Zaiss M, Angelovski G, Demetriou E, McMahon MT, Golay X, Scheffler K. QUESP and QUEST revisited - fast and accurate quantitative CEST experiments. Magn Reson Med. 2018;79(3):1708-1721. doi:10.1002/mrm.26813
[4] Song X, Xu J, Xia S, et al. Multi-echo length and offset VARied saturation (MeLOVARS) method for improved CEST imaging. Magn Reson Med. 2015;73(2):488-496. doi:10.1002/mrm.25567
[5] Chen Z, Wang Y, He L, et al. Parametric VARied Saturation (PaVARS) for enhanced CEST characterization of human brain at 3T. ISMRM 2021. Abstract# 1817.
Figures